 Duplex
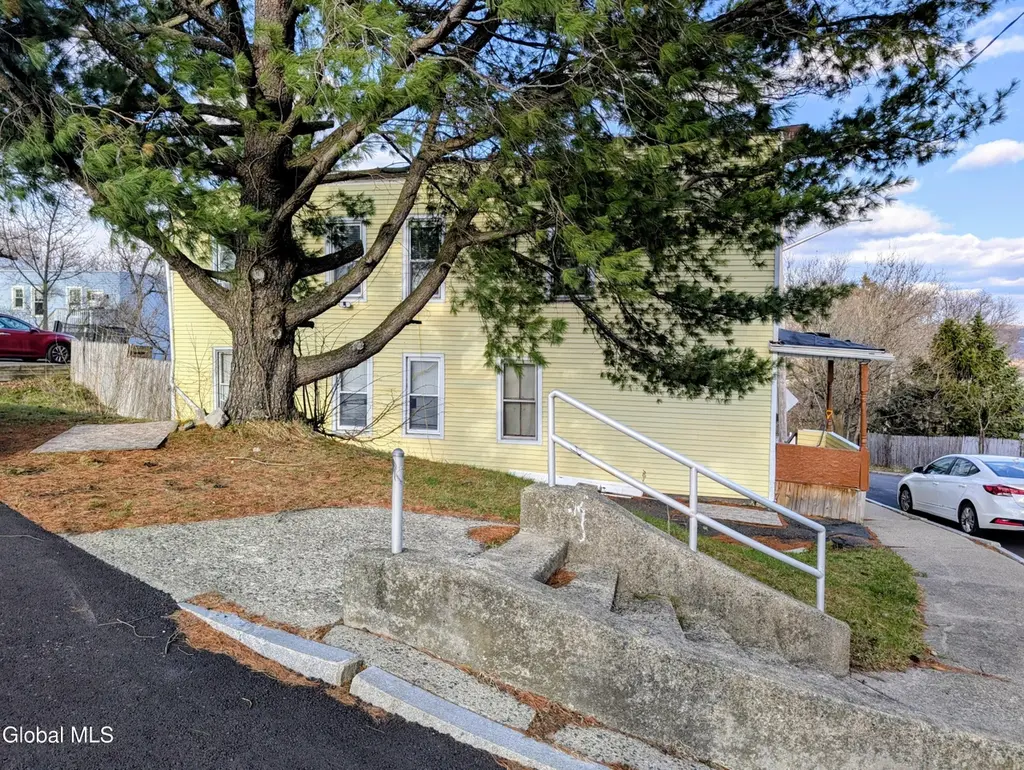
21 Morris St · Cohoes, NY
Flood risk 1/10 · Minimal
- FEMA flood zone
- X (unshaded)
- Chance of flooding over 30 yrs
- 0.0%
- Est. flood insurance / yr
- $473 – $860
Fire risk 2/10 · Minimal
- Est. fire insurance / yr
- $691 – $1,283
Heat risk 4/10 · Minor
- Hot days now (above 98°F)
- 7 days/yr
- Hot days in 30 yrs
- 16 days/yr
Wind risk 3/10 · Minor
- Chance of severe wind over 30 yrs
- 7.0%
Air-quality risk 2/10 · Minimal
- Unhealthy air days now
- 0 days/yr
- Unhealthy air days in 30 yrs
- 1 days/yr
Risk factors via First Street. Map © Google.
Why this score? — see what drove the B+ grade
The composite is a weighted blend of 9 inputs, each scored 0–100. Each bar is that input's sub-score; the figure is the points it added to the 100-point composite (weight × sub-score).
- Cash flow +30.0/30.0
- ARV discount +15.0/15.0
- 1% rule +10.0/10.0
- DSCR +10.0/10.0
- Rent growth +4.4/5.0
- Livability +4.2/5.0
- Schools +3.6/10.0
- Condition / age +2.5/5.0
- Appreciation +0.0/10.0
$226,500
🖨 Deal sheet 📄 Offer letter ✓ Due diligence
Multi-family units
County records classify this as Multi-Family (2-4 Unit). Listing-text estimate: 2 units. confirmed
Listing remarks MLS
Welcome to 21 Morris Street--where charm, comfort, and convenience come together in the heart of Cohoes! This two family home offers the perfect blend of classic character and modern-day livability, making it an ideal fit for first-time buyers, those looking to invest, and those looking to settle into a vibrant community. Step inside to find a warm and inviting layout filled with natural light, spacious living areas, and thoughtful details throughout. This home offers the flexibility and comfort you've been looking for. The yard is perfect for entertaining, gardening, or simply relaxing outdoors. Conveniently located near local shops, restaurants, parks, and major highways, you'll love the easy access to everything the Capital Region has to offer. Don't miss your chance to own a move-in ready home in a growing and desirable area--schedule your showing today!
Key facts
- Move-in ready home
- Parks
- Restaurants
Tags
Neighborhood map
What this means for you Summary
Snapshot
- This is a 2 × 4-bed/1.0-bath units multifamily listed at $226k.
Deal economics
- At list price, monthly cash flow is $2k ($21k/yr) — positive. Per door: $862/mo.
- The deal already cash-flows at list — no discount required.
- Meets the 1% rule at list price ($4k rent vs $226k).
- Recommended offer: $213k (6.0% below list) — sets the bar for market timing.
- Cap rate 15.4% vs local median 4.7% in Cohoes — top-decile yield for the area; either an underpriced asset or a hidden risk that comps aren't pricing in. Stress-test before assuming the spread holds.
Location & tenants
- Location reads 83/100 on livability (#61 in NY, #895 nationally) — a professional / high-income tenant draw. Strengths: amenities A+, commute A+, housing A+; Watch: employment C-.
- Cohoes City School District (suburban): math 38% / reading 48% proficiency, ranked #487 of 590 in NY (top 82%) — families likely to look elsewhere, expect single-tenant / working-renter base with shorter leases.
- Market conditions: Rents rising fast (+7.6%/yr); 114 active listings in the ZIP; 6 comparable units currently listed for rent nearby; rentals at typical pace (median 19d on market — plan ~3-4 weeks tenant-placement turnaround); 675 units permitted in Albany County in 2024 (451 in 5+ unit buildings).
- At $4,354/mo this rent would consume 79% of the median local household income ($66k/yr) (locally 1395% of renters already pay >50% of income on rent) — very limited rent-growth headroom before tenants either downsize or default.
Forward outlook
- Local home prices are declining (-3.0%/yr); year-one equity from $2k of loan paydown is wiped out by about $7k of value loss. Plan a longer hold.
- Albany County population projected at +9% by 2050 — modest demand growth; plan on rents tracking national, not racing it.
- At projected returns (-3.0% appreciation + 7.6% rent growth), your $63k cash investment doubles in ~4 years — after that, you're playing with house money.
Negotiation context
- It's been on market 64 days — a 6% lower offer ($213k) is reasonable based on typical stale-listing flexibility.
- Current owner paid $76k; list at $226k implies a 198% gain — meaningful room to come down on a strong offer.
Risks & watch-outs
- Watch-outs: built in 1910 — expect roof / HVAC / electrical / plumbing capex.
Questions for the listing agent
- It's been on market 64 days. Have you received any prior offers? Is the seller open to a 6% concession, seller financing, or rate buy-down credit?
- Can we see the unit-by-unit rent roll, current vacancy, and any below-market leases? What's the average tenancy length?
- What capital expenditures (roof, boiler, parking lot, exteriors) have been made in the last 5 years, and what's planned in the next 2?
- Built in 1910 — when were the roof, HVAC, electrical panel, plumbing, and water heater last replaced?
- Why hasn't it sold? Are there any deal-killer items the seller is aware of (foundation, flood, title, zoning, code violations)?
- Is there a deadline driving the sale (1031 exchange, divorce, estate, relocation)? That informs how much negotiation room exists.
- What's the average days-on-market for RENTAL listings here right now (not sales)? A rising rental-DOM trend means longer vacancies and softer asking-rent achievability than the comps imply.
- What's the recent tenant-quality profile in this submarket — average credit score on applications, eviction rate, late-payment / NSF rate, and stable-employment percentage? A property-management company in the area should have these aggregated.
- How much new apartment / multifamily construction is in the pipeline within 1–3 miles? Heavy new supply (>2% of stock underway) typically softens rents 12–24 months out; light construction supports rent growth.
Investment metrics
- 1% rule
- 1.92% ✓
- Cap rate
- 15.43%
- Cash-on-cash
- 32.63%
- DSCR
- 2.45
- GRM
- 4.3
CMA / ARV
- ARV (median comp)
- $415,175
- List price
- $226,500
- Delta
- -45.44%
- Verdict
- UNDERPRICED
- Comps
- 20 within 1.0 mi
Show comp detail 12 sales within ~0.75 mi
| Address | Dist | Beds/Ba | Sqft | Sold | Price | $/sf | Match |
|---|---|---|---|---|---|---|---|
| 35 Grant St | 0.53mi | 4/2.0 | 2,100 (-2%) | 0mo | $150,000 | $71 | 71 |
| 47 Younglove Ave | 0.56mi | 4/2.0 | 2,182 (+2%) | 10mo | $235,000 | $108 | 62 |
| 35 Mangam St | 0.25mi | 4/4.0 | 2,320 (+8%) | 10mo | $356,000 | $153 | 58 |
| 61 Main St | 0.74mi | 4/2.0 | 2,040 (-5%) | 10mo | $317,000 | $155 | 49 |
| 48 Watervliet Ave | 0.49mi | 5/2.5 (+1) | 2,344 (+9%) | 10mo | $143,000 | $61 | 46 |
| 7 Grove St | 0.52mi | 4/3.0 | 2,314 (+8%) | 15mo | $285,000 | $123 | 46 |
| 4 Congress St | 0.61mi | 4/2.5 | 1,848 (-14%) | 3mo | $160,000 | $87 | 44 |
| 41 Saratoga Ave | 0.67mi | 4/2.0 | 1,842 (-14%) | 4mo | $375,000 | $204 | 42 |
| 46 White St | 0.64mi | 5/2.0 (+1) | 1,900 (-11%) | 10mo | $250,000 | $132 | 38 |
| 47 Imperial Ave | 0.70mi | 4/2.0 | 1,848 (-14%) | 13mo | $158,950 | $86 | 33 |
| 41 Congress St | 0.69mi | 4/2.0 | 1,848 (-14%) | 15mo | $152,000 | $82 | 33 |
| 58 Congress St | 0.74mi | 3/3.0 (-1) | 2,334 (+9%) | 16mo | $200,000 | $86 | 29 |
Match score weights: distance 35% · size 25% · config 20% · recency 20%. Top-matched comps best support the ARV.
Projected returns pro-forma
-3.0% appreciation · 7.6% rent growth · sell at horizon
- IRR
- 33.1%
- Equity multiple
- 2.49×
- Total profit
- $94,362
- Equity at exit
- $33,772
- IRR
- 42.6%
- Equity multiple
- 6.04×
- Total profit
- $319,385
- Equity at exit
- $19,584
Cash invested: $63,420 (down + closing). Projections, not guarantees.
Landlord ↔ Tenant lean methodology
- Overall (STATE)
- 15 Strongly Tenant-Friendly
- State New York
- 15 Strongly Tenant-Friendly · D+10
- County
- — inherits STATE
- City
- — inherits STATE
ZIP-level market 12047
- Home prices YoY
- -10.7%
- Rents YoY
- 7.6%
- Active inventory
- 114
- Price-to-rent
- 8.7×
Monthly cashflow live
- Estimated rent
- $4,354 high interval (Pro) →
- Mortgage (P&I)
- −$1,188
- Tax from tax record
- −$433 /mo · $5,199/yr
- Insurance
- −$94
- HOA
- −$0
- Vacancy / Maint / Mgmt
- −$914
- Net cashflow
- $1,724
Break-even live
2-unit breakdown (identical units grouped — click to expand)
| Units | Beds | Baths | Est. rent |
|---|---|---|---|
| 2× units | 4 | 1 | $4,354 |
| #1 | 4 | 1 | $2,177 |
| #2 | 4 | 1 | $2,177 |
| Total (2 units) | $4,354 | ||
UW: 25.0% down · 7.5% · 30yr · 1.5% tax · 5.0% vac · 8.0% maint · 8.0% mgmt
Financing live
Cash to close
- Down payment
- $56,625
- Closing costs
- $6,795
- Reserves months
- —
- Total cash needed
- —
Loan-product check · same deal, 3 products live
Conventional
25% down · 7.5% · 30yr
- Down + closing
- —
- Monthly P&I
- —
- Monthly cashflow
- —
- DSCR
- —
- Eligible?
- —
Personal DTI + credit; lowest rate.
DSCR
20% down · 8.5% · 30yr
- Down + closing
- —
- Monthly P&I
- —
- Monthly cashflow
- —
- DSCR
- —
- Eligible?
- —
No personal income docs; deal must DSCR.
Hard money
10% down · 12.0% · 12mo
- Down + closing
- —
- Monthly P&I
- —
- Monthly cashflow
- —
- DSCR
- —
- Eligible?
- —
Short-term bridge; refi at stabilization.
Rent comps 6 comps
| Address | Beds | Baths | Sqft | Rent | $/sqft | DOM | Units | Dist |
|---|---|---|---|---|---|---|---|---|
| 100 N Mohawk St Cohoes, NY | 1.0–3.0 | 1.0–3.0 | 1769 | $3,840 | $2.17 | 14d | 18 | 0.12mi |
| 6 Hamilton Pl Unit 2 Cohoes, NY | 3.0 | 1.0 | 2300 | $1,999 | $0.87 | 18d | 1 | 0.13mi |
| 8 Cindy Way Cohoes, NY | 3.0 | 1.5 | 1420 | $2,300 | $1.62 | 43d | 1 | 0.28mi |
| 12 White St Cohoes, NY | 3.0 | 2.0 | 1790 | $2,895 | $1.62 | 18d | 1 | 0.70mi |
| 192 Saratoga St Cohoes, NY | 1.0–3.0 | 1.0–3.0 | 1157 | $2,600 | $2.25 | 14d | 4 | 0.81mi |
| 53 Park Ave Cohoes, NY | 3.0 | 1.0 | 1875 | $1,600 | $0.85 | 14d | 1 | 1.14mi |
Listing history 17 events
-
2026-06-18days on market $226,500 Active 64 DOM
-
2026-06-17days on market $226,500 Active 63 DOM
-
2026-06-16days on market $226,500 Active 62 DOM
-
2026-06-15days on market $226,500 Active 61 DOM
-
2026-06-14days on market $226,500 Active 59 DOM
-
2026-06-13days on market $226,500 Active 58 DOM
-
2026-06-10days on market $226,500 Active 56 DOM
-
2026-06-09days on market $226,500 Active 55 DOM
-
2026-06-08days on market $226,500 Active 54 DOM
-
2026-06-07days on market $226,500 Active 53 DOM
-
2026-06-03days on market $226,500 Active 49 DOM
-
2026-06-02days on market $226,500 Active 48 DOM
-
2026-06-01days on market $226,500 Active 47 DOM
-
2026-05-31days on market $226,500 Active 46 DOM
-
2026-05-31days on market $226,500 Active 45 DOM
-
2026-04-15$226,500 Active 880-char remark
Show marketing remark (880 chars)
Welcome to 21 Morris Street--where charm, comfort, and convenience come together in the heart of Cohoes! This two family home offers the perfect blend of classic character and modern-day livability, making it an ideal fit for first-time buyers, those looking to invest, and those looking to settle into a vibrant community. Step inside to find a warm and inviting layout filled with natural light, spacious living areas, and thoughtful details throughout. This home offers the flexibility and comfort you've been looking for. The yard is perfect for entertaining, gardening, or simply relaxing outdoors. Conveniently located near local shops, restaurants, parks, and major highways, you'll love the easy access to everything the Capital Region has to offer. Don't miss your chance to own a move-in ready home in a growing and desirable area--schedule your showing today!
-
1999-07-27soldstatus $76,000
ⓘ Source: listings_history table (triggers on properties + properties_extension) + one-shot
backfill from property_details.listing_events for pre-trigger history.
Tax reassessment forecast NY · Partial reset (capped growth)
- Current annual tax
- $5,199 · $433/mo
- Projected year-2 tax
- $5,199 · $433/mo
- Expected delta
- $0/yr ($0/mo · 0.0%)
ⓘ Screening estimate from a state-policy table — verify with the county assessor before closing.
Climate risk First Street
- Flood 1/10 Low FEMA zone X (unshaded) · 0% chance over 30 yrs
- Wildfire 2/10 Low
- Heat 4/10 Moderate 7 d/yr ≥98°F today · 16 d/yr by 30 yrs out
- Wind 3/10 Moderate 7% chance of damaging wind over 30 yrs
- Air quality 2/10 Low 0 unhealthy d/yr today · 1 by 30 yrs out
Nearby sold comps map
Loading sold comps map…
Walkable amenities ~0.75 mi
Loading nearby amenities…
Taxation est. · year 1
- Rental income
- $52,248
- − Mortgage interest
- −$12,688
- − Property taxes
- −$5,199
- − Insurance
- −$1,132
- − Repairs & maintenance
- −$4,180
- − Management
- −$4,180
- − Depreciation
- −$6,589
- Taxable income
- $18,281
- Est. tax owed @ 24.0%
- −$4,387
- After-tax cash flow
- $16,304/yr
For passive investors: Depreciation is non-cash, so a rental often shows a tax loss while cash-flowing — sheltering income. Rental losses are passive: they offset passive income freely, and up to $25,000/yr can offset ordinary (W-2) income if you actively participate and your MAGI is under $100k (phasing out to $0 by $150k); unused losses carry forward. On sale, claimed depreciation is recaptured at up to 25%, and gains may owe capital-gains tax (a 1031 exchange can defer both). Figures are a year-1 estimate at your 24.0% rate — not tax advice; consult a CPA.
Schools (NCES district)
- District
- Cohoes City School District
- NCES district ID
- 3607980
- Math proficiency
- 38% ▼ -4.00%
- Reading proficiency
- 48% ▲ 3.00%
- Median HH income
- $45,104
- Composite
- 36.48/100
- National rank
- #4655
- State rank
- #487 of 590 in NY
Livability — Cohoes
- Score
- 83/100
- State rank
- #61
- US rank
- #895
Category grades
Schools grade is shown separately in the Schools card above.
Census & demographics
- Census place
- Cohoes, NY
- County
- Albany County · 196,626 people
- City population
- 23,532
- Metro
- Albany-Schenectady-Troy, NY
- Population (ZIP)
- 23,532
- Household income
- $66,071
- Rent vs Own
- Severe rent burden
- 1395.0
Population outlook (Albany County) Hauer SSP2
- Today (2025)
- 320,794 people
- By 2030
- 327,401 · +2.1%
- By 2040
- 338,218 · +5.4%
- By 2050
- 348,467 · +8.6%
- By 2075
- 381,693 · +19.0%
- By 2100
- 393,809 · +22.8%
Race, ethnicity, and origin ACS 2023
- Neighborhood character
- Predominantly White (70%)
- Race & ethnicity
- White 70% Two or more races 11% Black 9% Hispanic / Latino 7% Asian 5%
- Hispanic origin (detail)
- Puerto Rican 3% Dominican 2%
- Common ancestry
- Lithuanian 8% Romanian 6% Iranian 2%
- Foreign-born
- 9% · Canada, China
- Languages at home
- 87% English-only · Spanish 3% Other Indo-European 3% Chinese 2%
Political lean MEDSL · Albany
- 2024 margin
- Strong D (+25.8) · D 62.9% · R 37.1%
- 2008→2024 swing
- -3.6pp toward R · 2008: 29.4pp · 2024: 25.8pp
- All cycles
- 2024: D+25.8 2020: D+31.4 2016: D+24.3 2012: D+31.0 2008: D+29.4
Not yet ingested
- Civics
- —
Market trends
- HPI YoY
- ▼ -38.15%
- Current HPI
- 317.4057
- Rent YoY
- ▲ 7.60%
- Metro
- Albany-Schenectady-Troy, NY
- State GDP YoY
- ▲ 2.60%
- F500 in state
- 92
Industry mix (Fortune 500 HQ in NY)
| Industry | F500 HQs | Revenue |
|---|---|---|
| Financial Services | 10 | $950B |
|
||
| Consumer Goods | 9 | $162B |
|
||
| Insurance | 4 | $225B |
|
||
| Telecommunications | 2 | $144B |
|
||
| Pharmaceuticals | 2 | $112B |
|
||
| Media / Entertainment | 2 | $69B |
|
||
Price history
+198.0% since first listed2 events — show timeline
- 2026-04-15 Listed $226,500 Global MLS
- 1999-07-27 Sold (Public Records) $76,000 Public Records
Property tax history
+10.1%/yrLatest (2025): $5,199 · +0.4% YoY. Source: county tax records.
Cash-flow waterfall
monthlySold comps — $/sqft
last 12 mo · ≤1 miLoading sold comps…