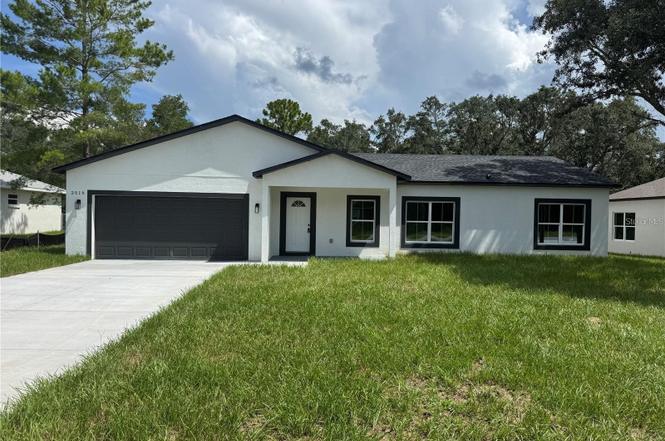
2019 W Hamshire Blvd · Pine Ridge, FL
Flood risk 1/10 · Minimal
- FEMA flood zone
- X (unshaded)
- Chance of flooding over 30 yrs
- 0.0%
- Est. flood insurance / yr
- $507 – $1,088
Fire risk 2/10 · Minimal
- Est. fire insurance / yr
- $947 – $1,759
Heat risk 9/10 · Severe
- Hot days now (above 107°F)
- 7 days/yr
- Hot days in 30 yrs
- 23 days/yr
Wind risk 9/10 · Severe
- Chance of severe wind over 30 yrs
- 99.0%
Air-quality risk 2/10 · Minimal
- Unhealthy air days now
- 0 days/yr
- Unhealthy air days in 30 yrs
- 1 days/yr
Risk factors via First Street. Map © Google.
Why this score? — see what drove the D- grade
The composite is a weighted blend of 9 inputs, each scored 0–100. Each bar is that input's sub-score; the figure is the points it added to the 100-point composite (weight × sub-score).
- Cash flow +10.7/30.0
- ARV discount +7.5/15.0
- Schools +4.1/10.0
- Livability +3.4/5.0
- 1% rule +3.2/10.0
- DSCR +3.1/10.0
- Rent growth +2.5/5.0
- Condition / age +2.5/5.0
- Appreciation +0.1/10.0
$239,989
🖨 Deal sheet (PDF) 📄 Offer letter ✓ Due diligence
Listing remarks
READY TO MOVE IN! Stunning New Construction -3Bed, 2 Bath Home in Citrus Springs! This exquisite 1,856 sq. ft. brand-new 3 bedroom, 2 bathroom home offers a perfect blend of modern elegance and functional design. The open-concept floor plan is filled with natural light, creating a warm and inviting atmosphere. The gourmet kitchen boasts countertops, sleek ceiling-height cabinetry, stainless steel appliances, and a spacious island-ideal for both cooking and entertaining. Throughout the home, luxury vinyl plank flooring and tile provides a seamless, low-maintenance look-no carpet anywhere! Expansive double sliding doors lead to a private backyard, offering plenty of space for outdoor relaxa
Key facts
- New construction
- Private backyard
- Front balcony
Tags
Property features AI
Finance
- Other: Homestead exempt; Lot about 0.23 acres (0 to less than 1/4 acre)
Exterior
- Parking: Attached garage; 2-car garage
- Utilities: Electricity available; Water available (public and private sources); Public sewer and private sewer
- Home design: Single family residence; Residential property; One level; Northeast facing; Completed condition; New construction
- Construction: Block and concrete construction; Shingle roof; Basement foundation; Built recently (new construction)
- Exterior features: Sliding doors; Asphalt road frontage
Interior
- Kitchen: Convection oven; Dishwasher; Microwave; Refrigerator
- Bedrooms: 3 bedrooms
- Flooring: Ceramic tile; Laminate
- Bathrooms: 2 full bathrooms
- Heating & cooling: Central heating; Central air conditioning
- Interior features: Open floorplan; Thermostat; Walk-in closet(s); Basement (other)
- Laundry & utility: Laundry room
Neighborhood map
What this means for you Summary
Snapshot
- This is a 3-bed/2.0-bath land listed at $240k.
Deal economics
- At list price, monthly cash flow is $-113 ($-1k/yr) — negative.
- To cash-flow at today's rent, offer at most $224k (6.8% below list).
- To meet the 1% rule (rent ≥ 1% of price), the offer needs to be $196k (18.5% below list).
- Recommended offer: $196k (18.5% below list) — sets the bar for 1% rule.
- Cap rate 5.7% vs local median 3.4% in Pine Ridge — top-decile yield for the area; either an underpriced asset or a hidden risk that comps aren't pricing in. Stress-test before assuming the spread holds.
Location & tenants
- Location reads 67/100 on livability (#565 in FL) — a middle-class / working-renter tenant base. Strengths: crime A+, housing A+, cost of living A-; Watch: health & safety C-, amenities F, commute F.
- Citrus (rural): math 49% / reading 50% proficiency, ranked #44 of 73 in FL (top 60%) — families likely to look elsewhere, expect single-tenant / working-renter base with shorter leases.
- Zoned schools: Central Ridge Elementary School (math 41% / reading 44%, grade F, #1,383 of 2,144 statewide, top 65%, 723 students, 64% FRL); Citrus Springs Middle School (math 55% / reading 54%, grade B-, #183 of 571 statewide, top 34%, 821 students, 59% FRL); Lecanto High School (math 46% / reading 53%, grade D, #179 of 667 statewide, top 29%, 1,630 students, 46% FRL) — zoned schools at 56% FRL track the district average.
- Market conditions: 1247 active listings in the ZIP; 16 comparable units currently listed for rent nearby; rentals at typical pace (median 23d on market — plan ~3-4 weeks tenant-placement turnaround); 2,443 units permitted in Citrus County in 2024 (0 in 5+ unit buildings).
- This rent runs 34% of the median local income ($69k/yr) — at the standard rent-burdened threshold; future hikes will face affordability resistance.
Forward outlook
- Local home prices are declining (-3.0%/yr); year-one equity from $2k of loan paydown is wiped out by about $7k of value loss. Plan a longer hold.
- Citrus County population projected to shrink 10% by 2050 — rents likely to lag national; underwrite the cash flow, not the appreciation.
Negotiation context
- It's been on market 136 days — a 12% lower offer ($211k) is reasonable based on typical stale-listing flexibility.
- 5 sale attempts since 17y ago; this cycle's ask has dropped $19k (7%) from the opening price — seller is motivated, your offer sets the floor, not the list.
- Current owner paid $10k; list at $240k implies a 2300% gain — meaningful room to come down on a strong offer.
Risks & watch-outs
- Climate carrying-cost: severe wind risk, 99% chance of damaging wind over 30y; extreme-heat days projected 7→23/yr by 2055 (HVAC capex compounding) — expect insurance premiums to compound above CPI over the hold.
Questions for the listing agent
- What do current leases actually rent for vs. the listed asking? Can we see a recent rent roll and the last 12 months of T-12 income?
- It's been on market 136 days. Have you received any prior offers? Is the seller open to a 18% concession, seller financing, or rate buy-down credit?
- Why hasn't it sold? Are there any deal-killer items the seller is aware of (foundation, flood, title, zoning, code violations)?
- Is there a deadline driving the sale (1031 exchange, divorce, estate, relocation)? That informs how much negotiation room exists.
- Schools are F-rated, which usually means shorter tenancies and higher turnover. Who's the typical renter profile here, and what's been the actual vacancy rate?
- The area grade is low — what's the realistic commute time and amenity access for the typical tenant pool here? Any planned neighborhood developments (good or bad) we should know about?
- What's the average days-on-market for RENTAL listings here right now (not sales)? A rising rental-DOM trend means longer vacancies and softer asking-rent achievability than the comps imply.
- What's the recent tenant-quality profile in this submarket — average credit score on applications, eviction rate, late-payment / NSF rate, and stable-employment percentage? A property-management company in the area should have these aggregated.
- How much new for-sale + rental construction is in the pipeline within 1–3 miles? Heavy new supply typically softens prices + rents 12–24 months out; constrained supply supports both.
Investment metrics
- 1% rule
- 0.82% ✗
- Cap rate
- 5.73%
- Cash-on-cash
- -2.01%
- DSCR
- 0.91
- GRM
- 10.2
CMA / ARV
No comps found within radius.
Projected returns pro-forma
-3.0% appreciation · 3.0% rent growth · sell at horizon
- IRR
- -19.6%
- Equity multiple
- 0.31×
- Total profit
- $-46,031
- Equity at exit
- $35,783
- IRR
- -12.4%
- Equity multiple
- 0.27×
- Total profit
- $-49,198
- Equity at exit
- $20,750
Cash invested: $67,197 (down + closing). Projections, not guarantees.
Landlord ↔ Tenant lean methodology
- Overall (STATE)
- 87 Strongly Landlord-Friendly
- State Florida
- 87 Strongly Landlord-Friendly · R+3
- County
- — inherits STATE
- City
- — inherits STATE
ZIP-level market 34434
- Home prices YoY
- -2.9%
- Active inventory
- 1247
- Price-to-rent
- 10.2×
Monthly cashflow live
- Estimated rent
- $1,957 high interval (Pro) →
- Mortgage (P&I)
- −$1,259
- Tax est. 1.5%
- −$300 /mo · $3,600/yr
- Insurance
- −$100
- HOA
- −$0
- Vacancy / Maint / Mgmt
- −$411
- Net cashflow
- $-113
Break-even live
Sensitivity live
| Price | -10% $53 | -5% $-30 | +0% $-113 | +5% $-196 | +10% $-278 |
|---|---|---|---|---|---|
| Rent | -10% $-267 | -5% $-190 | +0% $-113 | +5% $-35 | +10% $42 |
| Rate | -1.0pp $8 | -0.5pp $-52 | base $-113 | +0.5pp $-175 | +1.0pp $-238 |
UW: 25.0% down · 7.5% · 30yr · 1.5% tax · 5.0% vac · 8.0% maint · 8.0% mgmt
Financing live
Cash to close
- Down payment
- $59,997
- Closing costs
- $7,200
- Reserves months
- —
- Total cash needed
- —
Loan-product check · same deal, 3 products live
Conventional
25% down · 7.5% · 30yr
- Down + closing
- —
- Monthly P&I
- —
- Monthly cashflow
- —
- DSCR
- —
- Eligible?
- —
Personal DTI + credit; lowest rate.
DSCR
20% down · 8.5% · 30yr
- Down + closing
- —
- Monthly P&I
- —
- Monthly cashflow
- —
- DSCR
- —
- Eligible?
- —
No personal income docs; deal must DSCR.
Hard money
10% down · 12.0% · 12mo
- Down + closing
- —
- Monthly P&I
- —
- Monthly cashflow
- —
- DSCR
- —
- Eligible?
- —
Short-term bridge; refi at stabilization.
Rent comps 16 comps
| Address | Beds | Baths | Sqft | Rent | $/sqft | DOM | Units | Dist |
|---|---|---|---|---|---|---|---|---|
| 2117 W Swanson Dr Citrus Springs, FL | 4.0 | 2.0 | 1580 | $1,850 | $1.17 | 23d | 1 | 0.13mi |
| 1482 W Manchester Dr Dunnellon, FL | 3.0 | 2.0 | 1540 | $1,695 | $1.10 | 23d | 1 | 0.52mi |
| 2195 W Tall Oaks Dr Beverly Hills, FL | 3.0 | 2.0 | 1688 | $2,200 | $1.30 | 23d | 1 | 0.60mi |
| 6251 W Whispering Dr Citrus Springs, FL | 4.0 | 2.0 | 1617 | $1,815 | $1.12 | 23d | 1 | 0.61mi |
| 7175 N Varsity Ave Citrus Springs, FL | 3.0 | 2.0 | 1428 | $1,795 | $1.26 | 23d | 1 | 0.82mi |
| 5825 N Larkspur Way Beverly Hills, FL | 3.0 | 2.0 | 1618 | $2,300 | $1.42 | 23d | 1 | 0.97mi |
| 669 W Homeway Loop Citrus Springs, FL | 4.0 | 2.0 | 1580 | $1,895 | $1.20 | 23d | 1 | 1.01mi |
| 7047 N Lime Dr Citrus Springs, FL | 4.0 | 2.0 | 1630 | $1,900 | $1.17 | 23d | 1 | 1.10mi |
| 6865 N Pavilion Loop Citrus Springs, FL | 4.0 | 2.0 | 1674 | $1,850 | $1.11 | 23d | 1 | 1.25mi |
| 7062 N Regent Ter Citrus Springs, FL | 4.0 | 2.0 | 1621 | $1,700 | $1.05 | 23d | 1 | 1.28mi |
| 7061 N Outrigger Ter Citrus Springs, FL | 4.0 | 2.0 | 1621 | $1,700 | $1.05 | 23d | 1 | 1.30mi |
| 788 W Glenhaven Dr Citrus Springs, FL | 4.0 | 2.0 | 1621 | $1,800 | $1.11 | 23d | 1 | 1.34mi |
| 1912 W Quaker Ln Citrus Springs, FL | 4.0 | 2.0 | 1636 | $1,895 | $1.16 | 23d | 1 | 1.35mi |
| 1301 N Galgano St Dunnellon, FL | 4.0 | 3.0 | 2381 | $2,800 | $1.18 | 23d | 1 | 1.45mi |
| 3467 W Seahorse Ln Dunnellon, FL | 4.0 | 2.5 | 1846 | $2,100 | $1.14 | 23d | 1 | 1.46mi |
| 7708 N Paris Dr Dunnellon, FL | 3.0 | 2.0 | 1415 | $1,800 | $1.27 | 23d | 1 | 1.46mi |
Listing history 29 events
-
2026-06-18status $239,989 Pending 136 DOM
-
2026-06-17days on market $239,989 Active 136 DOM
-
2026-06-16days on market $239,989 Active 135 DOM
-
2026-06-15days on market $239,989 Active 134 DOM
-
2026-06-14days on market $239,989 Active 132 DOM
-
2026-06-13days on market $239,989 Active 131 DOM
-
2026-06-09days on market $239,989 Active 128 DOM
-
2026-06-08days on market $239,989 Active 127 DOM
-
2026-06-03days on market $239,989 Active 122 DOM
-
2026-06-02days on market $239,989 Active 121 DOM
-
2026-06-01days on market $239,989 Active 120 DOM
-
2026-05-31days on market $239,989 Active 119 DOM
-
2026-05-30days on market $239,989 Active 118 DOM
-
2026-05-22price $239,989
-
2026-02-01$259,000 Active
-
2026-01-01historical
-
2025-12-03price $255,000
-
2025-10-16price $260,000
-
2025-09-28price $270,000
-
2025-08-06$279,500 Active
-
2022-05-16soldstatus $10,000
-
2019-11-11historical
-
2012-09-11historical
-
2012-06-11$2,750
-
2012-06-07soldstatus $1,765
-
2012-04-02$2,500
-
2009-11-01soldstatus $328,200
-
2009-01-15$8,000
-
2004-08-24soldstatus $10,000
ⓘ Source: listings_history table (triggers on properties + properties_extension) + one-shot
backfill from property_details.listing_events for pre-trigger history.
Climate risk First Street
- Flood 1/10 Low FEMA zone X (unshaded) · 0% chance over 30 yrs
- Wildfire 2/10 Low
- Heat 9/10 Extreme 7 d/yr ≥107°F today · 23 d/yr by 30 yrs out
- Wind 9/10 Extreme 99% chance of damaging wind over 30 yrs
- Air quality 2/10 Low 0 unhealthy d/yr today · 1 by 30 yrs out
Nearby sold comps map
Loading sold comps map…
Walkable amenities ~0.75 mi
Loading nearby amenities…
Taxation est. · year 1
- Rental income
- $23,482
- − Mortgage interest
- −$13,443
- − Property taxes
- −$3,600
- − Insurance
- −$1,200
- − Repairs & maintenance
- −$1,879
- − Management
- −$1,879
- − Depreciation
- −$6,981
- Taxable loss
- −$5,499
- Est. tax savings @ 24.0%
- +$1,320
- After-tax cash flow
- $-31/yr
For passive investors: Depreciation is non-cash, so a rental often shows a tax loss while cash-flowing — sheltering income. Rental losses are passive: they offset passive income freely, and up to $25,000/yr can offset ordinary (W-2) income if you actively participate and your MAGI is under $100k (phasing out to $0 by $150k); unused losses carry forward. On sale, claimed depreciation is recaptured at up to 25%, and gains may owe capital-gains tax (a 1031 exchange can defer both). Figures are a year-1 estimate at your 24.0% rate — not tax advice; consult a CPA.
Schools (NCES district)
- District
- Citrus
- NCES district ID
- 1200270
- Math proficiency
- 49% ▼ -10.00%
- Reading proficiency
- 50% ▼ -6.00%
- Median HH income
- $38,618
- Composite
- 41.28/100
- National rank
- #3519
- State rank
- #44 of 73 in FL
Livability — Pine Ridge
- Score
- 67/100
- State rank
- #565
- US rank
- #10798
Category grades
Schools grade is shown separately in the Schools card above.
Census & demographics
- Census place
- Pine Ridge, FL
- County
- Citrus County · 111,314 people
- City population
- 18,514
- Metro
- Homosassa Springs, FL
- Population (ZIP)
- 11,074
- Household income
- $68,939
- Rent vs Own
- Severe rent burden
- 171.0
Population outlook (Citrus County) Hauer SSP2
- Today (2025)
- 138,622 people
- By 2030
- 136,886 · -1.3%
- By 2040
- 132,009 · -4.8%
- By 2050
- 125,196 · -9.7%
- By 2075
- 108,570 · -21.7%
- By 2100
- 84,454 · -39.1%
Race, ethnicity, and origin ACS 2023
- Neighborhood character
- Predominantly White (78%)
- Race & ethnicity
- White 78% Two or more races 11% Hispanic / Latino 9% Black 6%
- Hispanic origin (detail)
- Mexican 3% Puerto Rican 4%
- Common ancestry
- Iranian 3% Romanian 2% Slovak 2%
- Foreign-born
- 4% · Canada
- Languages at home
- 93% English-only · Spanish 5% German/W. Germanic 1% Other Indo-European 1%
Political lean MEDSL · Citrus
- 2024 margin
- Solid R (+45.9) · D 26.8% · R 72.6%
- 2008→2024 swing
- -29.8pp toward R · 2008: -16.1pp · 2024: -45.9pp
- All cycles
- 2024: R+45.9 2020: R+41.0 2016: R+39.7 2012: R+21.9 2008: R+16.1
Not yet ingested
- Civics
- —
Market trends
- HPI YoY
- ▼ -9.70%
- Current HPI
- 328.2164
- Rent YoY
- —
- Metro
- Homosassa Springs, FL
- State GDP YoY
- ▲ 3.28%
- F500 in state
- 36
Industry mix (Fortune 500 HQ in FL)
| Industry | F500 HQs | Revenue |
|---|---|---|
| Industrial Technology | 2 | $29B |
|
||
| Insurance | 2 | $17B |
|
||
| Retail | 1 | $60B |
|
||
| Technology Distribution | 1 | $58B |
|
||
| Homebuilding | 1 | $35B |
|
||
| Technology Manufacturing | 1 | $35B |
|
||
Price history
+2299.9% since first listed16 events — show timeline
- 2026-05-22 Price Changed $239,989 Stellar MLS as Distributed by MLS Grid
- 2026-02-01 Listed $259,000 Stellar MLS as Distributed by MLS Grid
- 2026-01-01 Listing Removed — Stellar MLS as Distributed by MLS Grid
- 2025-12-03 Price Changed $255,000 Stellar MLS as Distributed by MLS Grid
- 2025-10-16 Price Changed $260,000 Stellar MLS as Distributed by MLS Grid
- 2025-09-28 Price Changed $270,000 Stellar MLS as Distributed by MLS Grid
- 2025-08-06 Listed $279,500 Stellar MLS as Distributed by MLS Grid
- 2022-05-16 Sold (Public Records) $10,000 Public Records
- 2019-11-11 Listing Removed — HCAR
- 2012-09-11 Listing Removed — Stellar MLS as Distributed by MLS Grid
- 2012-06-11 Listed $2,750 Stellar MLS as Distributed by MLS Grid
- 2012-06-07 Sold (MLS) $1,765 Stellar MLS as Distributed by MLS Grid
- 2012-04-02 Listed $2,500 Stellar MLS as Distributed by MLS Grid
- 2009-11-01 Sold (Public Records) $328,200 Public Records
- 2009-01-15 Listed $8,000 HCAR
- 2004-08-24 Sold (Public Records) $10,000 Public Records
Property tax history
+2.3%/yrLatest (2025): $268 · +46.9% YoY. Source: county tax records.
Cash-flow waterfall
monthlySold comps — $/sqft
last 12 mo · ≤1 miLoading sold comps…