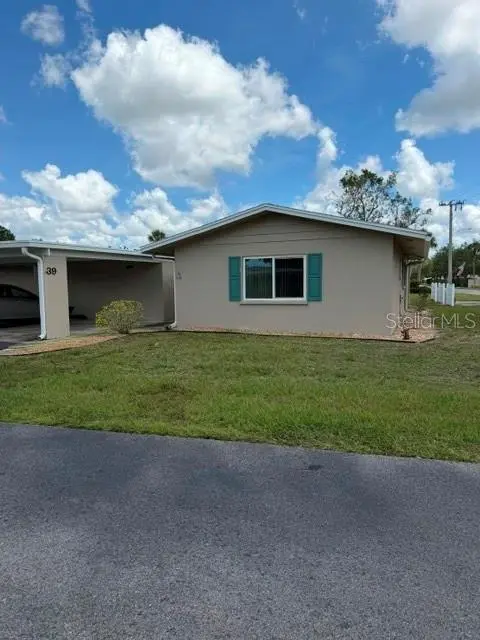
39 Strathmore Blvd · Bee Ridge, FL
Flood risk 1/10 · Minimal
- FEMA flood zone
- X (unshaded)
- Chance of flooding over 30 yrs
- 0.0%
- Est. flood insurance / yr
- $507 – $1,088
Fire risk 1/10 · Minimal
- Est. fire insurance / yr
- $947 – $1,759
Heat risk 10/10 · Severe
- Hot days now (above 107°F)
- 7 days/yr
- Hot days in 30 yrs
- 30 days/yr
Wind risk 10/10 · Severe
- Chance of severe wind over 30 yrs
- 99.0%
Air-quality risk 2/10 · Minimal
- Unhealthy air days now
- 1 days/yr
- Unhealthy air days in 30 yrs
- 1 days/yr
Risk factors via First Street. Map © Google.
Why this score? — see what drove the B grade
The composite is a weighted blend of 9 inputs, each scored 0–100. Each bar is that input's sub-score; the figure is the points it added to the 100-point composite (weight × sub-score).
- Cash flow +30.0/30.0
- 1% rule +10.0/10.0
- DSCR +10.0/10.0
- ARV discount +7.5/15.0
- Schools +5.4/10.0
- Livability +3.6/5.0
- Condition / age +2.5/5.0
- Rent growth +2.2/5.0
- Appreciation +0.0/10.0
$140,000
🖨 Deal sheet 📄 Offer letter ✓ Due diligence
Listing remarks
One or more photo(s) has been virtually staged. This 2-bedroom, 2-bath villa with a covered carport offers an incredible opportunity to enjoy the best of Sarasota living in the sought-after 55+ community of Strathmore Villa. Featuring a spacious and functional floor plan, this residence provides comfortable, low-maintenance living with plenty of room to relax and entertain. Residents of Strathmore Villa enjoy a wealth of amenities, including a heated community pool, clubhouse, and shuffleboard courts, all set within a beautifully landscaped, pet-friendly community. The prime location just off Bee Ridge Road places you minutes from shopping, dining, healthcare facilities, and everyday conven
Key facts
- Shuffleboard courts
- Clubhouse
- Prime location
Tags
Property features AI
Finance
- Other: Lease restrictions apply
- Financial info: Total annual fees $3,288
- HOA & community: HOA with monthly fee of $274; Association approval required; Buyer approval required; Senior community; Pets allowed with size limit; Association: SunVast Properties / James Row
Exterior
- Parking: Carport with 1 space
- Utilities: Public water; Public sewer; Public utilities
- Home design: Villa (residential); One story; South-facing; Entry on main level
- Construction: Block construction; Shingle roof; Slab foundation; Built area approx. 1,275 sq. ft.
- Exterior features: Outdoor lighting; Paved road access
Interior
- Kitchen: Range; Refrigerator
- Bedrooms: 2 bedrooms
- Flooring: Carpet
- Bathrooms: 2 full bathrooms
- Heating & cooling: Electric heating; Central air conditioning
- Interior features: Living room/dining room combo
- Laundry & utility: Laundry: Other
Neighborhood map
What this means for you Summary
Snapshot
- This is a 2-bed/2.0-bath condo listed at $140k.
Deal economics
- At list price, monthly cash flow is $527 ($6k/yr) — positive.
- The deal already cash-flows at list — no discount required.
- Meets the 1% rule at list price ($2k rent vs $140k).
- Recommended offer: $138k (1.5% below list) — sets the bar for market timing.
Location & tenants
- Location reads 72/100 on livability (#370 in FL) — a middle-class / working-renter tenant base. Strengths: crime A+, housing A+, employment A-; Watch: amenities F, commute F.
- Sarasota (urban): math 63% / reading 63% proficiency, ranked #7 of 73 in FL (top 10%) — acceptable for families but not a draw, mixed tenant base, ~2y average lease.
- Market conditions: Rents soft (-1.4%/yr); 159 active listings in the ZIP; solid renter incomes; 7,466 units permitted in Sarasota County in 2024 (2,138 in 5+ unit buildings).
- This rent runs 36% of the median local income ($75k/yr) — at the standard rent-burdened threshold; future hikes will face affordability resistance.
Forward outlook
- Local home prices are declining (-3.0%/yr); year-one equity from $968 of loan paydown is wiped out by about $4k of value loss. Plan a longer hold.
- Sarasota County population projected at +20% by 2050 — long-run rental-demand tailwind backs the buy-and-hold thesis.
Negotiation context
- It's been on market 27 days — a 2% lower offer ($138k) is reasonable based on typical stale-listing flexibility.
- Current owner paid $57k; list at $140k implies a 146% gain — meaningful room to come down on a strong offer.
Risks & watch-outs
- Climate carrying-cost: severe wind risk, 99% chance of damaging wind over 30y; extreme-heat days projected 7→30/yr by 2055 (HVAC capex compounding) — expect insurance premiums to compound above CPI over the hold.
Questions for the listing agent
- Built in 1968 — when were the roof, HVAC, electrical panel, plumbing, and water heater last replaced?
- What does the HOA fee cover, when was the last increase, and are there any pending special assessments or reserve-fund shortfalls?
- Any open or pending special assessments — roof, HVAC, plumbing, elevator, façade? What's the per-unit balance and payoff schedule, and is the seller paying it off at close or rolling it to the buyer?
- Is there a deadline driving the sale (1031 exchange, divorce, estate, relocation)? That informs how much negotiation room exists.
- Schools are B-rated — typically a magnet for longer-tenancy family renters. What's the average tenant stay here, and is there a school-zone premium baked into asking?
- What's the average days-on-market for RENTAL listings here right now (not sales)? A rising rental-DOM trend means longer vacancies and softer asking-rent achievability than the comps imply.
- What's the recent tenant-quality profile in this submarket — average credit score on applications, eviction rate, late-payment / NSF rate, and stable-employment percentage? A property-management company in the area should have these aggregated.
- How much new apartment / multifamily construction is in the pipeline within 1–3 miles? Heavy new supply (>2% of stock underway) typically softens rents 12–24 months out; light construction supports rent growth.
Investment metrics
- 1% rule
- 1.62% ✓
- Cap rate
- 10.81%
- Cash-on-cash
- 16.13%
- DSCR
- 1.72
- GRM
- 5.1
CMA / ARV
No comps found within radius.
Projected returns pro-forma
-3.0% appreciation · 0.0% rent growth · sell at horizon
- IRR
- 3.1%
- Equity multiple
- 1.11×
- Total profit
- $4,439
- Equity at exit
- $20,874
- IRR
- 8.8%
- Equity multiple
- 1.57×
- Total profit
- $22,236
- Equity at exit
- $12,105
Cash invested: $39,200 (down + closing). Projections, not guarantees.
Landlord ↔ Tenant lean methodology
- Overall (STATE)
- 87 Strongly Landlord-Friendly
- State Florida
- 87 Strongly Landlord-Friendly · R+3
- County
- — inherits STATE
- City
- — inherits STATE
ZIP-level market 34233
- Rents YoY
- -1.4%
- Active inventory
- 159
- Price-to-rent
- 5.1×
Monthly cashflow live
- Estimated rent
- $2,273 medium interval (Pro) →
- Mortgage (P&I)
- −$734
- Tax from tax record
- −$202 /mo · $2,427/yr
- Insurance
- −$58
- HOA
- −$274
- Vacancy / Maint / Mgmt
- −$477
- Net cashflow
- $527
Break-even live
UW: 25.0% down · 7.5% · 30yr · 1.5% tax · 5.0% vac · 8.0% maint · 8.0% mgmt
Financing live
Cash to close
- Down payment
- $35,000
- Closing costs
- $4,200
- Reserves months
- —
- Total cash needed
- —
Loan-product check · same deal, 3 products live
Conventional
25% down · 7.5% · 30yr
- Down + closing
- —
- Monthly P&I
- —
- Monthly cashflow
- —
- DSCR
- —
- Eligible?
- —
Personal DTI + credit; lowest rate.
DSCR
20% down · 8.5% · 30yr
- Down + closing
- —
- Monthly P&I
- —
- Monthly cashflow
- —
- DSCR
- —
- Eligible?
- —
No personal income docs; deal must DSCR.
Hard money
10% down · 12.0% · 12mo
- Down + closing
- —
- Monthly P&I
- —
- Monthly cashflow
- —
- DSCR
- —
- Eligible?
- —
Short-term bridge; refi at stabilization.
HOA detail condo
- Monthly dues
- $274 · $3,288/yr
- Likely covers
- pool
- Assessments
- None detected in remarks — confirm with the listing agent.
Listing history 18 events
-
2026-06-18days on market $140,000 Active 27 DOM
-
2026-06-17days on market $140,000 Active 26 DOM
-
2026-06-16days on market $140,000 Active 25 DOM
-
2026-06-15days on market $140,000 Active 24 DOM
-
2026-06-13days on market $140,000 Active 22 DOM
-
2026-06-13days on market $140,000 Active 21 DOM
-
2026-06-10days on market $140,000 Active 19 DOM
-
2026-06-09days on market $140,000 Active 18 DOM
-
2026-06-08days on market $140,000 Active 17 DOM
-
2026-06-08days on market $140,000 Active 16 DOM
-
2026-06-05days on market $140,000 Active 13 DOM
-
2026-06-03days on market $140,000 Active 12 DOM
-
2026-06-02days on market $140,000 Active 11 DOM
-
2026-06-01days on market $140,000 Active 10 DOM
-
2026-05-31days on market $140,000 Active 9 DOM
-
2026-05-22$140,000 Active
-
1990-03-12soldstatus $57,000
-
1985-02-01soldstatus $57,500
ⓘ Source: listings_history table (triggers on properties + properties_extension) + one-shot
backfill from property_details.listing_events for pre-trigger history.
Tax reassessment forecast FL · Resets to sale price
- Current annual tax
- $2,427 · $202/mo
- Projected year-2 tax
- $2,427 · $202/mo
- Expected delta
- $0/yr ($0/mo · 0.0%)
ⓘ Screening estimate from a state-policy table — verify with the county assessor before closing.
Climate risk First Street
- Flood 1/10 Low FEMA zone X (unshaded) · 0% chance over 30 yrs
- Wildfire 1/10 Low
- Heat 10/10 Extreme 7 d/yr ≥107°F today · 30 d/yr by 30 yrs out
- Wind 10/10 Extreme 99% chance of damaging wind over 30 yrs
- Air quality 2/10 Low 1 unhealthy d/yr today · 1 by 30 yrs out
Nearby sold comps map
Loading sold comps map…
Walkable amenities ~0.75 mi
Loading nearby amenities…
Taxation est. · year 1
- Rental income
- $27,278
- − Mortgage interest
- −$7,842
- − Property taxes
- −$2,427
- − Insurance
- −$700
- − Repairs & maintenance
- −$2,182
- − Management
- −$2,182
- − HOA
- −$3,288
- − Depreciation
- −$4,073
- Taxable income
- $4,584
- Est. tax owed @ 24.0%
- −$1,100
- After-tax cash flow
- $5,224/yr
For passive investors: Depreciation is non-cash, so a rental often shows a tax loss while cash-flowing — sheltering income. Rental losses are passive: they offset passive income freely, and up to $25,000/yr can offset ordinary (W-2) income if you actively participate and your MAGI is under $100k (phasing out to $0 by $150k); unused losses carry forward. On sale, claimed depreciation is recaptured at up to 25%, and gains may owe capital-gains tax (a 1031 exchange can defer both). Figures are a year-1 estimate at your 24.0% rate — not tax advice; consult a CPA.
Schools (NCES district)
- District
- Sarasota
- NCES district ID
- 1201680
- Math proficiency
- 63% ▼ -8.00%
- Reading proficiency
- 63% ▼ -3.00%
- Median HH income
- $51,167
- Composite
- 53.68/100
- National rank
- #1428
- State rank
- #7 of 73 in FL
Livability — Bee Ridge
- Score
- 72/100
- State rank
- #370
- US rank
- #6494
Category grades
Schools grade is shown separately in the Schools card above.
Census & demographics
- Census place
- Bee Ridge, FL
- County
- Sarasota County · 448,376 people
- City population
- 18,875
- Metro
- North Port-Sarasota-Bradenton, FL
- Population (ZIP)
- 19,123
- Household income
- $75,394
- Rent vs Own
- Severe rent burden
- 653.0
Population outlook (Sarasota County) Hauer SSP2
- Today (2025)
- 452,380 people
- By 2030
- 474,175 · +4.8%
- By 2040
- 511,577 · +13.1%
- By 2050
- 541,467 · +19.7%
- By 2075
- 604,947 · +33.7%
- By 2100
- 621,965 · +37.5%
Race, ethnicity, and origin ACS 2023
- Neighborhood character
- Predominantly White (78%)
- Race & ethnicity
- White 78% Hispanic / Latino 11% Two or more races 6% Asian 4% Black 2% Native American 1%
- Hispanic origin (detail)
- Mexican 3% Puerto Rican 2% Cuban 2%
- Common ancestry
- Romanian 3% Lithuanian 3% Slovak 2%
- Foreign-born
- 15% · Canada, Vietnam
- Languages at home
- 85% English-only · Spanish 8% Other Indo-European 2% Russian/Polish/Slavic 2%
Political lean MEDSL · Sarasota
- 2024 margin
- R (+18.2) · D 40.5% · R 58.7%
- 2008→2024 swing
- -18.1pp toward R · 2008: -0.1pp · 2024: -18.2pp
- All cycles
- 2024: R+18.2 2020: R+10.4 2016: R+11.6 2012: R+7.4 2008: R+0.1
Not yet ingested
- Civics
- —
Market trends
- HPI YoY
- ▼ -281.79%
- Current HPI
- 258.6836
- Rent YoY
- ▼ -1.35%
- Metro
- North Port-Sarasota-Bradenton, FL
- State GDP YoY
- ▲ 3.28%
- F500 in state
- 36
Industry mix (Fortune 500 HQ in FL)
| Industry | F500 HQs | Revenue |
|---|---|---|
| Industrial Technology | 2 | $29B |
|
||
| Insurance | 2 | $17B |
|
||
| Retail | 1 | $60B |
|
||
| Technology Distribution | 1 | $58B |
|
||
| Homebuilding | 1 | $35B |
|
||
| Technology Manufacturing | 1 | $35B |
|
||
Price history
+143.5% since first listed3 events — show timeline
- 2026-05-22 Listed $140,000 Stellar MLS as Distributed by MLS Grid
- 1990-03-12 Sold (Public Records) $57,000 Public Records
- 1985-02-01 Sold (Public Records) $57,500 Public Records
Property tax history
+12.9%/yrLatest (2025): $2,427 · +1.8% YoY. Source: county tax records.
Cash-flow waterfall
monthlySold comps — $/sqft
last 12 mo · ≤1 miLoading sold comps…