7929 Royal Ln #220 · Dallas, TX
Flood risk 1/10 · Minimal
- FEMA flood zone
- X (unshaded)
- Chance of flooding over 30 yrs
- 0.0%
- Est. flood insurance / yr
- $507 – $1,088
Fire risk 1/10 · Minimal
- Est. fire insurance / yr
- $1,222 – $2,270
Heat risk 7/10 · Major
- Hot days now (above 109°F)
- 7 days/yr
- Hot days in 30 yrs
- 23 days/yr
Wind risk 6/10 · Moderate
- Chance of severe wind over 30 yrs
- 27.0%
Air-quality risk 3/10 · Minor
- Unhealthy air days now
- 3 days/yr
- Unhealthy air days in 30 yrs
- 3 days/yr
Risk factors via First Street. Map © Google.
Why this score? — see what drove the D grade
The composite is a weighted blend of 9 inputs, each scored 0–100. Each bar is that input's sub-score; the figure is the points it added to the 100-point composite (weight × sub-score).
- 1% rule +9.5/10.0
- Cash flow +8.6/30.0
- ARV discount +7.5/15.0
- Livability +4.0/5.0
- Rent growth +3.2/5.0
- Schools +2.8/10.0
- Condition / age +2.5/5.0
- DSCR +2.4/10.0
- Appreciation +0.0/10.0
$122,709
🖨 Deal sheet 📄 Offer letter ✓ Due diligence
Listing remarks
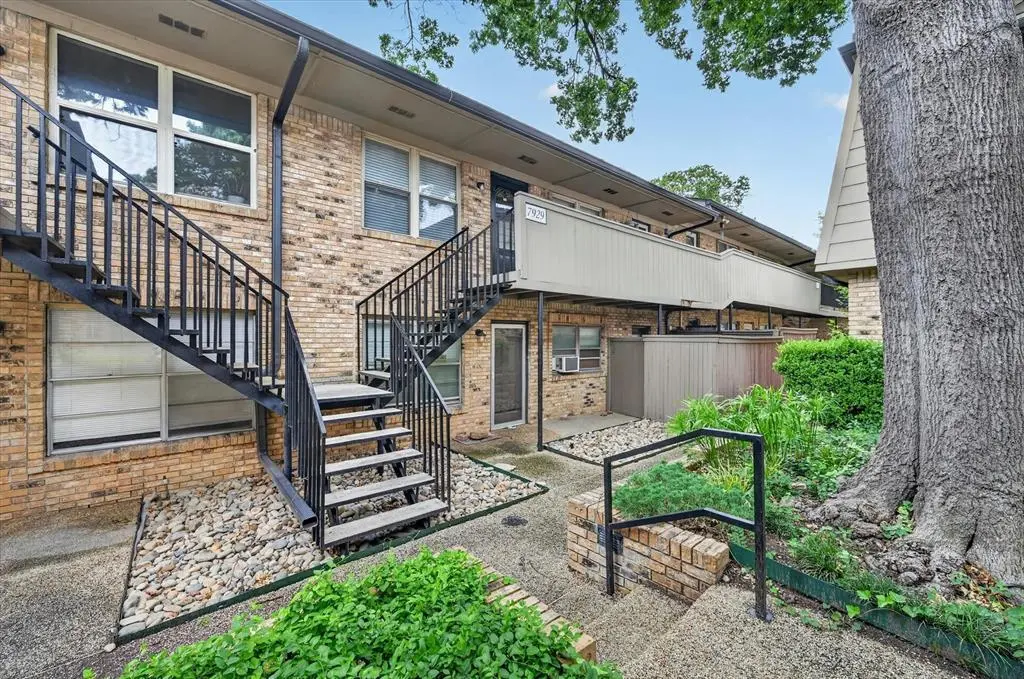
It's Time To Get Moving! Enjoy easy living in this centrally located two-bedroom, two-bath condominium featuring an open floor plan ideal for relaxing or entertaining. Fresh paint throughout, a new refrigerator and microwave, and several new interior doors make this home move-in ready from day one. Whether you're a first-time buyer, downsizing, or simply looking for a low-maintenance lifestyle, you'll appreciate the community swimming pool, two parking spaces (one assigned), and convenient access to shopping, dining, and major Dallas destinations. Priced right and ready for its next owner, this is an excellent opportunity to enjoy comfort, convenience, and value in a welcoming community.
Key facts
- Open floor plan
- New refrigerator
- New interior doors
Tags
Property features AI
Finance
- Other: Probate listing; Directions: From Central Expressway (I-75) go west on Royal Lane; complex is first on the right. Property is upstairs, east of the swimming pool and mailbox area.
- Financial info: Listing marketed for cash; Association fee charged monthly
- HOA & community: Mandatory association with monthly fee; Association fee covers full use of facilities, grounds maintenance, water and sewer; HOA management by Principal Mgmt Grp
Exterior
- Parking: Two carport spaces; One covered parking space; Additional parking available; Assigned and unassigned parking lot spaces
- Security: Security features unknown
- Utilities: City water; City sewer; Electricity available; Individual gas meter; Master water meter; Curbs; Asphalt and gravel/rock access
- Home design: Residential condominium; Attached unit; Two-story building; Unit located on second floor
- Construction: Brick construction; Composition roof; Slab foundation; Built in 1964
- Exterior features: Courtyard; Covered porch; Covered patio; Outdoor grill; Outdoor pool; Community pool; Lot approximately 2.335 acres
Interior
- Kitchen: Electric range; Microwave; Dishwasher; Disposal; Refrigerator; Kitchen (8 x 11)
- Bedrooms: Primary bedroom with ensuite bath (14 x 14); Second bedroom (11 x 14)
- Flooring: Luxury vinyl plank
- Bathrooms: Two full bathrooms; Primary bathroom (8 x 5)
- Heating & cooling: Central heating; Central air; Ceiling fan(s)
- Interior features: Built-in features; Six total rooms; One living area and one dining area; Upstairs unit (floor 2)
- Laundry & utility: Stacked washer/dryer area
Neighborhood map
What this means for you Summary
Snapshot
- This is a 2-bed/2.0-bath condo listed at $123k.
Deal economics
- At list price, monthly cash flow is $-106 ($-1k/yr) — negative.
- To cash-flow at today's rent, offer at most $104k (15.2% below list).
- Meets the 1% rule at list price ($2k rent vs $123k).
- Recommended offer: $104k (15.2% below list) — sets the bar for cash-flow.
- Cap rate 5.3% vs local median 2.3% in Dallas — top-decile yield for the area; either an underpriced asset or a hidden risk that comps aren't pricing in. Stress-test before assuming the spread holds.
Location & tenants
- Location reads 81/100 on livability (#24 in TX, #1,380 nationally) — a professional / high-income tenant draw. Strengths: amenities A+, commute A+, housing A+; Watch: crime F.
- Dallas ISD (urban): math 31% / reading 36% proficiency, ranked #559 of 826 in TX (top 68%) — families likely to look elsewhere, expect single-tenant / working-renter base with shorter leases; 83% free/reduced lunch — lower-income household profile, screen leases tightly.
- Zoned schools: Arthur Kramer El (math 37% / reading 47%, grade F, #1,335 of 4,322 statewide, top 33%, 454 students, 68% FRL).
- Market conditions: Rents rising (+2.6%/yr); 288 active listings in the ZIP; 40 comparable units currently listed for rent nearby; rentals at typical pace (median 14d on market — plan ~3-4 weeks tenant-placement turnaround); high-income renter base; 12,577 units permitted in Dallas County in 2024 (6,829 in 5+ unit buildings).
Forward outlook
- Local home prices are declining (-3.0%/yr); year-one equity from $849 of loan paydown is wiped out by about $4k of value loss. Plan a longer hold.
- Dallas County population projected at +35% by 2050 — long-run rental-demand tailwind backs the buy-and-hold thesis.
Negotiation context
- Only 2 days on market — expect competitive offers; lowballing is unlikely to land.
- Current owner paid $51k; list at $123k implies a 143% gain — meaningful room to come down on a strong offer.
Risks & watch-outs
- Watch-outs: property tax is 3.2% of price; HOA is 27% of rent.
- Climate carrying-cost: major wind risk, 27% chance of damaging wind over 30y; extreme-heat days projected 7→23/yr by 2055 (HVAC capex compounding) — expect insurance premiums to compound above CPI over the hold.
Questions for the listing agent
- What do current leases actually rent for vs. the listed asking? Can we see a recent rent roll and the last 12 months of T-12 income?
- Built in 1964 — when were the roof, HVAC, electrical panel, plumbing, and water heater last replaced?
- Property tax is high relative to price — has the assessment been appealed recently, and will the sale trigger a re-assessment?
- What does the HOA fee cover, when was the last increase, and are there any pending special assessments or reserve-fund shortfalls?
- Any open or pending special assessments — roof, HVAC, plumbing, elevator, façade? What's the per-unit balance and payoff schedule, and is the seller paying it off at close or rolling it to the buyer?
- Is there a deadline driving the sale (1031 exchange, divorce, estate, relocation)? That informs how much negotiation room exists.
- Crime grade is F in this area — have there been break-ins, vandalism, or insurance claims at this property in the last 3 years? What carrier currently insures it and at what premium?
- The area grade is low — what's the realistic commute time and amenity access for the typical tenant pool here? Any planned neighborhood developments (good or bad) we should know about?
- What's the average days-on-market for RENTAL listings here right now (not sales)? A rising rental-DOM trend means longer vacancies and softer asking-rent achievability than the comps imply.
- What's the recent tenant-quality profile in this submarket — average credit score on applications, eviction rate, late-payment / NSF rate, and stable-employment percentage? A property-management company in the area should have these aggregated.
- How much new apartment / multifamily construction is in the pipeline within 1–3 miles? Heavy new supply (>2% of stock underway) typically softens rents 12–24 months out; light construction supports rent growth.
Investment metrics
- 1% rule
- 1.45% ✓
- Cap rate
- 5.26%
- Cash-on-cash
- -3.69%
- DSCR
- 0.84
- GRM
- 5.7
CMA / ARV
No comps found within radius.
Projected returns pro-forma
-3.0% appreciation · 2.6% rent growth · sell at horizon
- IRR
- -22.8%
- Equity multiple
- 0.22×
- Total profit
- $-26,884
- Equity at exit
- $18,296
- IRR
- -18.0%
- Equity multiple
- 0.03×
- Total profit
- $-33,201
- Equity at exit
- $10,610
Cash invested: $34,359 (down + closing). Projections, not guarantees.
Landlord ↔ Tenant lean methodology
- Overall (STATE)
- 87 Strongly Landlord-Friendly
- State Texas
- 87 Strongly Landlord-Friendly · R+5
- County
- — inherits STATE
- City
- — inherits STATE
ZIP-level market 75230
- Rents YoY
- 2.6%
- Active inventory
- 288
- Price-to-rent
- 5.7×
Monthly cashflow live
- Estimated rent
- $1,784 high interval (Pro) →
- Mortgage (P&I)
- −$643
- Tax from tax record
- −$332 /mo · $3,988/yr
- Insurance
- −$51
- HOA
- −$488
- Vacancy / Maint / Mgmt
- −$375
- Net cashflow
- $-106
Break-even live
UW: 25.0% down · 7.5% · 30yr · 1.5% tax · 5.0% vac · 8.0% maint · 8.0% mgmt
Financing live
Cash to close
- Down payment
- $30,677
- Closing costs
- $3,681
- Reserves months
- —
- Total cash needed
- —
Loan-product check · same deal, 3 products live
Conventional
25% down · 7.5% · 30yr
- Down + closing
- —
- Monthly P&I
- —
- Monthly cashflow
- —
- DSCR
- —
- Eligible?
- —
Personal DTI + credit; lowest rate.
DSCR
20% down · 8.5% · 30yr
- Down + closing
- —
- Monthly P&I
- —
- Monthly cashflow
- —
- DSCR
- —
- Eligible?
- —
No personal income docs; deal must DSCR.
Hard money
10% down · 12.0% · 12mo
- Down + closing
- —
- Monthly P&I
- —
- Monthly cashflow
- —
- DSCR
- —
- Eligible?
- —
Short-term bridge; refi at stabilization.
Rent comps 40 comps
| Address | Beds | Baths | Sqft | Rent | $/sqft | DOM | Units | Dist |
|---|---|---|---|---|---|---|---|---|
| 7935 Royal Ln #217 Dallas, TX | 2.0 | 2.0 | 1100 | $1,750 | $1.59 | 3d | 1 | 0.01mi |
| 7931 Royal Ln #215 Dallas, TX | 2.0 | 2.0 | 1100 | $1,750 | $1.59 | 12d | 1 | 0.02mi |
| 7937 Royal Ln #223 Dallas, TX | 2.0 | 2.0 | 965 | $1,750 | $1.81 | 12d | 1 | 0.02mi |
| 7929 Royal Ln #121 Dallas, TX | 2.0 | 2.0 | 992 | $1,750 | $1.76 | 12d | 1 | 0.03mi |
| 7918 Royal Ln #212 Dallas, TX | 2.0 | 2.0 | 1110 | $1,800 | $1.62 | 14d | 1 | 0.04mi |
| 10951 Stone Canyon Rd Dallas, TX | 1.0–2.0 | 1.0–2.0 | 678 | $1,350 | $1.99 | 3d | 18 | 0.12mi |
| 11108 Valleydale Dr Unit B Dallas, TX | 2.0 | 2.0 | 1111 | $1,850 | $1.67 | 44d | 1 | 0.13mi |
| 11108 Valleydale Dr Dallas, TX | 2.0 | 2.0 | 1111 | $2,500 | $2.25 | 44d | 1 | 0.13mi |
| 10843 N Central Expy Dallas, TX | 2.0 | 1.0–2.0 | 694 | $1,615 | $2.33 | 2d | 53 | 0.26mi |
| 10830 Stone Canyon Rd Dallas, TX | 1.0–2.0 | 1.0–2.0 | 815 | $1,595 | $1.96 | 2d | 44 | 0.36mi |
| 10824 Stone Canyon Rd Dallas, TX | 2.0 | 2.0 | 935 | $1,580 | $1.69 | 44d | 1 | 0.38mi |
| 8169 Midtown Blvd Dallas, TX | 2.0 | 1.0–2.0 | 924 | $2,120 | $2.29 | 1d | 42 | 0.39mi |
| 10650 Steppington Dr Dallas, TX | 1.0–2.0 | 1.0–2.0 | 983 | $1,950 | $1.98 | 44d | 2 | 0.40mi |
| 10650 Steppington Dr Dallas, TX | 1.0–2.0 | 1.0–2.0 | 983 | $1,950 | $1.98 | 24d | 2 | 0.40mi |
| 10651 Steppington Dr Dallas, TX | 2.0 | 1.0–2.0 | 735 | $1,505 | $2.05 | 2d | 36 | 0.41mi |
| 10640 Steppington Dr Dallas, TX | 1.0–2.0 | 1.0–2.0 | 724 | $1,295 | $1.79 | 2d | 28 | 0.45mi |
| 10702 Stone Canyon Rd Dallas, TX | 1.0–2.0 | 1.0–2.0 | 933 | $1,590 | $1.70 | 3d | 10 | 0.47mi |
| 8196 Manderville Ln Dallas, TX | 1.0 | 1.0 | 598 | $1,515 | $2.53 | 13d | 1 | 0.51mi |
| 8196 Manderville Ln Dallas, TX | 1.0 | 1.0 | 598 | $1,515 | $2.53 | 44d | 1 | 0.51mi |
| 8196 Manderville Ln Dallas, TX | 2.0 | 2.0 | 1055 | $2,297 | $2.18 | 24d | 1 | 0.51mi |
| 10602 Stone Canyon Rd Dallas, TX | 1.0–2.0 | 1.0–2.0 | 724 | $1,520 | $2.10 | 2d | 20 | 0.52mi |
| 10501 Steppington Dr Dallas, TX | 1.0 | 1.0 | 626 | $1,158 | $1.85 | 19d | 15 | 0.55mi |
| 10658 N Central Expy Dallas, TX | 2.0 | 1.0–2.0 | 929 | $3,227 | $3.47 | 17d | 90 | 0.57mi |
| 10658 N Central Expy Dallas, TX | 2.0 | 1.0–2.0 | 929 | $3,053 | $3.29 | 1d | 82 | 0.57mi |
| 8122 Midtown Blvd Unit 1335743P Dallas, TX | 1.0 | 1.0 | 753 | $2,996 | $3.98 | 3d | 1 | 0.58mi |
| 10590 Stone Canyon Rd Dallas, TX | 2.0 | 2.0 | 1111 | $1,560 | $1.40 | 24d | 1 | 0.58mi |
| 10590 Stone Canyon Rd Dallas, TX | 1.0 | 1.0 | 558 | $1,050 | $1.88 | 22d | 1 | 0.58mi |
| 10590 Stone Canyon Rd Dallas, TX | 1.0 | 1.0 | 558 | $1,050 | $1.88 | 44d | 1 | 0.58mi |
| 10588 Stone Canyon Rd Dallas, TX | 2.0 | 1.0–2.0 | 783 | $1,614 | $2.06 | 2d | 45 | 0.58mi |
| 7879 Riverfall Dr Dallas, TX | 1.0–2.0 | 1.0–2.0 | 678 | $1,444 | $2.13 | 5d | 32 | 0.59mi |
| 10507 Steppington Dr Dallas, TX | 1.0 | 1.0 | 558 | $1,075 | $1.93 | 44d | 1 | 0.60mi |
| 7885 Riverfall Dr Dallas, TX | 1.0 | 1.0 | 550 | $805 | $1.46 | 20d | 1 | 0.61mi |
| 10550 N Central Expy Dallas, TX | 2.0 | 1.0–2.0 | 885 | $2,150 | $2.43 | 2d | 12 | 0.63mi |
| 10570 Stone Canyon Rd Unit 354 Dallas, TX | 1.0 | 1.0 | 820 | $1,122 | $1.37 | 44d | 1 | 0.64mi |
| 10570 Stone Canyon Rd Dallas, TX | 1.0–2.0 | 1.0–2.0 | 646 | $1,464 | $2.27 | 2d | 24 | 0.64mi |
| 10594 High Hollows Dr #290 Dallas, TX | 2.0 | 1.0 | 851 | $1,495 | $1.76 | 24d | 1 | 0.64mi |
| 8107 Manderville Ln Dallas, TX | 2.0 | 1.0–2.5 | 889 | $2,341 | $2.63 | 2d | 22 | 0.66mi |
| 7933 Forest Ln Dallas, TX | 1.0 | 1.0 | 610 | $1,345 | $2.20 | 24d | 1 | 0.72mi |
| 8031 Forest Ln Dallas, TX | 1.0 | 1.0 | 739 | $1,463 | $1.98 | 24d | 1 | 0.74mi |
| 8031 Forest Ln Dallas, TX | 2.0 | 2.0 | 1103 | $1,765 | $1.60 | 20d | 1 | 0.74mi |
HOA detail condo
- Monthly dues
- $488 · $5,856/yr
- Likely covers
- pool
- Assessments
- None detected in remarks — confirm with the listing agent.
Listing history 3 events
-
2026-06-13statusdays on market $122,709 Pending 2 DOM
-
2026-06-10remarks 697-char remark
-
2026-06-10$122,709 Active 1 DOM
ⓘ Source: listings_history table (triggers on properties + properties_extension) + one-shot
backfill from property_details.listing_events for pre-trigger history.
Tax reassessment forecast TX · Resets to sale price
- Current annual tax
- $3,988 · $332/mo
- Projected year-2 tax
- $3,988 · $332/mo
- Expected delta
- $0/yr ($0/mo · 0.0%)
ⓘ Screening estimate from a state-policy table — verify with the county assessor before closing.
Climate risk First Street
- Flood 1/10 Low FEMA zone X (unshaded) · 0% chance over 30 yrs
- Wildfire 1/10 Low
- Heat 7/10 Severe 7 d/yr ≥109°F today · 23 d/yr by 30 yrs out
- Wind 6/10 Major 27% chance of damaging wind over 30 yrs
- Air quality 3/10 Moderate 3 unhealthy d/yr today · 3 by 30 yrs out
Nearby sold comps map
Loading sold comps map…
Walkable amenities ~0.75 mi
Loading nearby amenities…
Taxation est. · year 1
- Rental income
- $21,409
- − Mortgage interest
- −$6,874
- − Property taxes
- −$3,988
- − Insurance
- −$614
- − Repairs & maintenance
- −$1,713
- − Management
- −$1,713
- − HOA
- −$5,856
- − Depreciation
- −$3,570
- Taxable loss
- −$2,917
- Est. tax savings @ 24.0%
- +$700
- After-tax cash flow
- $-566/yr
For passive investors: Depreciation is non-cash, so a rental often shows a tax loss while cash-flowing — sheltering income. Rental losses are passive: they offset passive income freely, and up to $25,000/yr can offset ordinary (W-2) income if you actively participate and your MAGI is under $100k (phasing out to $0 by $150k); unused losses carry forward. On sale, claimed depreciation is recaptured at up to 25%, and gains may owe capital-gains tax (a 1031 exchange can defer both). Figures are a year-1 estimate at your 24.0% rate — not tax advice; consult a CPA.
Schools (NCES district)
- District
- Dallas ISD
- NCES district ID
- 4816230
- Math proficiency
- 31% ▼ -16.00%
- Reading proficiency
- 36% ▼ -4.00%
- Median HH income
- $42,881
- Composite
- 28.41/100
- National rank
- #6763
- State rank
- #559 of 826 in TX
Livability — Dallas
- Score
- 81/100
- State rank
- #24
- US rank
- #1380
Category grades
Schools grade is shown separately in the Schools card above.
Census & demographics
- Census place
- Dallas, TX
- County
- Dallas County · 2,612,404 people
- City population
- 1,168,437
- Metro
- Dallas-Fort Worth-Arlington, TX
- Population (ZIP)
- 27,763
- Household income
- $110,956
- Rent vs Own
- Severe rent burden
- 1333.0
Population outlook (Dallas County) Hauer SSP2
- Today (2025)
- 2,979,839 people
- By 2030
- 3,191,823 · +7.1%
- By 2040
- 3,619,611 · +21.5%
- By 2050
- 4,026,915 · +35.1%
- By 2075
- 4,957,073 · +66.4%
- By 2100
- 5,508,725 · +84.9%
Race, ethnicity, and origin ACS 2023
- Neighborhood character
- Predominantly White (72%)
- Race & ethnicity
- White 72% Hispanic / Latino 12% Black 9% Two or more races 8% Asian 4%
- Hispanic origin (detail)
- Mexican 9%
- Common ancestry
- Lithuanian 3% Italian 2% Serbian 2%
- Foreign-born
- 13% · Canada, Vietnam, China
- Languages at home
- 83% English-only · Spanish 8% Other Indo-European 3% French/Haitian/Cajun 1%
Political lean MEDSL · Dallas
- 2024 margin
- Strong D (+22.2) · D 60.2% · R 38.0% · Other 1.8%
- 2008→2024 swing
- +6.9pp toward D · 2008: 15.3pp · 2024: 22.2pp
- All cycles
- 2024: D+22.2 2020: D+31.6 2016: D+26.2 2012: D+15.4 2008: D+15.3
Not yet ingested
- Civics
- —
Market trends
- HPI YoY
- ▼ -595.21%
- Current HPI
- 329.7118
- Rent YoY
- ▲ 2.60%
- Metro
- Dallas-Fort Worth-Arlington, TX
- State GDP YoY
- ▲ 3.95%
- F500 in state
- 110
Industry mix (Fortune 500 HQ in TX)
| Industry | F500 HQs | Revenue |
|---|---|---|
| Energy | 16 | $1,198B |
|
||
| Technology | 5 | $198B |
|
||
| Engineering / Construction | 4 | $72B |
|
||
| Energy Services | 3 | $60B |
|
||
| Utilities | 3 | $41B |
|
||
| Healthcare | 2 | $330B |
|
||
Price history
+142.8% since first listed4 events — show timeline
- 2026-06-09 Listed $122,709 NTREIS
- 2026-05-21 Sold (Public Records) — Public Records
- 1993-08-31 Sold (Public Records) $50,540 Public Records
- 1993-08-26 Sold (Public Records) — Public Records
Property tax history
+5.4%/yrLatest (2025): $3,988 · +15.7% YoY. Source: county tax records.
Cash-flow waterfall
monthlySold comps — $/sqft
last 12 mo · ≤1 miLoading sold comps…