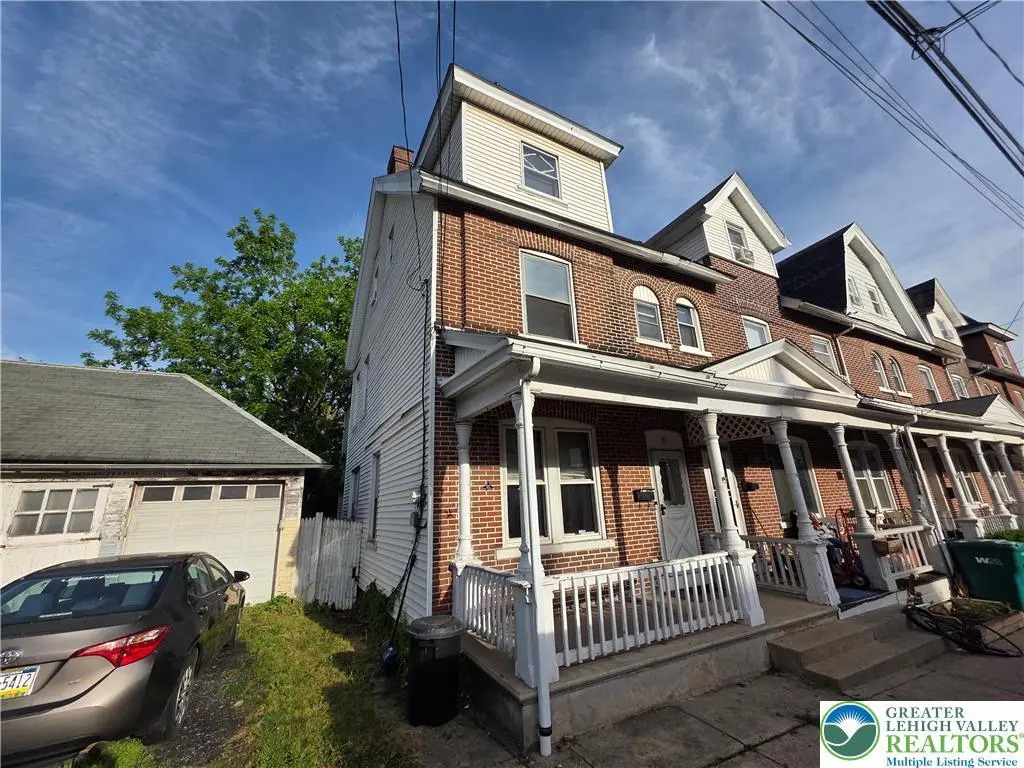
911 High St · Bethlehem, PA
Flood risk 1/10 · Minimal
- FEMA flood zone
- X (unshaded)
- Chance of flooding over 30 yrs
- 0.0%
- Est. flood insurance / yr
- $473 – $860
Fire risk 2/10 · Minimal
- Est. fire insurance / yr
- $511 – $949
Heat risk 5/10 · Moderate
- Hot days now (above 99°F)
- 7 days/yr
- Hot days in 30 yrs
- 15 days/yr
Wind risk 4/10 · Minor
- Chance of severe wind over 30 yrs
- 19.0%
Air-quality risk 4/10 · Minor
- Unhealthy air days now
- 3 days/yr
- Unhealthy air days in 30 yrs
- 6 days/yr
Risk factors via First Street. Map © Google.
Why this score? — see what drove the C+ grade
The composite is a weighted blend of 9 inputs, each scored 0–100. Each bar is that input's sub-score; the figure is the points it added to the 100-point composite (weight × sub-score).
- Cash flow +21.1/30.0
- ARV discount +15.0/15.0
- DSCR +6.7/10.0
- 1% rule +5.8/10.0
- Livability +4.1/5.0
- Schools +3.5/10.0
- Rent growth +2.7/5.0
- Condition / age +2.5/5.0
- Appreciation +0.0/10.0
$199,900
🖨 Deal sheet (PDF) 📄 Offer letter ✓ Due diligence
Listing remarks
SPACIOUS & FULL OF POTENTIAL best describe this 3-story end-unit row home conveniently located within walking distance to Historic Bethlehem’s shops, restaurants, and attractions! Offering 5 bedrooms and 2 full baths, this home provides an incredible amount of living space at an affordable price point. The flexible layout features generously sized rooms throughout, making it ideal for a variety of living situations. Enjoy relaxing on the covered front porch or entertaining in the large stamped concrete rear patio area. Major exterior improvement already completed with a newer roof installed in 2020. While the property could benefit from cosmetic updates and some TLC, it has been
Key facts
- Covered front porch
- Close to parks
- Close to schools
Tags
Property features AI
Finance
- Other: Zoned 04RM
Exterior
- Parking: On-street parking
- Utilities: Public water; Public sewer; 100 amp electric service with circuit breakers; Gas water heater
- Home design: 3-story property; Brick and vinyl siding exterior; Asphalt/fiberglass roof
- Construction: Brick and vinyl siding construction; Asphalt/fiberglass roof
- Exterior features: Porch; Patio
Interior
- Kitchen: Dishwasher; Electric oven; Electric range; Microwave; Refrigerator
- Bedrooms: Bedroom on third floor (15 x 13); Bedroom on third floor (13 x 10); Bedroom on first floor (15 x 12); Bedroom on second floor (14 x 9); Bedroom on second floor (14 x 13)
- Bathrooms: Two full bathrooms (one on first floor, one on second floor) — each about 8 x 6
- Heating & cooling: Gas hot water heating; Wall/window cooling units
- Interior features: Dining area; Eat-in kitchen; Full walk-out basement
- Laundry & utility: Washer hookup; Dryer hookup (electric); Washer and electric dryer included; Laundry located on lower level
Neighborhood map
What this means for you Summary
Snapshot
- This is a 2-bed/1.0-bath townhouse listed at $200k.
Deal economics
- At list price, monthly cash flow is $284 ($3k/yr) — positive.
- The deal already cash-flows at list — no discount required.
- Meets the 1% rule at list price ($2k rent vs $200k).
- Cap rate 8.0% vs local median 4.3% in Bethlehem — top-decile yield for the area; either an underpriced asset or a hidden risk that comps aren't pricing in. Stress-test before assuming the spread holds.
Location & tenants
- Location reads 82/100 on livability (#138 in PA, #1,122 nationally) — a professional / high-income tenant draw. Strengths: amenities A+, cost of living A+, housing A+; Watch: commute F.
- Bethlehem Area SD (urban): math 31% / reading 49% proficiency, ranked #342 of 539 in PA (top 64%) — families likely to look elsewhere, expect single-tenant / working-renter base with shorter leases.
- Zoned schools: William Penn El Sch (math 34% / reading 54%, grade F, #815 of 1,518 statewide, top 56%, 239 students, 72% FRL); Northeast Ms (math 12% / reading 47%, grade F, #385 of 512 statewide, top 76%, 725 students, 75% FRL); Liberty Hs (math 36% / reading 10%, grade F, #382 of 437 statewide, top 87%, 2,640 students, 50% FRL) — zoned schools average 66% FRL vs 43% district-wide (23 pts higher); higher-poverty schools than district average — tighter screening recommended.
- Market conditions: Rents flat; 105 active listings in the ZIP; 40 comparable units currently listed for rent nearby; rentals at typical pace (median 25d on market — plan ~3-4 weeks tenant-placement turnaround); solid renter incomes; 567 units permitted in Northampton County in 2024 (151 in 5+ unit buildings).
- This rent runs 34% of the median local income ($75k/yr) — at the standard rent-burdened threshold; future hikes will face affordability resistance.
Forward outlook
- Local home prices are declining (-3.0%/yr); year-one equity from $1k of loan paydown is wiped out by about $6k of value loss. Plan a longer hold.
Negotiation context
- Only 6 days on market — expect competitive offers; lowballing is unlikely to land.
- Current owner paid $45k; list at $200k implies a 344% gain — meaningful room to come down on a strong offer.
Risks & watch-outs
- Watch-outs: built in 1900 — expect roof / HVAC / electrical / plumbing capex.
- Climate carrying-cost: extreme-heat days projected 7→15/yr by 2055 (HVAC capex compounding) — expect insurance premiums to compound above CPI over the hold.
Questions for the listing agent
- Built in 1900 — when were the roof, HVAC, electrical panel, plumbing, and water heater last replaced?
- Is there a deadline driving the sale (1031 exchange, divorce, estate, relocation)? That informs how much negotiation room exists.
- Schools are B-rated — typically a magnet for longer-tenancy family renters. What's the average tenant stay here, and is there a school-zone premium baked into asking?
- What's the average days-on-market for RENTAL listings here right now (not sales)? A rising rental-DOM trend means longer vacancies and softer asking-rent achievability than the comps imply.
- What's the recent tenant-quality profile in this submarket — average credit score on applications, eviction rate, late-payment / NSF rate, and stable-employment percentage? A property-management company in the area should have these aggregated.
- How much new for-sale + rental construction is in the pipeline within 1–3 miles? Heavy new supply typically softens prices + rents 12–24 months out; constrained supply supports both.
Investment metrics
- 1% rule
- 1.08% ✓
- Cap rate
- 8.00%
- Cash-on-cash
- 6.09%
- DSCR
- 1.27
- GRM
- 7.7
CMA / ARV
- ARV (on-the-fly)
- $305,976
- Comps found
- 12
Show comp detail 12 sales within ~0.75 mi
| Address | Dist | Beds/Ba | Sqft | Sold | Price | $/sf | Match |
|---|---|---|---|---|---|---|---|
| 129 E Goepp St | 0.03mi | 3/2.0 (+1) | 1,648 (-1%) | 4mo | $285,000 | $173 | 84 |
| 233 E Goepp | 0.09mi | 3/1.5 (+1) | 1,766 (+6%) | 1mo | $160,000 | $91 | 79 |
| 422 E Goepp St | 0.29mi | 3/1.5 (+1) | 1,763 (+5%) | 0mo | $320,000 | $182 | 70 |
| 315 E North St | 0.27mi | 3/1.0 (+1) | 1,536 (-8%) | 2mo | $205,000 | $133 | 67 |
| 1350 Montrose Ave | 0.38mi | 3/1.5 (+1) | 1,787 (+7%) | 0mo | $325,000 | $182 | 64 |
| 45 W Greenwich St | 0.50mi | 3/1.5 (+1) | 1,616 (-3%) | 3mo | $308,000 | $191 | 62 |
| 520 Maple St | 0.44mi | 3/2.0 (+1) | 1,544 (-8%) | 1mo | $262,000 | $170 | 57 |
| 529 E Laurel St | 0.44mi | 3/1.5 (+1) | 1,440 (-14%) | 0mo | $275,000 | $191 | 49 |
| 726 Pembroke Rd | 0.58mi | 3/1.0 (+1) | 1,478 (-12%) | 1mo | $270,000 | $183 | 48 |
| 42 E Wall St | 0.52mi | 3/1.5 (+1) | 1,474 (-12%) | 2mo | $376,600 | $255 | 48 |
| 1005 Wood St | 0.45mi | 2/3.0 | 1,440 (-14%) | 2mo | $300,000 | $208 | 46 |
| 1507 High St | 0.49mi | 3/2.5 (+1) | 1,440 (-14%) | 4mo | $325,000 | $226 | 40 |
Match score weights: distance 35% · size 25% · config 20% · recency 20%. Top-matched comps best support the ARV.
Projected returns pro-forma
-3.0% appreciation · 0.85% rent growth · sell at horizon
- IRR
- -9.4%
- Equity multiple
- 0.66×
- Total profit
- $-18,805
- Equity at exit
- $29,806
- IRR
- -3.2%
- Equity multiple
- 0.81×
- Total profit
- $-10,779
- Equity at exit
- $17,284
Cash invested: $55,972 (down + closing). Projections, not guarantees.
Landlord ↔ Tenant lean methodology
- Overall (STATE)
- 62 Landlord-Friendly
- State Pennsylvania
- 62 Landlord-Friendly · EVEN
- County
- — inherits STATE
- City
- — inherits STATE
ZIP-level market 18018
- Rents YoY
- 0.8%
- Active inventory
- 105
- Price-to-rent
- 7.7×
Monthly cashflow live
- Estimated rent
- $2,153 high interval (Pro) →
- Mortgage (P&I)
- −$1,048
- Tax from tax record
- −$286 /mo · $3,426/yr
- Insurance
- −$83
- HOA
- −$0
- Vacancy / Maint / Mgmt
- −$452
- Net cashflow
- $284
Break-even live
Sensitivity live
| Price | -10% $397 | -5% $341 | +0% $284 | +5% $228 | +10% $171 |
|---|---|---|---|---|---|
| Rent | -10% $114 | -5% $199 | +0% $284 | +5% $369 | +10% $454 |
| Rate | -1.0pp $385 | -0.5pp $335 | base $284 | +0.5pp $232 | +1.0pp $180 |
UW: 25.0% down · 7.5% · 30yr · 1.5% tax · 5.0% vac · 8.0% maint · 8.0% mgmt
Financing live
Cash to close
- Down payment
- $49,975
- Closing costs
- $5,997
- Reserves months
- —
- Total cash needed
- —
Loan-product check · same deal, 3 products live
Conventional
25% down · 7.5% · 30yr
- Down + closing
- —
- Monthly P&I
- —
- Monthly cashflow
- —
- DSCR
- —
- Eligible?
- —
Personal DTI + credit; lowest rate.
DSCR
20% down · 8.5% · 30yr
- Down + closing
- —
- Monthly P&I
- —
- Monthly cashflow
- —
- DSCR
- —
- Eligible?
- —
No personal income docs; deal must DSCR.
Hard money
10% down · 12.0% · 12mo
- Down + closing
- —
- Monthly P&I
- —
- Monthly cashflow
- —
- DSCR
- —
- Eligible?
- —
Short-term bridge; refi at stabilization.
Rent comps 40 comps
| Address | Beds | Baths | Sqft | Rent | $/sqft | DOM | Units | Dist |
|---|---|---|---|---|---|---|---|---|
| 129 E Goepp St Bethlehem, PA | 3.0 | 2.0 | 1648 | $2,600 | $1.58 | 4d | 1 | 0.07mi |
| 122 E Goepp St Unit 1 Bethlehem, PA | 3.0 | 1.0 | 1137 | $1,895 | $1.67 | 4d | 1 | 0.10mi |
| 69 E Goepp St Bethlehem, PA | 3.0 | 1.0 | 1100 | $2,150 | $1.95 | 4d | 1 | 0.14mi |
| 326 E Frankford St Bethlehem, PA | 2.0 | 2.0 | 1250 | $2,300 | $1.84 | 25d | 1 | 0.20mi |
| 326 E Frankford St Bethlehem, PA | 2.0 | 2.0 | 1250 | $2,300 | $1.84 | 45d | 1 | 0.20mi |
| 1214 Maple St Bethlehem, PA | 3.0 | 1.0 | 1462 | $2,000 | $1.37 | 45d | 1 | 0.32mi |
| 55 E Elizabeth Ave Unit 1 Bethlehem, PA | 2.0 | 2.0 | 1184 | $2,250 | $1.90 | 46d | 1 | 0.32mi |
| 1136 N New St Bethlehem, PA | 3.0 | 1.0 | 1296 | $2,300 | $1.77 | 4d | 1 | 0.33mi |
| 822 Elm St Bethlehem, PA | 3.0 | 1.5 | 1406 | $2,195 | $1.56 | 16d | 1 | 0.36mi |
| 1320 Chelsea Ave Bethlehem, PA | 3.0 | 2.0 | 1373 | $2,395 | $1.74 | 4d | 1 | 0.37mi |
| 1320 Chelsea Ave Bethlehem, PA | 3.0 | 2.0 | 1373 | $2,349 | $1.71 | 16d | 1 | 0.37mi |
| 47 W Goepp St Bethlehem, PA | 3.0 | 1.5 | 1184 | $1,995 | $1.68 | 4d | 1 | 0.38mi |
| 537 Goepp Cir Unit B Bethlehem, PA | 3.0 | 1.5 | 1225 | $1,895 | $1.55 | 45d | 1 | 0.38mi |
| 56 W North St Bethlehem, PA | 2.0 | 2.0 | 1486 | $2,400 | $1.62 | 16d | 1 | 0.45mi |
| 30 E Market St Apt 1 Bethlehem, PA | 2.0 | 1.0 | 1200 | $1,950 | $1.62 | 45d | 1 | 0.51mi |
| 417 Linden St Bethlehem, PA | 3.0 | 1.5 | 1699 | $2,450 | $1.44 | 4d | 1 | 0.55mi |
| 239 E Church St Bethlehem, PA | 3.0 | 2.5 | 1724 | $2,950 | $1.71 | 25d | 1 | 0.56mi |
| 1532 N New St Unit B Bethlehem, PA | 2.0 | 1.5 | 1100 | $1,845 | $1.68 | 4d | 1 | 0.57mi |
| 34 E Washington Ave Bethlehem, PA | 2.0 | 1.0 | 1100 | $2,000 | $1.82 | 25d | 1 | 0.58mi |
| 650 E North St Bethlehem, PA | 2.0 | 1.0–2.0 | 935 | $2,350 | $2.51 | 16d | 7 | 0.62mi |
| 754 E Washington Ave Bethlehem, PA | 3.0 | 2.0 | 1200 | $1,900 | $1.58 | 45d | 1 | 0.71mi |
| 1138 Arcadia St Bethlehem, PA | 3.0 | 1.0 | 1802 | $2,095 | $1.16 | 45d | 1 | 0.74mi |
| 328 Carver Dr Unit A Bethlehem, PA | 2.0 | 2.0 | 1466 | $2,050 | $1.40 | 45d | 1 | 0.80mi |
| 830 Media St Bethlehem, PA | 3.0 | 1.0 | 1128 | $2,100 | $1.86 | 45d | 1 | 0.82mi |
| 830 Media St Bethlehem, PA | 3.0 | 1.0 | 1128 | $2,100 | $1.86 | 25d | 1 | 0.82mi |
| 520 W Union Blvd Unit 2 Bethlehem, PA | 3.0 | 1.0 | 2225 | $2,150 | $0.97 | 25d | 1 | 0.92mi |
| 11 W 2nd St Bethlehem, PA | 2.0 | 2.0 | 1620 | $2,550 | $1.57 | 25d | 4 | 0.98mi |
| 517 Schaffer St Bethlehem, PA | 2.0 | 1.0 | 1200 | $1,900 | $1.58 | 4d | 1 | 0.98mi |
| 311 E 3rd St Bethlehem, PA | 2.0 | 2.0 | 1189 | $2,330 | $1.96 | 4d | 3 | 1.02mi |
| 610 E 3rd St Bethlehem, PA | 1.0–2.0 | 1.0–2.0 | 974 | $3,008 | $3.09 | 4d | 8 | 1.05mi |
| 1240 Pembroke Rd #1 Bethlehem, PA | 3.0 | 1.0 | 1249 | $1,795 | $1.44 | 45d | 1 | 1.20mi |
| 1240 Pembroke Rd #2 Bethlehem, PA | 2.0 | 1.0 | 1300 | $1,495 | $1.15 | 45d | 1 | 1.20mi |
| 1201 E 4th St Unit 4 Bethlehem, PA | 3.0 | 1.5 | 1100 | $1,800 | $1.64 | 45d | 1 | 1.29mi |
| 1275 E 4th St Unit 202 Bethlehem, PA | 2.0 | 2.0 | 1225 | $1,950 | $1.59 | 25d | 1 | 1.38mi |
| 1210 Eaton Ave #201 Bethlehem, PA | 2.0 | 2.0 | 1350 | $2,350 | $1.74 | 45d | 1 | 1.42mi |
| 2234 Easton Ave Bethlehem, PA | 3.0 | 1.5 | 1254 | $2,395 | $1.91 | 4d | 1 | 1.44mi |
| 521 Hess St Bethlehem, PA | 3.0 | 1.0 | 1120 | $1,500 | $1.34 | 23d | 1 | 1.45mi |
| 517 Seneca St Unit 1 Bethlehem, PA | 2.0 | 1.5 | 1500 | $2,200 | $1.47 | 45d | 1 | 1.47mi |
| 1345 Martin Ct Bethlehem, PA | 1.0–2.0 | 1.0–2.0 | 1184 | $2,370 | $2.00 | 4d | 8 | 1.48mi |
| 1236 E 7th St Bethlehem, PA | 3.0 | 2.5 | 1424 | $2,350 | $1.65 | 4d | 1 | 1.50mi |
Listing history 3 events
-
2026-05-22$199,900 Active
-
1996-11-15soldstatus $45,000
-
1996-11-01soldstatus $45,000
ⓘ Source: listings_history table (triggers on properties + properties_extension) + one-shot
backfill from property_details.listing_events for pre-trigger history.
Tax reassessment forecast PA · Partial reset (capped growth)
- Current annual tax
- $3,426 · $286/mo
- Projected year-2 tax
- $3,426 · $286/mo
- Expected delta
- $0/yr ($0/mo · 0.0%)
ⓘ Screening estimate from a state-policy table — verify with the county assessor before closing.
Climate risk First Street
- Flood 1/10 Low FEMA zone X (unshaded) · 0% chance over 30 yrs
- Wildfire 2/10 Low
- Heat 5/10 Major 7 d/yr ≥99°F today · 15 d/yr by 30 yrs out
- Wind 4/10 Moderate 19% chance of damaging wind over 30 yrs
- Air quality 4/10 Moderate 3 unhealthy d/yr today · 6 by 30 yrs out
Nearby sold comps map
Loading sold comps map…
Walkable amenities ~0.75 mi
Loading nearby amenities…
Taxation est. · year 1
- Rental income
- $25,841
- − Mortgage interest
- −$11,198
- − Property taxes
- −$3,426
- − Insurance
- −$1,000
- − Repairs & maintenance
- −$2,067
- − Management
- −$2,067
- − Depreciation
- −$5,815
- Taxable income
- $268
- Est. tax owed @ 24.0%
- −$64
- After-tax cash flow
- $3,345/yr
For passive investors: Depreciation is non-cash, so a rental often shows a tax loss while cash-flowing — sheltering income. Rental losses are passive: they offset passive income freely, and up to $25,000/yr can offset ordinary (W-2) income if you actively participate and your MAGI is under $100k (phasing out to $0 by $150k); unused losses carry forward. On sale, claimed depreciation is recaptured at up to 25%, and gains may owe capital-gains tax (a 1031 exchange can defer both). Figures are a year-1 estimate at your 24.0% rate — not tax advice; consult a CPA.
Schools (NCES district)
- District
- Bethlehem Area SD
- NCES district ID
- 4203570
- Math proficiency
- 31% ▼ -2.00%
- Reading proficiency
- 49% ▼ -6.00%
- Median HH income
- $55,124
- Composite
- 34.92/100
- National rank
- #5068
- State rank
- #342 of 539 in PA
Livability — Bethlehem
- Score
- 82/100
- State rank
- #138
- US rank
- #1122
Category grades
Schools grade is shown separately in the Schools card above.
Census & demographics
- Census place
- Bethlehem, PA
- County
- Lehigh County · 333,019 people
- City population
- 129,661
- Metro
- Allentown-Bethlehem-Easton, PA-NJ
- Population (ZIP)
- 32,965
- Household income
- $75,417
- Rent vs Own
- Severe rent burden
- 1361.0
Population outlook (Northampton County) Hauer SSP2
- Today (2025)
- 312,227 people
- By 2030
- 314,769 · +0.8%
- By 2040
- 316,914 · +1.5%
- By 2050
- 318,037 · +1.9%
- By 2075
- 334,003 · +7.0%
- By 2100
- 344,696 · +10.4%
Race, ethnicity, and origin ACS 2023
- Neighborhood character
- Majority White (65%)
- Race & ethnicity
- White 65% Hispanic / Latino 24% Two or more races 10% Black 6% Asian 2%
- Hispanic origin (detail)
- Mexican 2% Puerto Rican 14% Dominican 3%
- Common ancestry
- Romanian 4% Italian 2% Polish 2%
- Foreign-born
- 9% · Canada, Jamaica, China
- Languages at home
- 81% English-only · Spanish 15% Other Indo-European 2%
Political lean MEDSL · Northampton
- 2024 margin
- Toss-up / Even · D 48.6% · R 50.4%
- 2008→2024 swing
- -14.1pp toward R · 2008: 12.3pp · 2024: -1.8pp
- All cycles
- 2024: R+1.8 2020: D+0.7 2016: R+3.8 2012: D+4.6 2008: D+12.3
Not yet ingested
- Civics
- —
Market trends
- HPI YoY
- ▼ -211.46%
- Current HPI
- 301.1699
- Rent YoY
- ▲ 0.85%
- Metro
- Allentown-Bethlehem-Easton, PA-NJ
- State GDP YoY
- ▲ 1.68%
- F500 in state
- 34
Industry mix (Fortune 500 HQ in PA)
| Industry | F500 HQs | Revenue |
|---|---|---|
| Healthcare | 2 | $309B |
|
||
| Insurance | 2 | $27B |
|
||
| Telecommunications / Media | 1 | $124B |
|
||
| Industrial Distribution | 1 | $22B |
|
||
| Financial Services | 1 | $20B |
|
||
| Chemicals / Materials | 1 | $18B |
|
||
Price history
+344.2% since first listed3 events — show timeline
- 2026-05-22 Listed $199,900 GLVRMLS
- 1996-11-15 Sold (Public Records) $45,000 Public Records
- 1996-11-01 Sold (Public Records) $45,000 Public Records
Property tax history
+1.5%/yrLatest (2026): $3,426 · +3.5% YoY. Source: county tax records.
Cash-flow waterfall
monthlySold comps — $/sqft
last 12 mo · ≤1 miLoading sold comps…