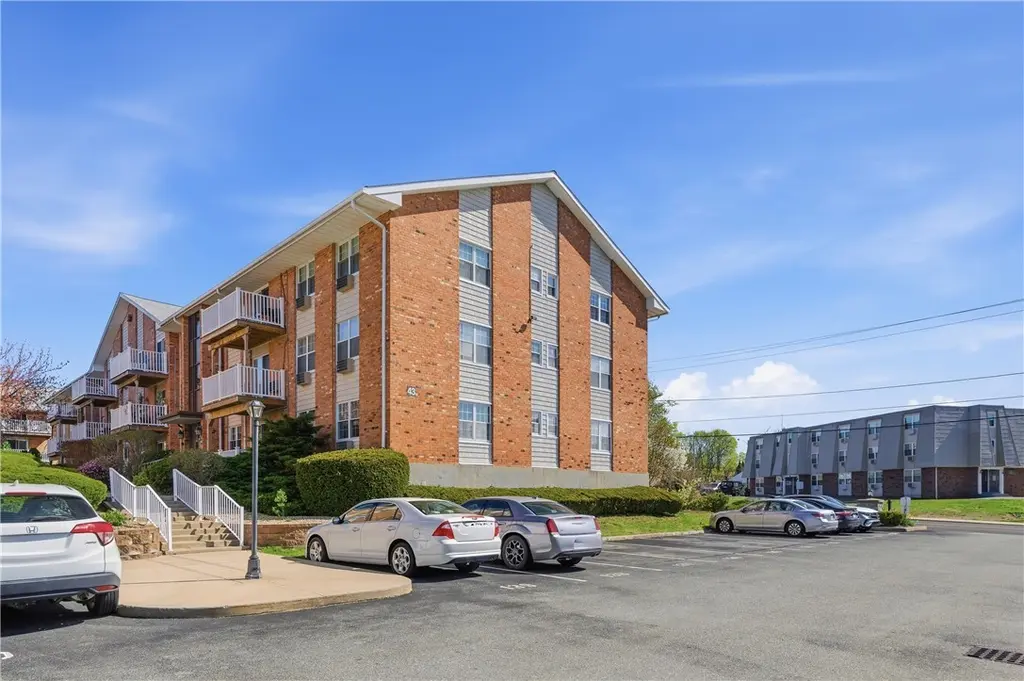
43 Bullocks Point Ave Unit 8B · East Providence, RI
Flood risk 1/10 · Minimal
- FEMA flood zone
- X (unshaded)
- Chance of flooding over 30 yrs
- 0.0%
- Est. flood insurance / yr
- $507 – $1,088
Fire risk 1/10 · Minimal
- Est. fire insurance / yr
- $835 – $1,551
Heat risk 5/10 · Moderate
- Hot days now (above 98°F)
- 7 days/yr
- Hot days in 30 yrs
- 15 days/yr
Wind risk 8/10 · Major
- Chance of severe wind over 30 yrs
- 80.0%
Air-quality risk 2/10 · Minimal
- Unhealthy air days now
- 1 days/yr
- Unhealthy air days in 30 yrs
- 2 days/yr
Risk factors via First Street. Map © Google.
Why this score? — see what drove the C- grade
The composite is a weighted blend of 9 inputs, each scored 0–100. Each bar is that input's sub-score; the figure is the points it added to the 100-point composite (weight × sub-score).
- Cash flow +15.0/30.0
- ARV discount +15.0/15.0
- 1% rule +5.5/10.0
- DSCR +4.6/10.0
- Livability +3.7/5.0
- Rent growth +2.6/5.0
- Condition / age +2.5/5.0
- Schools +2.2/10.0
- Appreciation +0.0/10.0
$240,000
🖨 Deal sheet 📄 Offer letter ✓ Due diligence
Listing remarks
Welcome to this cozy, well-kept apartment in a truly unbeatable location. Enjoy the convenience of nearby shops, dining, and outdoor recreation, all while coming home to a peaceful space that feels like your own retreat. The property features an inviting in-ground pool perfect for summer days, and direct access to a scenic bike path that winds along the water ideal for morning rides or evening strolls. A great blend of comfort, charm, and lifestyle. Live where convenience meets relaxation. From the great location to the cozy feel and outdoor perks, this home checks all the boxes. Don't wait make this place yours. Sold "as is"
Key facts
- Scenic bike path
- In-ground pool
- $290 HOA
Tags
Property features AI
Finance
- Other: Pets allowed (cats)
- HOA & community: Monthly association fee of $290; Association covers laundry, grounds maintenance, parking, pool, recreation facilities, sewer, snow removal, trash and water; Community pool amenity
Exterior
- Parking: Assigned parking (no garage)
- Utilities: Electric service 100 amps; Water via water tap fee
- Home design: Condominium in Stone Gate Condominiums; 3-story building; Entry on level 2
- Construction: Concrete perimeter foundation
- Exterior features: Private balcony; Community in-ground pool
Interior
- Kitchen: Dishwasher; Oven; Range; Refrigerator; Electric water heater
- Bedrooms: Total of 3 rooms (includes living spaces and bedrooms)
- Flooring: Carpet; Laminate
- Bathrooms: 1 full bathroom
- Heating & cooling: Electric baseboard heating; Window air conditioning units
- Interior features: Tub shower; Carpet and laminate flooring
- Laundry & utility: Common area laundry
Neighborhood map
What this means for you Summary
Snapshot
- This is a 1-bed/1.0-bath condo listed at $240k.
Deal economics
- At list price, monthly cash flow is $74 ($890/yr) — positive.
- The deal already cash-flows at list — no discount required.
- Meets the 1% rule at list price ($3k rent vs $240k).
- Recommended offer: $236k (1.5% below list) — sets the bar for market timing.
- Cap rate 6.7% vs local median 3.2% in East Providence — top-decile yield for the area; either an underpriced asset or a hidden risk that comps aren't pricing in. Stress-test before assuming the spread holds.
Location & tenants
- Location reads 74/100 on livability (#12 in RI, #4,784 nationally) — a middle-class / working-renter tenant base. Strengths: crime A+, housing A+, health & safety A+; Watch: schools D-, amenities F, commute F.
- East Providence (suburban): math 18% / reading 31% proficiency, ranked #26 of 39 in RI (top 67%) — low school quality limits family demand, transient renter base, plan for 1-2y turnover.
- Market conditions: Rents flat; 61 active listings in the ZIP; 11 comparable units currently listed for rent nearby; rentals at typical pace (median 16d on market — plan ~3-4 weeks tenant-placement turnaround); solid renter incomes; 776 units permitted in Providence County in 2024 (229 in 5+ unit buildings).
- This rent runs 36% of the median local income ($84k/yr) — at the standard rent-burdened threshold; future hikes will face affordability resistance.
Forward outlook
- Local home prices are declining (-3.0%/yr); year-one equity from $2k of loan paydown is wiped out by about $7k of value loss. Plan a longer hold.
- Providence County population projected at +5% by 2050 — modest demand growth; plan on rents tracking national, not racing it.
Negotiation context
- It's been on market 26 days — a 2% lower offer ($236k) is reasonable based on typical stale-listing flexibility.
- 2 sale attempts with the ask held roughly flat each time — persistent listings suggest the price (not the market) is what's stuck; bring a comps-based counter.
- Current owner paid $36k; list at $240k implies a 558% gain — meaningful room to come down on a strong offer.
Risks & watch-outs
- Climate carrying-cost: severe wind risk, 80% chance of damaging wind over 30y; extreme-heat days projected 7→15/yr by 2055 (HVAC capex compounding) — expect insurance premiums to compound above CPI over the hold.
Questions for the listing agent
- What does the HOA fee cover, when was the last increase, and are there any pending special assessments or reserve-fund shortfalls?
- Any open or pending special assessments — roof, HVAC, plumbing, elevator, façade? What's the per-unit balance and payoff schedule, and is the seller paying it off at close or rolling it to the buyer?
- Is there a deadline driving the sale (1031 exchange, divorce, estate, relocation)? That informs how much negotiation room exists.
- Schools are D-rated, which usually means shorter tenancies and higher turnover. Who's the typical renter profile here, and what's been the actual vacancy rate?
- What's the average days-on-market for RENTAL listings here right now (not sales)? A rising rental-DOM trend means longer vacancies and softer asking-rent achievability than the comps imply.
- What's the recent tenant-quality profile in this submarket — average credit score on applications, eviction rate, late-payment / NSF rate, and stable-employment percentage? A property-management company in the area should have these aggregated.
- How much new apartment / multifamily construction is in the pipeline within 1–3 miles? Heavy new supply (>2% of stock underway) typically softens rents 12–24 months out; light construction supports rent growth.
Investment metrics
- 1% rule
- 1.05% ✓
- Cap rate
- 6.66%
- Cash-on-cash
- 1.32%
- DSCR
- 1.06
- GRM
- 8.0
CMA / ARV
- ARV (median comp)
- $296,603
- List price
- $240,000
- Delta
- -19.08%
- Verdict
- UNDERPRICED
- Comps
- 20 within 1.0 mi
Projected returns pro-forma
-3.0% appreciation · 0.57% rent growth · sell at horizon
- IRR
- -17.3%
- Equity multiple
- 0.41×
- Total profit
- $-39,964
- Equity at exit
- $35,785
- IRR
- -15.4%
- Equity multiple
- 0.24×
- Total profit
- $-51,346
- Equity at exit
- $20,751
Cash invested: $67,200 (down + closing). Projections, not guarantees.
Landlord ↔ Tenant lean methodology
- Overall (STATE)
- 31 Tenant-Leaning
- State Rhode Island
- 31 Tenant-Leaning · D+8
- County
- — inherits STATE
- City
- — inherits STATE
ZIP-level market 02915
- Rents YoY
- 0.6%
- Active inventory
- 61
- Price-to-rent
- 8.0×
Monthly cashflow live
- Estimated rent
- $2,508 high interval (Pro) →
- Mortgage (P&I)
- −$1,259
- Tax from tax record
- −$259 /mo · $3,105/yr
- Insurance
- −$100
- HOA
- −$290
- Vacancy / Maint / Mgmt
- −$527
- Net cashflow
- $74
Break-even live
UW: 25.0% down · 7.5% · 30yr · 1.5% tax · 5.0% vac · 8.0% maint · 8.0% mgmt
Financing live
Cash to close
- Down payment
- $60,000
- Closing costs
- $7,200
- Reserves months
- —
- Total cash needed
- —
Loan-product check · same deal, 3 products live
Conventional
25% down · 7.5% · 30yr
- Down + closing
- —
- Monthly P&I
- —
- Monthly cashflow
- —
- DSCR
- —
- Eligible?
- —
Personal DTI + credit; lowest rate.
DSCR
20% down · 8.5% · 30yr
- Down + closing
- —
- Monthly P&I
- —
- Monthly cashflow
- —
- DSCR
- —
- Eligible?
- —
No personal income docs; deal must DSCR.
Hard money
10% down · 12.0% · 12mo
- Down + closing
- —
- Monthly P&I
- —
- Monthly cashflow
- —
- DSCR
- —
- Eligible?
- —
Short-term bridge; refi at stabilization.
Rent comps 11 comps
| Address | Beds | Baths | Sqft | Rent | $/sqft | DOM | Units | Dist |
|---|---|---|---|---|---|---|---|---|
| 35 Bullocks Point Ave Unit 6B Riverside, RI | 2.0 | 1.5 | 895 | $2,400 | $2.68 | 43d | 1 | 0.05mi |
| 21 Bullocks Point Ave Unit 1347756P Riverside, RI | 2.0 | 2.0 | 893 | $4,002 | $4.48 | 43d | 1 | 0.05mi |
| 3421 Pawtucket Ave Unit 2 Riverside, RI | 2.0 | 1.0 | 967 | $1,800 | $1.86 | 43d | 1 | 0.20mi |
| 50 Village Grn S #2 Riverside, RI | 2.0 | 1.0 | 900 | $2,000 | $2.22 | 4d | 1 | 0.63mi |
| 125 Village Grn N East Providence, RI | 1.0–3.0 | 1.0–2.0 | 961 | $1,556 | $1.62 | 1d | 34 | 0.72mi |
| 99 Cove St Unit 99 Riverside, RI | 2.0 | 1.0 | 1008 | $2,500 | $2.48 | 11d | 1 | 1.15mi |
| 300 E Shore Cir East Providence, RI | 1.0–2.0 | 1.0–2.0 | 937 | $1,950 | $2.08 | 1d | 4 | 1.44mi |
| 300 E Shore Cir Unit 109 East Providence, RI | 1.0 | 1.0 | 675 | $1,950 | $2.89 | 16d | 1 | 1.45mi |
| 300 E Shore Cir Unit 126 East Providence, RI | 1.0 | 1.0 | 1000 | $2,150 | $2.15 | 16d | 1 | 1.45mi |
| 300 E Shore Cir Unit 319 East Providence, RI | 1.0 | 1.0 | 675 | $2,050 | $3.04 | 16d | 1 | 1.45mi |
| 10 Wampanoag Trl Unit 2 Riverside, RI | 2.0 | 2.0 | 1004 | $2,875 | $2.86 | 3d | 1 | 1.45mi |
HOA detail condo
- Monthly dues
- $290 · $3,480/yr
- Likely covers
- waterpool
- Assessments
- None detected in remarks — confirm with the listing agent.
Listing history 8 events
-
2026-06-02status $240,000 Pending 26 DOM
-
2026-06-01days on market $240,000 Active 26 DOM
-
2026-05-31days on market $240,000 Active 25 DOM
-
2026-05-16status Active 643-char remark
-
2026-05-06status Pending 643-char remark
-
2026-04-26$249,900 Active 643-char remark
-
1992-02-10soldstatus $36,500
-
1990-09-07soldstatus $63,000
ⓘ Source: listings_history table (triggers on properties + properties_extension) + one-shot
backfill from property_details.listing_events for pre-trigger history.
Tax reassessment forecast RI · Partial reset (capped growth)
- Current annual tax
- $3,105 · $259/mo
- Projected year-2 tax
- $3,508 · $292/mo
- Expected delta
- +$404/yr (+$34/mo · 13.0%)
ⓘ Screening estimate from a state-policy table — verify with the county assessor before closing.
Climate risk First Street
- Flood 1/10 Low FEMA zone X (unshaded) · 0% chance over 30 yrs
- Wildfire 1/10 Low
- Heat 5/10 Major 7 d/yr ≥98°F today · 15 d/yr by 30 yrs out
- Wind 8/10 Severe 80% chance of damaging wind over 30 yrs
- Air quality 2/10 Low 1 unhealthy d/yr today · 2 by 30 yrs out
Nearby sold comps map
Loading sold comps map…
Walkable amenities ~0.75 mi
Loading nearby amenities…
Taxation est. · year 1
- Rental income
- $30,099
- − Mortgage interest
- −$13,444
- − Property taxes
- −$3,105
- − Insurance
- −$1,200
- − Repairs & maintenance
- −$2,408
- − Management
- −$2,408
- − HOA
- −$3,480
- − Depreciation
- −$6,982
- Taxable loss
- −$2,928
- Est. tax savings @ 24.0%
- +$703
- After-tax cash flow
- $1,592/yr
For passive investors: Depreciation is non-cash, so a rental often shows a tax loss while cash-flowing — sheltering income. Rental losses are passive: they offset passive income freely, and up to $25,000/yr can offset ordinary (W-2) income if you actively participate and your MAGI is under $100k (phasing out to $0 by $150k); unused losses carry forward. On sale, claimed depreciation is recaptured at up to 25%, and gains may owe capital-gains tax (a 1031 exchange can defer both). Figures are a year-1 estimate at your 24.0% rate — not tax advice; consult a CPA.
Schools (NCES district)
- District
- East Providence
- NCES district ID
- 4400330
- Math proficiency
- 18% ▼ -8.00%
- Reading proficiency
- 31% ▼ -5.00%
- Median HH income
- $51,011
- Composite
- 21.69/100
- National rank
- #8274
- State rank
- #26 of 39 in RI
Livability — East Providence
- Score
- 74/100
- State rank
- #12
- US rank
- #4784
Category grades
Schools grade is shown separately in the Schools card above.
Census & demographics
- Census place
- East Providence, RI
- County
- Providence County · 548,917 people
- City population
- 38,586
- Metro
- Providence-Warwick, RI-MA
- Population (ZIP)
- 16,752
- Household income
- $84,414
- Rent vs Own
- Severe rent burden
- 427.0
Population outlook (Providence County) Hauer SSP2
- Today (2025)
- 653,469 people
- By 2030
- 660,819 · +1.1%
- By 2040
- 672,747 · +3.0%
- By 2050
- 683,741 · +4.6%
- By 2075
- 720,435 · +10.2%
- By 2100
- 741,582 · +13.5%
Race, ethnicity, and origin ACS 2023
- Neighborhood character
- Predominantly White (77%)
- Race & ethnicity
- White 77% Two or more races 10% Hispanic / Latino 7% Black 3% Asian 2%
- Hispanic origin (detail)
- Mexican 4% Puerto Rican 2%
- Common ancestry
- Russian 17% Lithuanian 10% Slovak 3%
- Foreign-born
- 8% · Canada, China
- Languages at home
- 85% English-only · Other Indo-European 6% Spanish 5% French/Haitian/Cajun 2%
Political lean MEDSL · Providence
- 2024 margin
- D (+14.4) · D 56.1% · R 41.7% · Other 2.2%
- 2008→2024 swing
- -20.0pp toward R · 2008: 34.4pp · 2024: 14.4pp
- All cycles
- 2024: D+14.4 2020: D+22.9 2016: D+21.2 2012: D+34.9 2008: D+34.4
Not yet ingested
- Civics
- —
Market trends
- HPI YoY
- ▼ -422.21%
- Current HPI
- 362.8313
- Rent YoY
- ▲ 0.57%
- Metro
- Providence-Warwick, RI-MA
- State GDP YoY
- ▲ 2.25%
- F500 in state
- 10
Industry mix (Fortune 500 HQ in RI)
| Industry | F500 HQs | Revenue |
|---|---|---|
| Healthcare | 1 | $373B |
|
||
| Food Distribution | 1 | $31B |
|
||
| Aerospace / Defense | 1 | $14B |
|
||
| Financial Services | 1 | $8B |
|
||
| Consumer Goods | 1 | $4B |
|
||
Price history
+281.0% since first listed7 events — show timeline
- 2026-06-01 Pending — RIS
- 2026-05-26 Price Changed $240,000 RIS
- 2026-05-16 Relisted — RIS
- 2026-05-06 Pending — RIS
- 2026-04-26 Listed $249,900 RIS
- 1992-02-10 Sold (Public Records) $36,500 Public Records
- 1990-09-07 Sold (Public Records) $63,000 Public Records
Property tax history
+2.0%/yrLatest (2025): $3,105 · +7.7% YoY. Source: county tax records.
Cash-flow waterfall
monthlySold comps — $/sqft
last 12 mo · ≤1 miLoading sold comps…