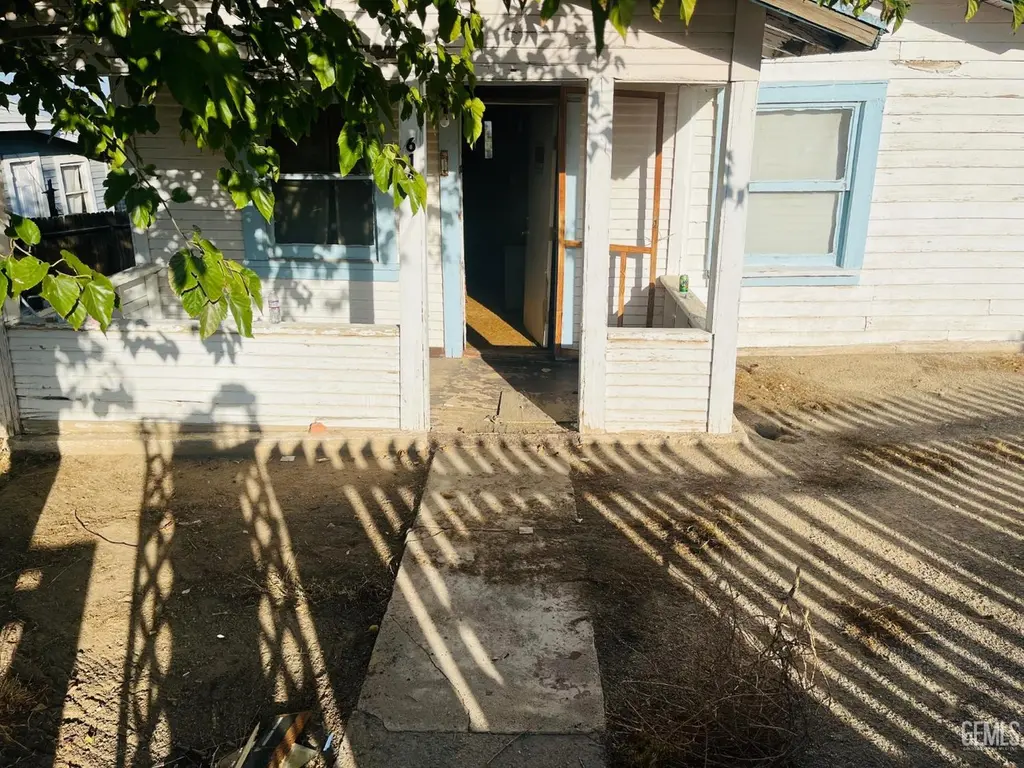
614 Shattuck Ave · South Taft, CA
Flood risk 1/10 · Minimal
- FEMA flood zone
- X (unshaded)
- Chance of flooding over 30 yrs
- 0.0%
- Est. flood insurance / yr
- $473 – $860
Fire risk 8/10 · Major
- Est. fire insurance / yr
- $659 – $1,223
Heat risk 8/10 · Major
- Hot days now (above 102°F)
- 5 days/yr
- Hot days in 30 yrs
- 11 days/yr
Wind risk 1/10 · Minimal
- Chance of severe wind over 30 yrs
- —
Air-quality risk 8/10 · Major
- Unhealthy air days now
- 18 days/yr
- Unhealthy air days in 30 yrs
- 22 days/yr
Risk factors via First Street. Map © Google.
Why this score? — see what drove the B+ grade
The composite is a weighted blend of 9 inputs, each scored 0–100. Each bar is that input's sub-score; the figure is the points it added to the 100-point composite (weight × sub-score).
- Cash flow +30.0/30.0
- ARV discount +15.0/15.0
- 1% rule +10.0/10.0
- DSCR +10.0/10.0
- Rent growth +5.0/5.0
- Schools +3.1/10.0
- Condition / age +2.5/5.0
- Livability +2.3/5.0
- Appreciation +0.0/10.0
$95,000
🖨 Deal sheet (PDF) 📄 Offer letter ✓ Due diligence
Listing remarks
FIXER UPPER! These 3 bed-1 bath home sits on a spacious lot, offering plenty of room for expansion, ADU, outdoor living , or a dream garden. With great bones and endless potential , it's perfect for investors , flippers, or buyers ready to bring their vision to life. Conveniently located close to schools and shopping plaza's. Don't miss the chance to transform this diamond in the rough into a beautiful home or profitable investment. its an 'AS IS ' Sale! Seller Financing Availble -Schedule your showing today!
Key facts
- Close to schools
- Spacious lot
- Outdoor living
Tags
Property features AI
Exterior
- Parking: RV parking/space available
- Utilities: Septic tank; Public water
- Home design: Single-family residential zoning (R1)
- Construction: Other roof (see remarks)
- Exterior features: Vacant lot occupancy; Has RV space
Interior
- Bathrooms: One full bathroom
- Interior features: Formal living room; No fireplace
Neighborhood map
What this means for you Summary
Snapshot
- This is a 3-bed/1.0-bath single-family listed at $95k.
Deal economics
- At list price, monthly cash flow is $474 ($6k/yr) — positive.
- The deal already cash-flows at list — no discount required.
- Meets the 1% rule at list price ($1k rent vs $95k).
- Recommended offer: $92k (3.0% below list) — sets the bar for market timing.
Location & tenants
- Location reads 46/100 on livability (#1,271 in CA) — a working-class tenant base; expect higher turnover. Strengths: cost of living B; Watch: amenities F, commute F, employment F.
- Taft City (town): math 28% / reading 39% proficiency, ranked #946 of 1,400 in CA (top 68%) — families likely to look elsewhere, expect single-tenant / working-renter base with shorter leases; 67% free/reduced lunch — lower-income household profile, screen leases tightly.
- Zoned schools: Conley Elementary (312 students, 91% FRL); Lincoln Junior High (math 75% / reading 75%, grade A, #25 of 498 statewide, top 6%, 795 students, 89% FRL); Taft Union High (math 8% / reading 47%, grade F, #785 of 1,170 statewide, top 67%, 1,102 students, 59% FRL).
- Zoned-school proficiency averages 51% at this address vs 34% district-wide (+18 pts) — the actual schools serving this property are materially stronger than the Taft City average implies; a family-tenant draw the district grade alone would hide.
- Market conditions: Rents rising fast (+13.6%/yr); 125 active listings in the ZIP; 3 comparable units currently listed for rent nearby; rentals leasing fast (median 5d on market — plan ~1-2 weeks tenant-placement turnaround); 3,244 units permitted in Kern County in 2024 (73 in 5+ unit buildings).
Forward outlook
- Local home prices are declining (-3.0%/yr); year-one equity from $657 of loan paydown is wiped out by about $3k of value loss. Plan a longer hold.
- Kern County population projected at +17% by 2050 — long-run rental-demand tailwind backs the buy-and-hold thesis.
- At projected returns (-3.0% appreciation + 8.0% rent growth), your $27k cash investment doubles in ~5 years — after that, you're playing with house money.
Negotiation context
- It's been on market 32 days — a 3% lower offer ($92k) is reasonable based on typical stale-listing flexibility.
- 3 sale attempts with the ask held roughly flat each time — persistent listings suggest the price (not the market) is what's stuck; bring a comps-based counter.
Risks & watch-outs
- Watch-outs: built in 1937 — expect roof / HVAC / electrical / plumbing capex.
- Climate carrying-cost: severe wildfire risk; extreme-heat days projected 5→11/yr by 2055 (HVAC capex compounding) — expect insurance premiums to compound above CPI over the hold.
Questions for the listing agent
- It's been on market 32 days. Have you received any prior offers? Is the seller open to a 3% concession, seller financing, or rate buy-down credit?
- Built in 1937 — when were the roof, HVAC, electrical panel, plumbing, and water heater last replaced?
- Is there a deadline driving the sale (1031 exchange, divorce, estate, relocation)? That informs how much negotiation room exists.
- Schools are F-rated, which usually means shorter tenancies and higher turnover. Who's the typical renter profile here, and what's been the actual vacancy rate?
- What's the average days-on-market for RENTAL listings here right now (not sales)? A rising rental-DOM trend means longer vacancies and softer asking-rent achievability than the comps imply.
- What's the recent tenant-quality profile in this submarket — average credit score on applications, eviction rate, late-payment / NSF rate, and stable-employment percentage? A property-management company in the area should have these aggregated.
- How much new for-sale + rental construction is in the pipeline within 1–3 miles? Heavy new supply typically softens prices + rents 12–24 months out; constrained supply supports both.
Investment metrics
- 1% rule
- 1.51% ✓
- Cap rate
- 12.28%
- Cash-on-cash
- 21.39%
- DSCR
- 1.95
- GRM
- 5.5
CMA / ARV
- ARV (on-the-fly)
- $174,122
- Comps found
- 12
Show comp detail 12 sales within ~0.75 mi
| Address | Dist | Beds/Ba | Sqft | Sold | Price | $/sf | Match |
|---|---|---|---|---|---|---|---|
| 131 Oak St | 0.46mi | 3/1.0 | 974 (+1%) | 6mo | $205,000 | $210 | 72 |
| 408 Naylor Ave | 0.27mi | 3/1.0 | 863 (-10%) | 3mo | $135,000 | $156 | 68 |
| 116 Shattuck Ave | 0.42mi | 3/1.0 | 930 (-3%) | 11mo | $185,000 | $199 | 66 |
| 216 Shattuck | 0.34mi | 3/1.5 | 1,088 (+13%) | 2mo | $185,000 | $170 | 59 |
| 331 D | 0.52mi | 2/1.0 (-1) | 1,005 (+4%) | 8mo | $80,500 | $80 | 56 |
| 211 Montview Ave | 0.52mi | 3/2.0 | 1,036 (+8%) | 7mo | $202,000 | $195 | 53 |
| 411 A St | 0.68mi | 2/1.0 (-1) | 934 (-3%) | 8mo | $157,180 | $168 | 51 |
| 132 Franklin Ave | 0.60mi | 3/1.0 | 1,053 (+10%) | 10mo | $255,000 | $242 | 48 |
| 224 Eastern Ave | 0.47mi | 3/1.0 | 824 (-14%) | 9mo | $149,000 | $181 | 47 |
| 322 S 8th St | 0.57mi | 2/1.0 (-1) | 846 (-12%) | 10mo | $174,000 | $206 | 40 |
| 314 Philippine St | 0.54mi | 2/2.0 (-1) | 1,096 (+14%) | 7mo | $193,000 | $176 | 37 |
| 505 B St | 0.71mi | 2/1.0 (-1) | 852 (-11%) | 7mo | $112,000 | $131 | 37 |
Match score weights: distance 35% · size 25% · config 20% · recency 20%. Top-matched comps best support the ARV.
Projected returns pro-forma
-3.0% appreciation · 8.0% rent growth · sell at horizon
- IRR
- 19.5%
- Equity multiple
- 1.84×
- Total profit
- $22,388
- Equity at exit
- $14,165
- IRR
- 31.0%
- Equity multiple
- 4.49×
- Total profit
- $92,891
- Equity at exit
- $8,214
Cash invested: $26,600 (down + closing). Projections, not guarantees.
Landlord ↔ Tenant lean methodology
- Overall (STATE)
- 18 Strongly Tenant-Friendly
- State California
- 18 Strongly Tenant-Friendly · D+13
- County
- — inherits STATE
- City
- — inherits STATE
ZIP-level market 93268
- Home prices YoY
- -29.6%
- Rents YoY
- 13.6%
- Active inventory
- 125
- Price-to-rent
- 5.5×
Monthly cashflow live
- Estimated rent
- $1,431 medium interval (Pro) →
- Mortgage (P&I)
- −$498
- Tax from tax record
- −$119 /mo · $1,425/yr
- Insurance
- −$40
- HOA
- −$0
- Vacancy / Maint / Mgmt
- −$301
- Net cashflow
- $474
Break-even live
Sensitivity live
| Price | -10% $528 | -5% $501 | +0% $474 | +5% $447 | +10% $420 |
|---|---|---|---|---|---|
| Rent | -10% $361 | -5% $418 | +0% $474 | +5% $531 | +10% $587 |
| Rate | -1.0pp $522 | -0.5pp $498 | base $474 | +0.5pp $449 | +1.0pp $424 |
UW: 25.0% down · 7.5% · 30yr · 1.5% tax · 5.0% vac · 8.0% maint · 8.0% mgmt
Financing live
Cash to close
- Down payment
- $23,750
- Closing costs
- $2,850
- Reserves months
- —
- Total cash needed
- —
Loan-product check · same deal, 3 products live
Conventional
25% down · 7.5% · 30yr
- Down + closing
- —
- Monthly P&I
- —
- Monthly cashflow
- —
- DSCR
- —
- Eligible?
- —
Personal DTI + credit; lowest rate.
DSCR
20% down · 8.5% · 30yr
- Down + closing
- —
- Monthly P&I
- —
- Monthly cashflow
- —
- DSCR
- —
- Eligible?
- —
No personal income docs; deal must DSCR.
Hard money
10% down · 12.0% · 12mo
- Down + closing
- —
- Monthly P&I
- —
- Monthly cashflow
- —
- DSCR
- —
- Eligible?
- —
Short-term bridge; refi at stabilization.
Rent comps 3 comps
| Address | Beds | Baths | Sqft | Rent | $/sqft | DOM | Units | Dist |
|---|---|---|---|---|---|---|---|---|
| 553 Front St Taft, CA | 2.0 | 1.0 | 943 | $1,575 | $1.67 | 4d | 1 | 0.54mi |
| 409 A St Taft, CA | 3.0 | 1.0 | 840 | $1,300 | $1.55 | 4d | 1 | 0.67mi |
| 522 Center St Unit D Taft, CA | 3.0 | 1.0 | 1047 | $1,325 | $1.27 | 23d | 1 | 0.79mi |
Listing history 21 events
-
2026-06-21days on market $95,000 Active 32 DOM
-
2026-06-18days on market $95,000 Active 29 DOM
-
2026-06-17days on market $95,000 Active 28 DOM
-
2026-06-16days on market $95,000 Active 27 DOM
-
2026-06-15days on market $95,000 Active 26 DOM
-
2026-06-14days on market $95,000 Active 24 DOM
-
2026-06-13days on market $95,000 Active 23 DOM
-
2026-06-10days on market $95,000 Active 21 DOM
-
2026-06-09remarks 514-char remark
-
2026-06-09days on market $95,000 Active 20 DOM
-
2026-06-08days on market $95,000 Active 19 DOM
-
2026-06-07days on market $95,000 Active 18 DOM
-
2026-06-05days on market $95,000 Active 15 DOM
-
2026-06-03days on market $95,000 Active 14 DOM
-
2026-06-03days on market $95,000 Active 13 DOM
-
2026-06-01days on market $95,000 Active 12 DOM
-
2026-05-31days on market $95,000 Active 11 DOM
-
2026-05-20status Pending
-
2026-05-12$95,000 Active
-
2026-01-03$108,500 Active
-
2025-10-11$115,000 Active
ⓘ Source: listings_history table (triggers on properties + properties_extension) + one-shot
backfill from property_details.listing_events for pre-trigger history.
Tax reassessment forecast CA · Resets to sale price
- Current annual tax
- $1,425 · $119/mo
- Projected year-2 tax
- $1,425 · $119/mo
- Expected delta
- $0/yr ($0/mo · 0.0%)
ⓘ Screening estimate from a state-policy table — verify with the county assessor before closing.
Climate risk First Street
- Flood 1/10 Low FEMA zone X (unshaded) · 0% chance over 30 yrs
- Wildfire 8/10 Severe
- Heat 8/10 Severe 5 d/yr ≥102°F today · 11 d/yr by 30 yrs out
- Wind 1/10 Low
- Air quality 8/10 Severe 18 unhealthy d/yr today · 22 by 30 yrs out
Nearby sold comps map
Loading sold comps map…
Walkable amenities ~0.75 mi
Loading nearby amenities…
Taxation est. · year 1
- Rental income
- $17,175
- − Mortgage interest
- −$5,321
- − Property taxes
- −$1,425
- − Insurance
- −$475
- − Repairs & maintenance
- −$1,374
- − Management
- −$1,374
- − Depreciation
- −$2,764
- Taxable income
- $4,441
- Est. tax owed @ 24.0%
- −$1,066
- After-tax cash flow
- $4,623/yr
For passive investors: Depreciation is non-cash, so a rental often shows a tax loss while cash-flowing — sheltering income. Rental losses are passive: they offset passive income freely, and up to $25,000/yr can offset ordinary (W-2) income if you actively participate and your MAGI is under $100k (phasing out to $0 by $150k); unused losses carry forward. On sale, claimed depreciation is recaptured at up to 25%, and gains may owe capital-gains tax (a 1031 exchange can defer both). Figures are a year-1 estimate at your 24.0% rate — not tax advice; consult a CPA.
Schools (NCES district)
- District
- Taft City
- NCES district ID
- 0638700
- Math proficiency
- 28% ▲ 2.00%
- Reading proficiency
- 39% ▲ 2.00%
- Median HH income
- $42,498
- Composite
- 31.06/100
- National rank
- #11302
- State rank
- #946 of 1400 in CA
Livability — South Taft
- Score
- 46/100
- State rank
- #1271
- US rank
- #26438
Category grades
Schools grade is shown separately in the Schools card above.
Census & demographics
- Census place
- South Taft, CA
- County
- Kern County · 710,371 people
- Metro
- Bakersfield, CA
- Population (ZIP)
- 16,963
- Household income
- $57,778
- Rent vs Own
- Severe rent burden
- 819.0
Population outlook (Kern County) Hauer SSP2
- Today (2025)
- 947,286 people
- By 2030
- 978,984 · +3.3%
- By 2040
- 1,045,018 · +10.3%
- By 2050
- 1,105,232 · +16.7%
- By 2075
- 1,229,538 · +29.8%
- By 2100
- 1,238,059 · +30.7%
Race, ethnicity, and origin ACS 2023
- Neighborhood character
- Majority White (51%)
- Race & ethnicity
- White 51% Hispanic / Latino 44% Two or more races 14%
- Hispanic origin (detail)
- Mexican 42%
- Common ancestry
- Slovak 2% Italian 1% Portuguese 1%
- Foreign-born
- 16% · Canada
- Languages at home
- 65% English-only · Spanish 34%
Political lean MEDSL · Kern
- 2024 margin
- Strong R (+21.1) · D 38.2% · R 59.3% · Other 2.5%
- 2008→2024 swing
- -3.3pp toward R · 2008: -17.8pp · 2024: -21.1pp
- All cycles
- 2024: R+21.1 2020: R+10.2 2016: R+15.0 2012: R+20.9 2008: R+17.8
Not yet ingested
- Civics
- —
Market trends
- HPI YoY
- ▼ -124.10%
- Current HPI
- 295.2655
- Rent YoY
- ▲ 13.62%
- Metro
- Bakersfield, CA
- State GDP YoY
- ▲ 3.21%
- F500 in state
- 116
Industry mix (Fortune 500 HQ in CA)
| Industry | F500 HQs | Revenue |
|---|---|---|
| Technology | 27 | $1,492B |
|
||
| Financial Services | 3 | $174B |
|
||
| Retail | 3 | $44B |
|
||
| Insurance | 3 | $26B |
|
||
| Media / Entertainment | 2 | $115B |
|
||
| Pharmaceuticals / Biotech | 2 | $62B |
|
||
Price history
-17.4% since first listed4 events — show timeline
- 2026-05-20 Pending — GEMLS
- 2026-05-12 Listed $95,000 GEMLS
- 2026-01-03 Listed $108,500 GEMLS
- 2025-10-11 Listed $115,000 GEMLS
Property tax history
+6.0%/yrLatest (2025): $1,425 · +4.4% YoY. Source: county tax records.
Cash-flow waterfall
monthlySold comps — $/sqft
last 12 mo · ≤1 miLoading sold comps…