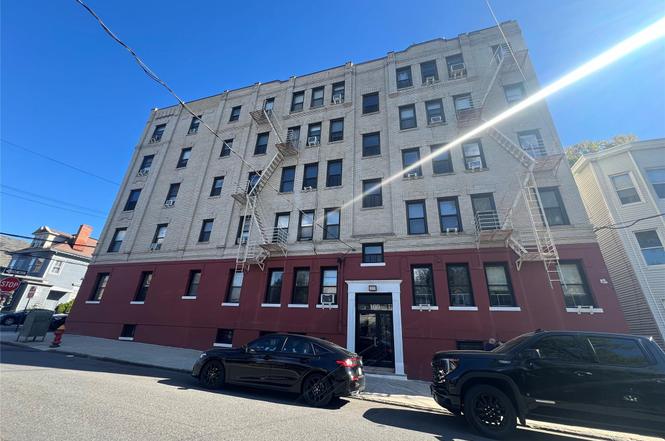
100 Livingston St Unit 1B · Yonkers, NY
Flood risk 1/10 · Minimal
- FEMA flood zone
- X (unshaded)
- Chance of flooding over 30 yrs
- 0.0%
- Est. flood insurance / yr
- $473 – $860
Fire risk 1/10 · Minimal
- Est. fire insurance / yr
- $691 – $1,283
Heat risk 6/10 · Moderate
- Hot days now (above 99°F)
- 7 days/yr
- Hot days in 30 yrs
- 15 days/yr
Wind risk 6/10 · Moderate
- Chance of severe wind over 30 yrs
- 27.0%
Air-quality risk 3/10 · Minor
- Unhealthy air days now
- 3 days/yr
- Unhealthy air days in 30 yrs
- 4 days/yr
Risk factors via First Street. Map © Google.
Why this score? — see what drove the B grade
The composite is a weighted blend of 9 inputs, each scored 0–100. Each bar is that input's sub-score; the figure is the points it added to the 100-point composite (weight × sub-score).
- Cash flow +30.0/30.0
- 1% rule +10.0/10.0
- DSCR +10.0/10.0
- ARV discount +7.5/15.0
- Rent growth +4.8/5.0
- Schools +4.1/10.0
- Livability +3.4/5.0
- Condition / age +2.5/5.0
- Appreciation +0.0/10.0
$150,000
🖨 Deal sheet 📄 Offer letter ✓ Due diligence
Listing remarks
Welcome to this well maintained 2-Bedroom, 1-Bath Co-op in Yonkers! Located on the lower-level of a well-maintained building. Features include hardwood floors, good natural light, and a practical layout-perfect for relaxing or entertaining. Laundry available in the building and ample street parking! Convenient location close to shops, transportation, and local amenities. This home combines comfort, convenience, and value in one.
Key facts
- Practical layout
- Ample street parking
- Convenient location
Tags
Neighborhood map
What this means for you Summary
Snapshot
- This is a 2-bed/1.0-bath condo listed at $150k.
Deal economics
- At list price, monthly cash flow is $1k ($13k/yr) — positive.
- The deal already cash-flows at list — no discount required.
- Meets the 1% rule at list price ($3k rent vs $150k).
- Recommended offer: $146k (3.0% below list) — sets the bar for market timing.
- Cap rate 14.6% vs local median 5.3% in Yonkers — top-decile yield for the area; either an underpriced asset or a hidden risk that comps aren't pricing in. Stress-test before assuming the spread holds.
Location & tenants
- Location reads 68/100 on livability (#528 in NY) — a middle-class / working-renter tenant base. Strengths: employment A, commute B; Watch: amenities F, cost of living F.
- Yonkers City School District (suburban): math 41% / reading 54% proficiency, ranked #413 of 590 in NY (top 70%) — families likely to look elsewhere, expect single-tenant / working-renter base with shorter leases; 64% free/reduced lunch — lower-income household profile, screen leases tightly.
- Zoned schools: Yonkers Early Childhood Academy (327 students, 72% FRL); Yonkers Middle School (math 17% / reading 37%, grade F, #587 of 729 statewide, top 81%, 601 students, 88% FRL); Yonkers High School (math 92% / reading 88%, grade A+, #238 of 1,100 statewide, top 23%, 1,060 students, 76% FRL) — zoned schools average 79% FRL vs 64% district-wide (15 pts higher); higher-poverty schools than district average — tighter screening recommended.
- Market conditions: Rents rising fast (+9.0%/yr); 86 active listings in the ZIP; 38 comparable units currently listed for rent nearby; rentals at typical pace (median 18d on market — plan ~3-4 weeks tenant-placement turnaround); 954 units permitted in Westchester County in 2024 (649 in 5+ unit buildings).
- At $2,632/mo this rent would consume 46% of the median local household income ($68k/yr) (locally 2783% of renters already pay >50% of income on rent) — very limited rent-growth headroom before tenants either downsize or default.
Forward outlook
- Local home prices are declining (-3.0%/yr); year-one equity from $1k of loan paydown is wiped out by about $4k of value loss. Plan a longer hold.
- Westchester County population projected at +10% by 2050 — modest demand growth; plan on rents tracking national, not racing it.
- At projected returns (-3.0% appreciation + 8.0% rent growth), your $42k cash investment doubles in ~4 years — after that, you're playing with house money.
Negotiation context
- It's been on market 59 days — a 3% lower offer ($146k) is reasonable based on typical stale-listing flexibility.
Risks & watch-outs
- Watch-outs: built in 1920 — expect roof / HVAC / electrical / plumbing capex.
- Climate carrying-cost: major wind risk, 27% chance of damaging wind over 30y; extreme-heat days projected 7→15/yr by 2055 (HVAC capex compounding) — expect insurance premiums to compound above CPI over the hold.
Questions for the listing agent
- It's been on market 59 days. Have you received any prior offers? Is the seller open to a 3% concession, seller financing, or rate buy-down credit?
- Built in 1920 — when were the roof, HVAC, electrical panel, plumbing, and water heater last replaced?
- Any open or pending special assessments — roof, HVAC, plumbing, elevator, façade? What's the per-unit balance and payoff schedule, and is the seller paying it off at close or rolling it to the buyer?
- Is there a deadline driving the sale (1031 exchange, divorce, estate, relocation)? That informs how much negotiation room exists.
- What's the average days-on-market for RENTAL listings here right now (not sales)? A rising rental-DOM trend means longer vacancies and softer asking-rent achievability than the comps imply.
- What's the recent tenant-quality profile in this submarket — average credit score on applications, eviction rate, late-payment / NSF rate, and stable-employment percentage? A property-management company in the area should have these aggregated.
- How much new apartment / multifamily construction is in the pipeline within 1–3 miles? Heavy new supply (>2% of stock underway) typically softens rents 12–24 months out; light construction supports rent growth.
Investment metrics
- 1% rule
- 1.75% ✓
- Cap rate
- 14.63%
- Cash-on-cash
- 29.78%
- DSCR
- 2.33
- GRM
- 4.7
CMA / ARV
No comps found within radius.
Projected returns pro-forma
-3.0% appreciation · 8.0% rent growth · sell at horizon
- IRR
- 29.9%
- Equity multiple
- 2.33×
- Total profit
- $56,035
- Equity at exit
- $22,365
- IRR
- 39.9%
- Equity multiple
- 5.71×
- Total profit
- $197,749
- Equity at exit
- $12,969
Cash invested: $42,000 (down + closing). Projections, not guarantees.
Landlord ↔ Tenant lean methodology
- Overall (CITY)
- 5 Strongly Tenant-Friendly
- State New York
- 15 Strongly Tenant-Friendly · D+10
- County
- — inherits STATE
- City Yonkers
- 5 Strongly Tenant-Friendly · D+20
ZIP-level market 10705
- Rents YoY
- 9.0%
- Active inventory
- 86
- Price-to-rent
- 4.7×
Monthly cashflow live
- Estimated rent
- $2,632 high interval (Pro) →
- Mortgage (P&I)
- −$787
- Tax est. 1.5%
- −$188 /mo · $2,250/yr
- Insurance
- −$62
- HOA
- −$0
- Vacancy / Maint / Mgmt
- −$553
- Net cashflow
- $1,042
Break-even live
UW: 25.0% down · 7.5% · 30yr · 1.5% tax · 5.0% vac · 8.0% maint · 8.0% mgmt
Financing live
Cash to close
- Down payment
- $37,500
- Closing costs
- $4,500
- Reserves months
- —
- Total cash needed
- —
Loan-product check · same deal, 3 products live
Conventional
25% down · 7.5% · 30yr
- Down + closing
- —
- Monthly P&I
- —
- Monthly cashflow
- —
- DSCR
- —
- Eligible?
- —
Personal DTI + credit; lowest rate.
DSCR
20% down · 8.5% · 30yr
- Down + closing
- —
- Monthly P&I
- —
- Monthly cashflow
- —
- DSCR
- —
- Eligible?
- —
No personal income docs; deal must DSCR.
Hard money
10% down · 12.0% · 12mo
- Down + closing
- —
- Monthly P&I
- —
- Monthly cashflow
- —
- DSCR
- —
- Eligible?
- —
Short-term bridge; refi at stabilization.
Rent comps 38 comps
| Address | Beds | Baths | Sqft | Rent | $/sqft | DOM | Units | Dist |
|---|---|---|---|---|---|---|---|---|
| 117 Morris St Yonkers, NY | 1.0 | 1.0 | 700 | $2,000 | $2.86 | 5d | 1 | 0.23mi |
| 280 Hawthorne Ave Yonkers, NY | 1.0 | 1.0 | 700 | $2,100 | $3.00 | 7d | 2 | 0.26mi |
| 16 Pier St Yonkers, NY | 3.0 | 1.0 | 1000 | $3,200 | $3.20 | 16d | 1 | 0.27mi |
| 36 Bruce Ave Yonkers, NY | 1.0 | 1.0 | 625 | $1,785 | $2.86 | 43d | 1 | 0.31mi |
| 14 Highland Ave Unit 2A Yonkers, NY | 1.0 | 1.0 | 1000 | $1,500 | $1.50 | 19d | 1 | 0.34mi |
| 106 McLean Ave Yonkers, NY | 3.0 | 1.0 | 1000 | $3,200 | $3.20 | 43d | 1 | 0.41mi |
| 65 Caroline Ave Unit 1L Yonkers, NY | 3.0 | 1.0 | 1050 | $2,700 | $2.57 | 43d | 1 | 0.45mi |
| 52 Groshon Ave Apt 2N Yonkers, NY | 3.0 | 1.0 | 1000 | $2,469 | $2.47 | 43d | 1 | 0.48mi |
| 212 Buena Vista Ave Unit 3F Yonkers, NY | 1.0 | 1.0 | 800 | $2,100 | $2.62 | 19d | 1 | 0.59mi |
| 249 McLean Ave Unit 1B Yonkers, NY | 1.0 | 1.0 | 700 | $2,500 | $3.57 | 18d | 1 | 0.71mi |
| 162 Willow St Unit 1F Yonkers, NY | 1.0 | 1.0 | 700 | $2,200 | $3.14 | 15d | 1 | 0.78mi |
| 162 Willow St Yonkers, NY | 1.0 | 1.0 | 700 | $2,100 | $3.00 | 7d | 1 | 0.78mi |
| 158 Willow St Unit 1B Yonkers, NY | 2.0 | 1.0 | 600 | $2,100 | $3.50 | 1d | 1 | 0.79mi |
| 57 Putnam Ave Yonkers, NY | 2.0 | 1.0 | 900 | $3,000 | $3.33 | 22d | 1 | 0.88mi |
| 57 Putnam Ave Yonkers, NY | 2.0 | 1.0 | 900 | $3,000 | $3.33 | 11d | 1 | 0.88mi |
| 97 Waverly St Unit 3R Yonkers, NY | 1.0 | 1.0 | 600 | $1,850 | $3.08 | 15d | 1 | 0.90mi |
| 20 Water Grant St Yonkers, NY | 1.0–2.0 | 1.0–2.0 | 827 | $3,756 | $4.54 | 1d | 22 | 0.91mi |
| 130 Harrison Ave Yonkers, NY | 1.0 | 1.0 | 650 | $1,900 | $2.92 | 43d | 1 | 0.92mi |
| 39 Spruce St Unit 1 Yonkers, NY | 3.0 | 1.5 | 920 | $3,300 | $3.59 | 43d | 1 | 0.94mi |
| 44 Hudson St Yonkers, NY | 2.0 | 1.0–2.0 | 922 | $4,300 | $4.66 | 7d | 25 | 0.94mi |
| 50 Main St Unit 3F Yonkers, NY | 1.0 | 1.0 | 900 | $2,000 | $2.22 | 24d | 1 | 0.99mi |
| 66 Main St Yonkers, NY | 2.0 | 1.0–2.0 | 906 | $3,323 | $3.67 | 3d | 4 | 1.00mi |
| 23 N Broadway Unit 4F Yonkers, NY | 2.0 | 1.0 | 699 | $2,400 | $3.43 | 22d | 1 | 1.02mi |
| 50 Nepperhan St Yonkers, NY | 3.0 | 1.0–2.0 | 887 | $4,063 | $4.58 | 2d | 20 | 1.04mi |
| 91 Elm St Unit 1A Yonkers, NY | 1.0 | 1.0 | 650 | $1,800 | $2.77 | 16d | 1 | 1.04mi |
| 91 Elm St Unit 1A Yonkers, NY | 1.0 | 1.0 | 650 | $1,900 | $2.92 | 43d | 1 | 1.04mi |
| 189 Elm St Unit 1 Yonkers, NY | 3.0 | 1.0 | 1000 | $2,650 | $2.65 | 43d | 1 | 1.06mi |
| 45 Linden St Yonkers, NY | 3.0 | 3.0 | 800 | $3,100 | $3.88 | 4d | 1 | 1.07mi |
| 39 Victor St Unit 2 Yonkers, NY | 3.0 | 1.0 | 900 | $2,650 | $2.94 | 43d | 1 | 1.10mi |
| 30 Locust Hill Ave Yonkers, NY | 1.0–2.0 | 1.0 | 735 | $2,500 | $3.40 | 7d | 2 | 1.10mi |
| 30 Locust Hill Ave Yonkers, NY | 1.0–2.0 | 1.0 | 735 | $2,500 | $3.40 | 43d | 3 | 1.10mi |
| 1 Alexander St Yonkers, NY | 2.0 | 1.0–2.0 | 837 | $4,000 | $4.78 | 7d | 48 | 1.15mi |
| 57 Alexander St Yonkers, NY | 2.0 | 1.0–2.0 | 765 | $3,690 | $4.82 | 2d | 21 | 1.33mi |
| 79 Alexander St Yonkers, NY | 3.0 | 1.0–2.5 | 997 | $3,532 | $3.54 | 2d | 1 | 1.39mi |
| 20 Porach St Apt -1B Yonkers, NY | 2.0 | 1.0 | 750 | $2,400 | $3.20 | 43d | 1 | 1.41mi |
| 20 Porach St Unit 2A Yonkers, NY | 1.0 | 1.0 | 550 | $2,200 | $4.00 | 43d | 1 | 1.41mi |
| 675 McLean Ave Unit 006H Yonkers, NY | 1.0 | 1.0 | 577 | $2,071 | $3.59 | 4d | 1 | 1.42mi |
| 4 Ritters Ln Unit 1FL Yonkers, NY | 3.0 | 1.0 | 1100 | $3,300 | $3.00 | 43d | 1 | 1.48mi |
HOA detail condo
- Monthly dues
- $0 · $0/yr
- Assessments
- None detected in remarks — confirm with the listing agent.
Listing history 2 events
-
2026-03-16status Pending
-
2025-10-28$150,000 Active
ⓘ Source: listings_history table (triggers on properties + properties_extension) + one-shot
backfill from property_details.listing_events for pre-trigger history.
Climate risk First Street
- Flood 1/10 Low FEMA zone X (unshaded) · 0% chance over 30 yrs
- Wildfire 1/10 Low
- Heat 6/10 Major 7 d/yr ≥99°F today · 15 d/yr by 30 yrs out
- Wind 6/10 Major 27% chance of damaging wind over 30 yrs
- Air quality 3/10 Moderate 3 unhealthy d/yr today · 4 by 30 yrs out
Nearby sold comps map
Loading sold comps map…
Walkable amenities ~0.75 mi
Loading nearby amenities…
Taxation est. · year 1
- Rental income
- $31,581
- − Mortgage interest
- −$8,402
- − Property taxes
- −$2,250
- − Insurance
- −$750
- − Repairs & maintenance
- −$2,526
- − Management
- −$2,526
- − Depreciation
- −$4,364
- Taxable income
- $10,762
- Est. tax owed @ 24.0%
- −$2,583
- After-tax cash flow
- $9,926/yr
For passive investors: Depreciation is non-cash, so a rental often shows a tax loss while cash-flowing — sheltering income. Rental losses are passive: they offset passive income freely, and up to $25,000/yr can offset ordinary (W-2) income if you actively participate and your MAGI is under $100k (phasing out to $0 by $150k); unused losses carry forward. On sale, claimed depreciation is recaptured at up to 25%, and gains may owe capital-gains tax (a 1031 exchange can defer both). Figures are a year-1 estimate at your 24.0% rate — not tax advice; consult a CPA.
Schools (NCES district)
- District
- Yonkers City School District
- NCES district ID
- 3631920
- Math proficiency
- 41% ▼ -1.00%
- Reading proficiency
- 54% ▲ 14.00%
- Median HH income
- $58,042
- Composite
- 41.43/100
- National rank
- #3471
- State rank
- #413 of 590 in NY
Livability — Yonkers
- Score
- 68/100
- State rank
- #528
- US rank
- #9394
Category grades
Schools grade is shown separately in the Schools card above.
Census & demographics
- Census place
- Yonkers, NY
- County
- Westchester County · 709,332 people
- City population
- 212,407
- Metro
- New York-Newark-Jersey City, NY-NJ-PA
- Population (ZIP)
- 38,887
- Household income
- $67,918
- Rent vs Own
- Severe rent burden
- 2783.0
Population outlook (Westchester County) Hauer SSP2
- Today (2025)
- 1,028,035 people
- By 2030
- 1,051,636 · +2.3%
- By 2040
- 1,098,520 · +6.9%
- By 2050
- 1,136,044 · +10.5%
- By 2075
- 1,196,925 · +16.4%
- By 2100
- 1,175,147 · +14.3%
Race, ethnicity, and origin ACS 2023
- Neighborhood character
- Diverse neighborhood (Simpson 0.56)
- Race & ethnicity
- Hispanic / Latino 62% White 17% Two or more races 16% Black 12% Asian 5% Native American 1%
- Hispanic origin (detail)
- Mexican 13% Puerto Rican 9% Dominican 27%
- Common ancestry
- Scotch-Irish 1% Romanian 1%
- Foreign-born
- 40% · Canada, Jamaica, South Korea
- Languages at home
- 39% English-only · Spanish 51% Other Indo-European 3% Other Asian/Pacific 2%
Political lean MEDSL · Westchester
- 2024 margin
- Strong D (+26.3) · D 63.1% · R 36.9%
- 2008→2024 swing
- -1.3pp toward R · 2008: 27.6pp · 2024: 26.3pp
- All cycles
- 2024: D+26.3 2020: D+36.3 2016: D+32.8 2012: D+22.2 2008: D+27.6
Not yet ingested
- Civics
- —
Market trends
- HPI YoY
- ▼ -368.22%
- Current HPI
- 314.1777
- Rent YoY
- ▲ 9.00%
- Metro
- New York-Newark-Jersey City, NY-NJ-PA
- State GDP YoY
- ▲ 2.60%
- F500 in state
- 92
Industry mix (Fortune 500 HQ in NY)
| Industry | F500 HQs | Revenue |
|---|---|---|
| Financial Services | 10 | $950B |
|
||
| Consumer Goods | 9 | $162B |
|
||
| Insurance | 4 | $225B |
|
||
| Telecommunications | 2 | $144B |
|
||
| Pharmaceuticals | 2 | $112B |
|
||
| Media / Entertainment | 2 | $69B |
|
||
Price history
2 events — show timeline
- 2026-03-16 Pending — OneKey® MLS as Distributed by MLS Grid
- 2025-10-28 Listed $150,000 OneKey® MLS as Distributed by MLS Grid
Cash-flow waterfall
monthlySold comps — $/sqft
last 12 mo · ≤1 miLoading sold comps…