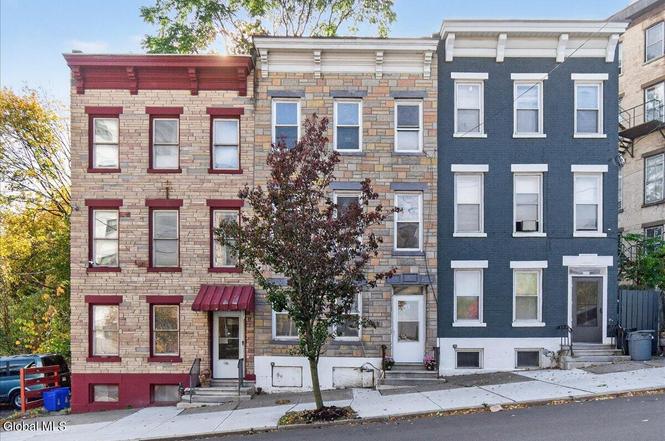
98 Livingston Ave · Albany, NY
Flood risk 1/10 · Minimal
- FEMA flood zone
- X (unshaded)
- Chance of flooding over 30 yrs
- 0.0%
- Est. flood insurance / yr
- $473 – $860
Fire risk 3/10 · Minor
- Est. fire insurance / yr
- $691 – $1,283
Heat risk 4/10 · Minor
- Hot days now (above 97°F)
- 7 days/yr
- Hot days in 30 yrs
- 17 days/yr
Wind risk 3/10 · Minor
- Chance of severe wind over 30 yrs
- 6.0%
Air-quality risk 2/10 · Minimal
- Unhealthy air days now
- 0 days/yr
- Unhealthy air days in 30 yrs
- 1 days/yr
Risk factors via First Street. Map © Google.
Why this score? — see what drove the C+ grade
The composite is a weighted blend of 9 inputs, each scored 0–100. Each bar is that input's sub-score; the figure is the points it added to the 100-point composite (weight × sub-score).
- Cash flow +16.0/30.0
- ARV discount +15.0/15.0
- 1% rule +5.4/10.0
- Appreciation +5.0/10.0
- DSCR +4.9/10.0
- Rent growth +4.0/5.0
- Livability +4.0/5.0
- Schools +3.2/10.0
- Condition / age +2.5/5.0
$199,000
🖨 Deal sheet (PDF) 📄 Offer letter ✓ Due diligence
Listing remarks MLS
Beautiful single family townhome with 3 floors of living space. Freshly painted, some updates. Very cute back yard patio with raised beds. Large living/family room. Why rent when you can own a piece of historical Albany. Excellent Condition
Key facts
- Private patio
- Walkable convenience
- Built 1857
Tags
Neighborhood map
What this means for you Summary
Snapshot
- This is a 3-bed/1.0-bath townhouse listed at $199k.
Deal economics
- At list price, monthly cash flow is $98 ($1k/yr) — positive.
- The deal already cash-flows at list — no discount required.
- Meets the 1% rule at list price ($2k rent vs $199k).
- Recommended offer: $175k (12.0% below list) — sets the bar for market timing.
- Cap rate 6.9% vs local median 5.7% in Albany — meaningfully above typical; check what's discounted (condition, days-on-market, listing class) to confirm the premium yield is real.
Location & tenants
- Location reads 79/100 on livability (#129 in NY, #2,083 nationally) — a middle-class / working-renter tenant base. Strengths: amenities A+, commute A+, housing A+; Watch: employment C-, crime F.
- Albany City School District (urban): math 37% / reading 40% proficiency, ranked #543 of 590 in NY (top 92%) — families likely to look elsewhere, expect single-tenant / working-renter base with shorter leases; 66% free/reduced lunch — lower-income household profile, screen leases tightly.
- Zoned schools: Arbor Hill Elementary School (math 17% / reading 17%, grade F, #2,011 of 2,108 statewide, top 96%, 265 students, 87% FRL); Albany High School (math 74% / reading 67%, grade B+, #710 of 1,100 statewide, top 65%, 2,676 students, 69% FRL).
- Market conditions: Rents rising fast (+5.8%/yr); 5 active listings in the ZIP; 34 comparable units currently listed for rent nearby; rentals at typical pace (median 26d on market — plan ~3-4 weeks tenant-placement turnaround); 675 units permitted in Albany County in 2024 (451 in 5+ unit buildings).
Forward outlook
- In year one you build about $7k of equity ($1k loan paydown + $6k appreciation (3.0% local appreciation)).
- Albany County population projected at +9% by 2050 — modest demand growth; plan on rents tracking national, not racing it.
- At projected returns (3.0% appreciation + 5.8% rent growth), your $56k cash investment doubles in ~5 years — after that, you're playing with house money.
- By year 5, paydown + projected appreciation supports a ~$32k cash-out refi (75% LTV) — recoverable capital for the next deal without selling this one.
Negotiation context
- It's been on market 130 days — a 12% lower offer ($175k) is reasonable based on typical stale-listing flexibility.
- 4 sale attempts since 26y ago; this cycle's ask has dropped $50k (20%) from the opening price — seller is motivated, your offer sets the floor, not the list.
- Current owner paid $112k; list at $199k implies a 78% gain — meaningful room to come down on a strong offer.
Risks & watch-outs
- Watch-outs: property tax is 2.5% of price; built in 1857 — expect roof / HVAC / electrical / plumbing capex.
Questions for the listing agent
- It's been on market 130 days. Have you received any prior offers? Is the seller open to a 12% concession, seller financing, or rate buy-down credit?
- Built in 1857 — when were the roof, HVAC, electrical panel, plumbing, and water heater last replaced?
- Property tax is high relative to price — has the assessment been appealed recently, and will the sale trigger a re-assessment?
- Why hasn't it sold? Are there any deal-killer items the seller is aware of (foundation, flood, title, zoning, code violations)?
- Is there a deadline driving the sale (1031 exchange, divorce, estate, relocation)? That informs how much negotiation room exists.
- Crime grade is F in this area — have there been break-ins, vandalism, or insurance claims at this property in the last 3 years? What carrier currently insures it and at what premium?
- What's the average days-on-market for RENTAL listings here right now (not sales)? A rising rental-DOM trend means longer vacancies and softer asking-rent achievability than the comps imply.
- What's the recent tenant-quality profile in this submarket — average credit score on applications, eviction rate, late-payment / NSF rate, and stable-employment percentage? A property-management company in the area should have these aggregated.
- How much new for-sale + rental construction is in the pipeline within 1–3 miles? Heavy new supply typically softens prices + rents 12–24 months out; constrained supply supports both.
Investment metrics
- 1% rule
- 1.04% ✓
- Cap rate
- 6.88%
- Cash-on-cash
- 2.11%
- DSCR
- 1.09
- GRM
- 8.0
CMA / ARV
- ARV (on-the-fly)
- $358,020
- Comps found
- 3
Show comp detail 3 sales within ~0.75 mi
| Address | Dist | Beds/Ba | Sqft | Sold | Price | $/sf | Match |
|---|---|---|---|---|---|---|---|
| 17 Chapel St #303 | 0.32mi | 2/2.0 (-1) | 1,455 (-5%) | 3mo | $340,000 | $234 | 65 |
| 17 Chapel St #703 | 0.32mi | 2/2.0 (-1) | 1,590 (+4%) | 15mo | $535,000 | $336 | 56 |
| 513 Lark Dr | 0.42mi | 3/1.5 | 1,312 (-14%) | 21mo | $120,000 | $91 | 38 |
Match score weights: distance 35% · size 25% · config 20% · recency 20%. Top-matched comps best support the ARV.
Projected returns pro-forma
3.0% appreciation · 5.83% rent growth · sell at horizon
- IRR
- 11.2%
- Equity multiple
- 1.65×
- Total profit
- $36,419
- Equity at exit
- $89,479
- IRR
- 15.0%
- Equity multiple
- 3.36×
- Total profit
- $131,232
- Equity at exit
- $137,898
Cash invested: $55,720 (down + closing). Projections, not guarantees.
Landlord ↔ Tenant lean methodology
- Overall (STATE)
- 15 Strongly Tenant-Friendly
- State New York
- 15 Strongly Tenant-Friendly · D+10
- County
- — inherits STATE
- City
- — inherits STATE
ZIP-level market 12207
- Rents YoY
- 5.8%
- Active inventory
- 5
- Price-to-rent
- 8.0×
Monthly cashflow live
- Estimated rent
- $2,078 high interval (Pro) →
- Mortgage (P&I)
- −$1,044
- Tax from tax record
- −$417 /mo · $5,004/yr
- Insurance
- −$83
- HOA
- −$0
- Vacancy / Maint / Mgmt
- −$436
- Net cashflow
- $98
Break-even live
Sensitivity live
| Price | -10% $210 | -5% $154 | +0% $98 | +5% $41 | +10% $-15 |
|---|---|---|---|---|---|
| Rent | -10% $-66 | -5% $16 | +0% $98 | +5% $180 | +10% $262 |
| Rate | -1.0pp $198 | -0.5pp $148 | base $98 | +0.5pp $46 | +1.0pp $-6 |
UW: 25.0% down · 7.5% · 30yr · 1.5% tax · 5.0% vac · 8.0% maint · 8.0% mgmt
Financing live
Cash to close
- Down payment
- $49,750
- Closing costs
- $5,970
- Reserves months
- —
- Total cash needed
- —
Loan-product check · same deal, 3 products live
Conventional
25% down · 7.5% · 30yr
- Down + closing
- —
- Monthly P&I
- —
- Monthly cashflow
- —
- DSCR
- —
- Eligible?
- —
Personal DTI + credit; lowest rate.
DSCR
20% down · 8.5% · 30yr
- Down + closing
- —
- Monthly P&I
- —
- Monthly cashflow
- —
- DSCR
- —
- Eligible?
- —
No personal income docs; deal must DSCR.
Hard money
10% down · 12.0% · 12mo
- Down + closing
- —
- Monthly P&I
- —
- Monthly cashflow
- —
- DSCR
- —
- Eligible?
- —
Short-term bridge; refi at stabilization.
Rent comps 34 comps
| Address | Beds | Baths | Sqft | Rent | $/sqft | DOM | Units | Dist |
|---|---|---|---|---|---|---|---|---|
| 32 1st St Albany, NY | 4.0 | 1.5 | 1773 | $1,850 | $1.04 | 45d | 1 | 0.21mi |
| 15 Ten Broeck St Albany, NY | 2.0 | 1.5 | 1900 | $1,750 | $0.92 | 23d | 1 | 0.24mi |
| 883 Broadway Apt 103 Albany, NY | 2.0 | 1.0 | 1155 | $1,785 | $1.55 | 25d | 1 | 0.28mi |
| 282 Livingston Ave Albany, NY | 3.0 | 1.5 | 1464 | $2,400 | $1.64 | 25d | 1 | 0.51mi |
| 48 N Pearl St Albany, NY | 2.0 | 1.0–2.5 | 1251 | $3,500 | $2.80 | 16d | 17 | 0.53mi |
| 240 Washington Ave Albany, NY | 2.0 | 2.0 | 1560 | $2,450 | $1.57 | 45d | 1 | 0.76mi |
| 154 Lancaster St Unit 1 Albany, NY | 2.0 | 1.5 | 1500 | $2,200 | $1.47 | 25d | 1 | 0.77mi |
| 352 State St Albany, NY | 2.0 | 2.0 | 1143 | $2,500 | $2.19 | 25d | 1 | 0.78mi |
| 227 Jay St Albany, NY | 2.0 | 2.0 | 1710 | $2,150 | $1.26 | 45d | 1 | 0.85mi |
| 1556 1st St Rensselaer, NY | 2.0 | 1.0 | 2178 | $1,600 | $0.73 | 16d | 1 | 0.87mi |
| 945 Broadway Rensselaer, NY | 3.0 | 1.0 | 1200 | $1,650 | $1.38 | 25d | 1 | 0.93mi |
| 346 Madison Ave Albany, NY | 3.0 | 2.0 | 1500 | $2,495 | $1.66 | 25d | 1 | 0.95mi |
| 346 Madison Ave Unit 3 Albany, NY | 3.0 | 2.0 | 1110 | $2,725 | $2.45 | 45d | 1 | 0.95mi |
| 164 Madison Ave Albany, NY | 2.0 | 1.0 | 1200 | $1,500 | $1.25 | 45d | 1 | 0.95mi |
| 364 Madison Ave Albany, NY | 2.0 | 2.0 | 1150 | $1,850 | $1.61 | 23d | 1 | 0.96mi |
| 292 Lark St Albany, NY | 2.0 | 1.0 | 1100 | $1,500 | $1.36 | 45d | 1 | 0.97mi |
| 99 New Broadway Rensselaer, NY | 2.0 | 1.0–2.0 | 946 | $2,495 | $2.64 | 16d | 5 | 0.98mi |
| 409 Madison Ave Albany, NY | 2.0 | 2.0 | 1050 | $2,094 | $1.99 | 25d | 1 | 0.98mi |
| 88 Willett St Albany, NY | 3.0 | 1.0 | 825 | $2,080 | $2.52 | 16d | 10 | 0.99mi |
| 25 Harrison Ave Rensselaer, NY | 2.0 | 1.0 | 1400 | $1,745 | $1.25 | 21d | 1 | 1.04mi |
| 100 New Broadway Rensselaer, NY | 2.0 | 2.0 | 1248 | $2,212 | $1.77 | 16d | 2 | 1.04mi |
| 25 Bleecker Pl #1 Albany, NY | 2.0 | 1.0 | 1150 | $1,350 | $1.17 | 46d | 1 | 1.05mi |
| 119 Grand St Albany, NY | 3.0 | 1.0 | 1600 | $1,300 | $0.81 | 45d | 1 | 1.07mi |
| 201 Park Ave Unit 10 Albany, NY | 3.0 | 2.0 | 1600 | $2,100 | $1.31 | 45d | 1 | 1.12mi |
| 520 Madison Ave Unit 1 Albany, NY | 3.0 | 1.0 | 1080 | $1,700 | $1.57 | 45d | 1 | 1.12mi |
| 624 N Pearl St Unit 1st floor Albany, NY | 4.0 | 2.0 | 1800 | $1,950 | $1.08 | 16d | 1 | 1.22mi |
| 628 N Pearl St Menands, NY | 3.0 | 1.0 | 1088 | $1,500 | $1.38 | 45d | 1 | 1.23mi |
| 147 Western Ave Albany, NY | 3.0 | 1.0 | 1428 | $1,800 | $1.26 | 16d | 1 | 1.25mi |
| 178 Western Ave Unit 3 Albany, NY | 3.0 | 1.0 | 1500 | $1,725 | $1.15 | 16d | 1 | 1.33mi |
| 58 Elberon Pl Apt 2 Albany, NY | 4.0 | 1.0 | 1250 | $2,200 | $1.76 | 45d | 1 | 1.41mi |
| 223 Western Ave #1 Albany, NY | 3.0 | 1.0 | 1100 | $1,750 | $1.59 | 25d | 1 | 1.42mi |
| 433 Hamilton St Unit 1 Albany, NY | 4.0 | 1.0 | 1200 | $2,300 | $1.92 | 16d | 1 | 1.43mi |
| 188 Spring St Unit 2 Albany, NY | 2.0 | 1.0 | 1200 | $1,475 | $1.23 | 45d | 1 | 1.44mi |
| 437 Hamilton St Unit 2 Albany, NY | 4.0 | 1.0 | 1200 | $2,300 | $1.92 | 16d | 1 | 1.44mi |
Listing history 20 events
-
2026-03-20status Pending
-
2026-03-04price $199,000
-
2026-02-20price $214,000
-
2026-02-04price $219,000
-
2026-01-28price $224,000
-
2026-01-22price $229,000
-
2026-01-14price $231,500
-
2026-01-07price $234,000
-
2025-12-03price $239,000
-
2025-11-10$249,000 Active
-
2016-05-20historical
-
2016-02-08$139,000 New
-
2008-06-27soldstatus $112,000
-
2008-06-13soldstatus $112,000 241-char remark
Show marketing remark (241 chars)
Beautiful single family townhome with 3 floors of living space. Freshly painted, some updates. Very cute back yard patio with raised beds. Large living/family room. Why rent when you can own a piece of historical Albany. Excellent Condition
-
2008-04-14historical 241-char remark
Show marketing remark (241 chars)
Beautiful single family townhome with 3 floors of living space. Freshly painted, some updates. Very cute back yard patio with raised beds. Large living/family room. Why rent when you can own a piece of historical Albany. Excellent Condition
-
2007-10-29$125,000 241-char remark
Show marketing remark (241 chars)
Beautiful single family townhome with 3 floors of living space. Freshly painted, some updates. Very cute back yard patio with raised beds. Large living/family room. Why rent when you can own a piece of historical Albany. Excellent Condition
-
2007-02-07soldstatus $103,000
-
2001-06-19soldstatus $10,000
-
2001-02-22historical
-
2000-01-18$15,900
ⓘ Source: listings_history table (triggers on properties + properties_extension) + one-shot
backfill from property_details.listing_events for pre-trigger history.
Tax reassessment forecast NY · Partial reset (capped growth)
- Current annual tax
- $5,004 · $417/mo
- Projected year-2 tax
- $5,004 · $417/mo
- Expected delta
- $0/yr ($0/mo · 0.0%)
ⓘ Screening estimate from a state-policy table — verify with the county assessor before closing.
Climate risk First Street
- Flood 1/10 Low FEMA zone X (unshaded) · 0% chance over 30 yrs
- Wildfire 3/10 Moderate
- Heat 4/10 Moderate 7 d/yr ≥97°F today · 17 d/yr by 30 yrs out
- Wind 3/10 Moderate 6% chance of damaging wind over 30 yrs
- Air quality 2/10 Low 0 unhealthy d/yr today · 1 by 30 yrs out
Nearby sold comps map
Loading sold comps map…
Walkable amenities ~0.75 mi
Loading nearby amenities…
Taxation est. · year 1
- Rental income
- $24,931
- − Mortgage interest
- −$11,147
- − Property taxes
- −$5,004
- − Insurance
- −$995
- − Repairs & maintenance
- −$1,994
- − Management
- −$1,994
- − Depreciation
- −$5,789
- Taxable loss
- −$1,993
- Est. tax savings @ 24.0%
- +$478
- After-tax cash flow
- $1,652/yr
For passive investors: Depreciation is non-cash, so a rental often shows a tax loss while cash-flowing — sheltering income. Rental losses are passive: they offset passive income freely, and up to $25,000/yr can offset ordinary (W-2) income if you actively participate and your MAGI is under $100k (phasing out to $0 by $150k); unused losses carry forward. On sale, claimed depreciation is recaptured at up to 25%, and gains may owe capital-gains tax (a 1031 exchange can defer both). Figures are a year-1 estimate at your 24.0% rate — not tax advice; consult a CPA.
Schools (NCES district)
- District
- Albany City School District
- NCES district ID
- 3602460
- Math proficiency
- 37% ▲ 6.00%
- Reading proficiency
- 40% ▲ 7.00%
- Median HH income
- $40,568
- Composite
- 32.34/100
- National rank
- #5744
- State rank
- #543 of 590 in NY
Livability — Albany
- Score
- 79/100
- State rank
- #129
- US rank
- #2083
Category grades
Schools grade is shown separately in the Schools card above.
Census & demographics
- Census place
- Albany, NY
- County
- Albany County · 196,626 people
- City population
- 116,921
- Metro
- Albany-Schenectady-Troy, NY
- Population (ZIP)
- 1,988
- Household income
- $58,998
- Rent vs Own
- Severe rent burden
- 182.0
Population outlook (Albany County) Hauer SSP2
- Today (2025)
- 320,794 people
- By 2030
- 327,401 · +2.1%
- By 2040
- 338,218 · +5.4%
- By 2050
- 348,467 · +8.6%
- By 2075
- 381,693 · +19.0%
- By 2100
- 393,809 · +22.8%
Race, ethnicity, and origin ACS 2023
- Neighborhood character
- Diverse neighborhood (Simpson 0.62)
- Race & ethnicity
- White 44% Black 43% Hispanic / Latino 7% Asian 3% Two or more races 3%
- Hispanic origin (detail)
- Mexican 2% Cuban 2% Dominican 2%
- Common ancestry
- Romanian 4% Serbian 1% Lithuanian 1%
- Foreign-born
- 6% · Canada, China
- Languages at home
- 85% English-only · Spanish 10% Korean 2% French/Haitian/Cajun 2%
Political lean MEDSL · Albany
- 2024 margin
- Strong D (+25.8) · D 62.9% · R 37.1%
- 2008→2024 swing
- -3.6pp toward R · 2008: 29.4pp · 2024: 25.8pp
- All cycles
- 2024: D+25.8 2020: D+31.4 2016: D+24.3 2012: D+31.0 2008: D+29.4
Not yet ingested
- Civics
- —
Market trends
- HPI YoY
- —
- Current HPI
- —
- Rent YoY
- ▲ 5.83%
- Metro
- Albany-Schenectady-Troy, NY
- State GDP YoY
- ▲ 2.60%
- F500 in state
- 92
Industry mix (Fortune 500 HQ in NY)
| Industry | F500 HQs | Revenue |
|---|---|---|
| Financial Services | 10 | $950B |
|
||
| Consumer Goods | 9 | $162B |
|
||
| Insurance | 4 | $225B |
|
||
| Telecommunications | 2 | $144B |
|
||
| Pharmaceuticals | 2 | $112B |
|
||
| Media / Entertainment | 2 | $69B |
|
||
Price history
+1151.6% since first listed20 events — show timeline
- 2026-03-20 Pending — Global MLS
- 2026-03-04 Price Changed $199,000 Global MLS
- 2026-02-20 Price Changed $214,000 Global MLS
- 2026-02-04 Price Changed $219,000 Global MLS
- 2026-01-28 Price Changed $224,000 Global MLS
- 2026-01-22 Price Changed $229,000 Global MLS
- 2026-01-14 Price Changed $231,500 Global MLS
- 2026-01-07 Price Changed $234,000 Global MLS
- 2025-12-03 Price Changed $239,000 Global MLS
- 2025-11-10 Listed $249,000 Global MLS
- 2016-05-20 Listing Removed — Global MLS
- 2016-02-08 Listed $139,000 Global MLS
- 2008-06-27 Sold (Public Records) $112,000 Public Records
- 2008-06-13 Sold (MLS) $112,000 Global MLS
- 2008-04-14 Listing Removed — Global MLS
- 2007-10-29 Listed $125,000 Global MLS
- 2007-02-07 Sold (Public Records) $103,000 Public Records
- 2001-06-19 Sold (MLS) $10,000 Global MLS
- 2001-02-22 Listing Removed — Global MLS
- 2000-01-18 Listed $15,900 Global MLS
Property tax history
+6.5%/yrLatest (2025): $5,004 · -4.5% YoY. Source: county tax records.
Cash-flow waterfall
monthlySold comps — $/sqft
last 12 mo · ≤1 miLoading sold comps…