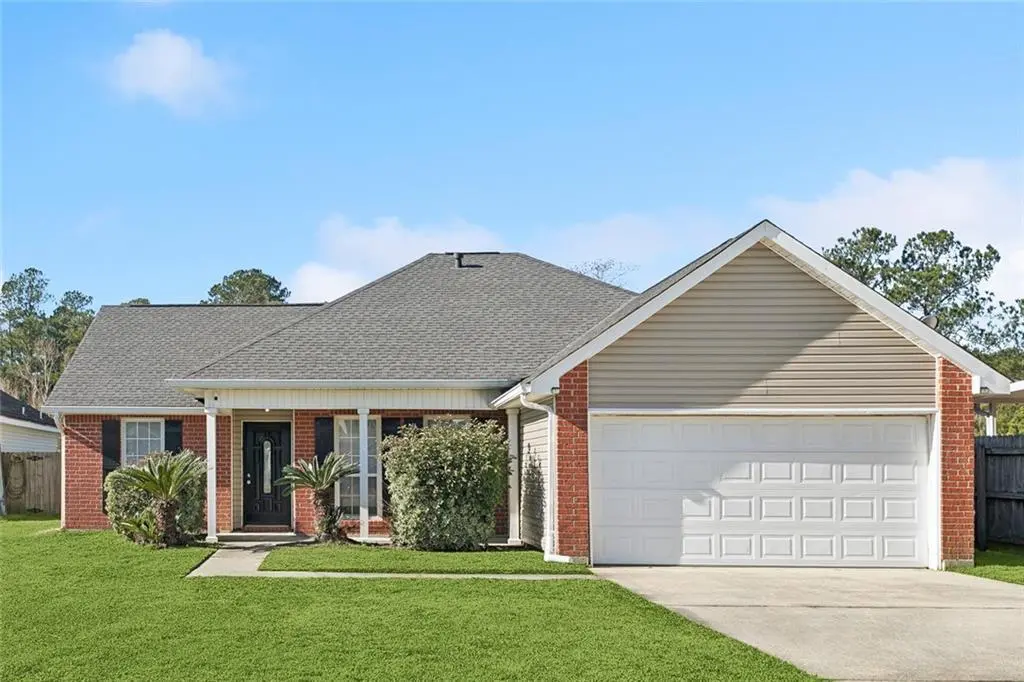
1015 Mccartney Ct · Slidell, LA
Flood risk 8/10 · Major
- FEMA flood zone
- X (shaded)
- Chance of flooding over 30 yrs
- 0.76%
- Est. flood insurance / yr
- $507 – $1,088
Fire risk 5/10 · Moderate
- Est. fire insurance / yr
- $1,269 – $2,357
Heat risk 10/10 · Severe
- Hot days now (above 108°F)
- 7 days/yr
- Hot days in 30 yrs
- 21 days/yr
Wind risk 10/10 · Severe
- Chance of severe wind over 30 yrs
- 99.0%
Air-quality risk 1/10 · Minimal
- Unhealthy air days now
- 0 days/yr
- Unhealthy air days in 30 yrs
- 0 days/yr
Risk factors via First Street. Map © Google.
Why this score? — see what drove the D+ grade
The composite is a weighted blend of 9 inputs, each scored 0–100. Each bar is that input's sub-score; the figure is the points it added to the 100-point composite (weight × sub-score).
- Cash flow +13.4/30.0
- ARV discount +11.4/15.0
- Schools +4.3/10.0
- DSCR +4.0/10.0
- Livability +3.5/5.0
- 1% rule +3.0/10.0
- Rent growth +2.9/5.0
- Condition / age +2.5/5.0
- Appreciation +0.0/10.0
$249,500
🖨 Deal sheet (PDF) 📄 Offer letter ✓ Due diligence
Listing remarks MLS
Spacious Home located on a quiet Cul De Sac in SpringHill. Huge Living Area with High Ceilings, New LVP Wood Floors and Fireplace. Kitchen features Granite Counters, Lots of Cabinets and a Connecting Dining Area. Oversized Primary Bedroom with Private Bath with Separate Shower and Garden Tub. Two Guest Bedrooms with ample closet space. Sunroom, Fenced Yard overlooking Pond. 2 Car Garage. Roof '23, Fence '23, AC '25, Luxury Vinyl Plank, Fan and Paint in all Bedrooms '25. Easy commute into New Orleans or Mississippi.
Key facts
- Fenced yard
- Cul de sac
- Luxury vinyl plank
Tags
Neighborhood map
What this means for you Summary
Snapshot
- This is a 4-bed/2.0-bath single-family listed at $250k.
Deal economics
- At list price, monthly cash flow is $-62 ($-745/yr) — negative.
- To cash-flow at today's rent, offer at most $239k (4.4% below list).
- To meet the 1% rule (rent ≥ 1% of price), the offer needs to be $199k (20.3% below list).
- Recommended offer: $199k (20.3% below list) — sets the bar for 1% rule.
Location & tenants
- Location reads 70/100 on livability (#57 in LA) — a middle-class / working-renter tenant base. Strengths: cost of living A+, housing A+, health & safety A+; Watch: amenities F, commute F.
- St. Tammany Parish (suburban): math 43% / reading 55% proficiency, ranked #11 of 98 in LA (top 11%) — families likely to look elsewhere, expect single-tenant / working-renter base with shorter leases.
- Zoned schools: W.L. Abney Elementary School (math 31% / reading 38%, grade F, #284 of 646 statewide, top 46%, 1,094 students, 70% FRL); St. Tammany Junior High School (math 19% / reading 41%, grade F, #114 of 218 statewide, top 53%, 793 students, 68% FRL); Salmen High School (math 15% / reading 27%, grade F, #179 of 265 statewide, top 68%, 1,216 students, 62% FRL) — zoned schools average 67% FRL vs 40% district-wide (27 pts higher); higher-poverty schools than district average — tighter screening recommended.
- Zoned-school proficiency averages 28% at this address vs 49% district-wide (-20 pts) — the specific schools serving this property underperform the St. Tammany Parish average; the district grade overstates school quality for this exact location.
- Market conditions: Rents rising (+1.7%/yr); 594 active listings in the ZIP; 13 comparable units currently listed for rent nearby; rentals at typical pace (median 26d on market — plan ~3-4 weeks tenant-placement turnaround); 46% of comp listings sitting > 30 days — soft ceiling on asking rent; solid renter incomes; 1,064 units permitted in St. Tammany Parish in 2024 (0 in 5+ unit buildings).
Forward outlook
- Local home prices are declining (-3.0%/yr); year-one equity from $2k of loan paydown is wiped out by about $7k of value loss. Plan a longer hold.
- St. Tammany County population projected at +27% by 2050 — long-run rental-demand tailwind backs the buy-and-hold thesis.
Negotiation context
- It's been on market 112 days — a 9% lower offer ($227k) is reasonable based on typical stale-listing flexibility.
- 4 sale attempts since 22y ago with the ask held roughly flat each time — persistent listings suggest the price (not the market) is what's stuck; bring a comps-based counter.
- Current owner paid $160k; list at $250k implies a 56% gain — meaningful room to come down on a strong offer.
Risks & watch-outs
- Watch-outs: flood insurance adds $66/mo.
- Climate carrying-cost: severe flood risk; severe wind risk, 99% chance of damaging wind over 30y; moderate wildfire risk; extreme-heat days projected 7→21/yr by 2055 (HVAC capex compounding) — expect insurance premiums to compound above CPI over the hold.
Questions for the listing agent
- What do current leases actually rent for vs. the listed asking? Can we see a recent rent roll and the last 12 months of T-12 income?
- It's been on market 112 days. Have you received any prior offers? Is the seller open to a 20% concession, seller financing, or rate buy-down credit?
- What's the actual annual flood-insurance premium (NFIP or private), and is the property in a SFHA with mandatory coverage?
- Why hasn't it sold? Are there any deal-killer items the seller is aware of (foundation, flood, title, zoning, code violations)?
- Is there a deadline driving the sale (1031 exchange, divorce, estate, relocation)? That informs how much negotiation room exists.
- Schools are B-rated — typically a magnet for longer-tenancy family renters. What's the average tenant stay here, and is there a school-zone premium baked into asking?
- The area grade is low — what's the realistic commute time and amenity access for the typical tenant pool here? Any planned neighborhood developments (good or bad) we should know about?
- What's the average days-on-market for RENTAL listings here right now (not sales)? A rising rental-DOM trend means longer vacancies and softer asking-rent achievability than the comps imply.
- What's the recent tenant-quality profile in this submarket — average credit score on applications, eviction rate, late-payment / NSF rate, and stable-employment percentage? A property-management company in the area should have these aggregated.
- How much new for-sale + rental construction is in the pipeline within 1–3 miles? Heavy new supply typically softens prices + rents 12–24 months out; constrained supply supports both.
Investment metrics
- 1% rule
- 0.80% ✗
- Cap rate
- 6.31%
- Cash-on-cash
- 0.08%
- DSCR
- 1.00
- GRM
- 10.5
CMA / ARV
- ARV (median comp)
- $273,436
- List price
- $249,500
- Delta
- -8.75%
- Verdict
- FAIR
- Comps
- 20 within 1.0 mi
Show comp detail 12 sales within ~0.75 mi
| Address | Dist | Beds/Ba | Sqft | Sold | Price | $/sf | Match |
|---|---|---|---|---|---|---|---|
| 1016 Mccartney Ct | 0.04mi | 4/2.5 | 2,055 (+6%) | 13mo | $237,000 | $115 | 76 |
| 1008 Lennon Ct | 0.14mi | 4/2.0 | 2,155 (+11%) | 1mo | $271,000 | $126 | 75 |
| 2042 Heather Ln | 0.22mi | 4/2.5 | 2,065 (+6%) | 6mo | $215,000 | $104 | 73 |
| 1940 Brookter St | 0.12mi | 4/2.5 | 2,065 (+6%) | 14mo | $205,000 | $99 | 71 |
| 2032 Dylan Dr | 0.16mi | 3/2.0 (-1) | 2,105 (+8%) | 7mo | $265,000 | $126 | 68 |
| 1820 Kings Row | 0.46mi | 4/3.0 | 1,845 (-5%) | 1mo | $245,000 | $133 | 65 |
| 1702 Barrymore St | 0.62mi | 4/2.0 | 1,947 (-0%) | 9mo | $183,500 | $94 | 64 |
| 1638 Barrymore St | 0.67mi | 4/2.0 | 1,947 (-0%) | 9mo | $175,000 | $90 | 61 |
| 1805 Barrymore St | 0.47mi | 3/2.5 (-1) | 2,055 (+6%) | 8mo | $250,000 | $122 | 55 |
| 1628 Ellingsworth Dr | 0.51mi | 3/2.0 (-1) | 1,796 (-8%) | 9mo | $167,000 | $93 | 50 |
| 1900 Kings Row St | 0.37mi | 4/2.0 | 1,703 (-13%) | 15mo | $115,000 | $68 | 50 |
| 1658 Shylock | 0.63mi | 3/2.5 (-1) | 2,055 (+6%) | 9mo | $310,000 | $151 | 47 |
Match score weights: distance 35% · size 25% · config 20% · recency 20%. Top-matched comps best support the ARV.
Projected returns pro-forma
-3.0% appreciation · 1.72% rent growth · sell at horizon
- IRR
- -19.4%
- Equity multiple
- 0.33×
- Total profit
- $-46,936
- Equity at exit
- $37,201
- IRR
- -14.9%
- Equity multiple
- 0.20×
- Total profit
- $-56,177
- Equity at exit
- $21,572
Cash invested: $69,860 (down + closing). Projections, not guarantees.
Landlord ↔ Tenant lean methodology
- Overall (STATE)
- 90 Strongly Landlord-Friendly
- State Louisiana
- 90 Strongly Landlord-Friendly · R+12
- County
- — inherits STATE
- City
- — inherits STATE
ZIP-level market 70461
- Home prices YoY
- -33.0%
- Rents YoY
- 1.7%
- Active inventory
- 594
- Price-to-rent
- 10.5×
Monthly cashflow live
- Estimated rent
- $1,988 high interval (Pro) →
- Mortgage (P&I)
- −$1,308
- Tax from tax record
- −$154 /mo · $1,846/yr
- Insurance
- −$104
- Flood insurance flood zone
- −$66 /mo · $798/yr
- HOA
- −$0
- Vacancy / Maint / Mgmt
- −$418
- Net cashflow
- $-62
Break-even live
Sensitivity live
| Price | -10% $79 | -5% $9 | +0% $-62 | +5% $-133 | +10% $-203 |
|---|---|---|---|---|---|
| Rent | -10% $-219 | -5% $-141 | +0% $-62 | +5% $16 | +10% $95 |
| Rate | -1.0pp $64 | -0.5pp $1 | base $-62 | +0.5pp $-127 | +1.0pp $-192 |
UW: 25.0% down · 7.5% · 30yr · 1.5% tax · 5.0% vac · 8.0% maint · 8.0% mgmt
Financing live
Cash to close
- Down payment
- $62,375
- Closing costs
- $7,485
- Reserves months
- —
- Total cash needed
- —
Loan-product check · same deal, 3 products live
Conventional
25% down · 7.5% · 30yr
- Down + closing
- —
- Monthly P&I
- —
- Monthly cashflow
- —
- DSCR
- —
- Eligible?
- —
Personal DTI + credit; lowest rate.
DSCR
20% down · 8.5% · 30yr
- Down + closing
- —
- Monthly P&I
- —
- Monthly cashflow
- —
- DSCR
- —
- Eligible?
- —
No personal income docs; deal must DSCR.
Hard money
10% down · 12.0% · 12mo
- Down + closing
- —
- Monthly P&I
- —
- Monthly cashflow
- —
- DSCR
- —
- Eligible?
- —
Short-term bridge; refi at stabilization.
Rent comps 13 comps
| Address | Beds | Baths | Sqft | Rent | $/sqft | DOM | Units | Dist |
|---|---|---|---|---|---|---|---|---|
| 2012 Dylan Dr Slidell, LA | 3.0 | 2.0 | 1700 | $1,950 | $1.15 | 25d | 1 | 0.20mi |
| 1000 Clairise Ct Slidell, LA | 3.0 | 2.0 | 1319 | $1,900 | $1.44 | 45d | 1 | 0.38mi |
| 1918 Hempstead Dr Unit NA Slidell, LA | 4.0 | 2.0 | 1615 | $1,750 | $1.08 | 25d | 1 | 0.48mi |
| 1402 Shakespeare Ct Slidell, LA | 4.0 | 2.0 | 1347 | $1,725 | $1.28 | 45d | 1 | 0.68mi |
| 1409 Ellingsworth Dr Slidell, LA | 4.0 | 2.0 | 1950 | $2,000 | $1.03 | 45d | 1 | 0.79mi |
| 310 Foxcroft Dr Slidell, LA | 4.0 | 2.0 | 1535 | $1,950 | $1.27 | 25d | 1 | 0.93mi |
| 39348 Mc Kendall Dr Slidell, LA | 3.0 | 2.5 | 2510 | $2,600 | $1.04 | 3d | 1 | 1.08mi |
| 128 Foxbriar Ct Slidell, LA | 3.0 | 2.0 | 1395 | $1,650 | $1.18 | 45d | 1 | 1.09mi |
| 57346 Maple Ave Slidell, LA | 3.0 | 2.5 | 1550 | $1,500 | $0.97 | 45d | 1 | 1.22mi |
| 577 Panther Dr Slidell, LA | 3.0 | 2.0 | 1483 | $1,850 | $1.25 | 5d | 1 | 1.34mi |
| 1640 Town Center Pkwy Slidell, LA | 3.0 | 1.0–2.0 | 959 | $1,895 | $1.98 | 3d | 46 | 1.35mi |
| 200 Long St Slidell, LA | 2.0–4.0 | 2.0 | 1112 | $1,539 | $1.38 | 3d | 1 | 1.36mi |
| 56418 McManus Rd Slidell, LA | 3.0 | 1.0 | 1650 | $1,200 | $0.73 | 45d | 1 | 1.40mi |
Listing history 6 events
-
2026-01-29$249,500 Active 520-char remark
Show marketing remark (520 chars)
Spacious Home located on a quiet Cul De Sac in SpringHill. Huge Living Area with High Ceilings, New LVP Wood Floors and Fireplace. Kitchen features Granite Counters, Lots of Cabinets and a Connecting Dining Area. Oversized Primary Bedroom with Private Bath with Separate Shower and Garden Tub. Two Guest Bedrooms with ample closet space. Sunroom, Fenced Yard overlooking Pond. 2 Car Garage. Roof '23, Fence '23, AC '25, Luxury Vinyl Plank, Fan and Paint in all Bedrooms '25. Easy commute into New Orleans or Mississippi.
-
2004-06-03soldstatus $160,400
-
2004-05-28soldstatus $160,400
-
2004-02-02$155,230
-
2004-02-02$155,230
ⓘ Source: listings_history table (triggers on properties + properties_extension) + one-shot
backfill from property_details.listing_events for pre-trigger history.
Tax reassessment forecast LA · Resets to sale price
- Current annual tax
- $1,846 · $154/mo
- Projected year-2 tax
- $1,846 · $154/mo
- Expected delta
- $0/yr ($0/mo · 0.0%)
ⓘ Screening estimate from a state-policy table — verify with the county assessor before closing.
Climate risk First Street
- Flood 8/10 Severe FEMA zone X (shaded) · 76% chance over 30 yrs
- Wildfire 5/10 Major
- Heat 10/10 Extreme 7 d/yr ≥108°F today · 21 d/yr by 30 yrs out
- Wind 10/10 Extreme 99% chance of damaging wind over 30 yrs
- Air quality 1/10 Low 0 unhealthy d/yr today · 0 by 30 yrs out
Nearby sold comps map
Loading sold comps map…
Walkable amenities ~0.75 mi
Loading nearby amenities…
Taxation est. · year 1
- Rental income
- $23,858
- − Mortgage interest
- −$13,976
- − Property taxes
- −$1,846
- − Insurance
- −$2,045
- − Repairs & maintenance
- −$1,909
- − Management
- −$1,909
- − Depreciation
- −$7,258
- Taxable loss
- −$5,085
- Est. tax savings @ 24.0%
- +$1,220
- After-tax cash flow
- $476/yr
For passive investors: Depreciation is non-cash, so a rental often shows a tax loss while cash-flowing — sheltering income. Rental losses are passive: they offset passive income freely, and up to $25,000/yr can offset ordinary (W-2) income if you actively participate and your MAGI is under $100k (phasing out to $0 by $150k); unused losses carry forward. On sale, claimed depreciation is recaptured at up to 25%, and gains may owe capital-gains tax (a 1031 exchange can defer both). Figures are a year-1 estimate at your 24.0% rate — not tax advice; consult a CPA.
Schools (NCES district)
- District
- St. Tammany Parish
- NCES district ID
- 2201650
- Math proficiency
- 43% ▼ -32.00%
- Reading proficiency
- 55% ▼ -26.00%
- Median HH income
- $61,752
- Composite
- 43.04/100
- National rank
- #3098
- State rank
- #11 of 98 in LA
Livability — Slidell
- Score
- 70/100
- State rank
- #57
- US rank
- #7673
Category grades
Schools grade is shown separately in the Schools card above.
Census & demographics
- County
- Saint Tammany Parish · 228,296 people
- City population
- 95,511
- Metro
- New Orleans-Metairie, LA
- Population (ZIP)
- 34,808
- Household income
- $89,003
- Rent vs Own
- Severe rent burden
- 328.0
Population outlook (St. Tammany County) Hauer SSP2
- Today (2025)
- 286,725 people
- By 2030
- 304,175 · +6.1%
- By 2040
- 336,203 · +17.3%
- By 2050
- 364,590 · +27.2%
- By 2075
- 433,362 · +51.1%
- By 2100
- 470,333 · +64.0%
Race, ethnicity, and origin ACS 2023
- Neighborhood character
- Diverse neighborhood (Simpson 0.63)
- Race & ethnicity
- White 55% Black 24% Two or more races 14% Hispanic / Latino 11% Asian 3%
- Hispanic origin (detail)
- Common ancestry
- Lithuanian 9% Italian 1% Romanian 1%
- Foreign-born
- 8% · Canada, China, Vietnam
- Languages at home
- 89% English-only · Spanish 7% Chinese 1% Vietnamese 1%
Political lean MEDSL · St. Tammany
- 2024 margin
- Solid R (+43.8) · D 27.3% · R 71.1% · Other 1.6%
- 2008→2024 swing
- +9.6pp toward D · 2008: -53.4pp · 2024: -43.8pp
- All cycles
- 2024: R+43.8 2020: R+44.2 2016: R+50.8 2012: R+52.2 2008: R+53.4
Not yet ingested
- Civics
- —
Market trends
- HPI YoY
- ▼ -74.47%
- Current HPI
- 151.3353
- Rent YoY
- ▲ 1.72%
- Metro
- New Orleans-Metairie, LA
- State GDP YoY
- ▲ 3.29%
- F500 in state
- 10
Industry mix (Fortune 500 HQ in LA)
| Industry | F500 HQs | Revenue |
|---|---|---|
| Telecommunications | 2 | $23B |
|
||
| Utilities | 1 | $12B |
|
||
| Wholesale / Distribution | 1 | $5B |
|
||
| Advertising | 1 | $2B |
|
||
Price history
+60.7% since first listed6 events — show timeline
- 2026-01-29 Listed $249,500 AcadianaMLS
- 2026-01-29 Listed $249,500 GSREIN
- 2004-06-03 Sold (Public Records) $160,400 Public Records
- 2004-05-28 Sold (MLS) $160,400 GSREIN
- 2004-02-02 Listed $155,230 AcadianaMLS
- 2004-02-02 Listed $155,230 GSREIN
Property tax history
-3.4%/yrLatest (2025): $1,846 · -3.4% YoY. Source: county tax records.
Cash-flow waterfall
monthlySold comps — $/sqft
last 12 mo · ≤1 miLoading sold comps…