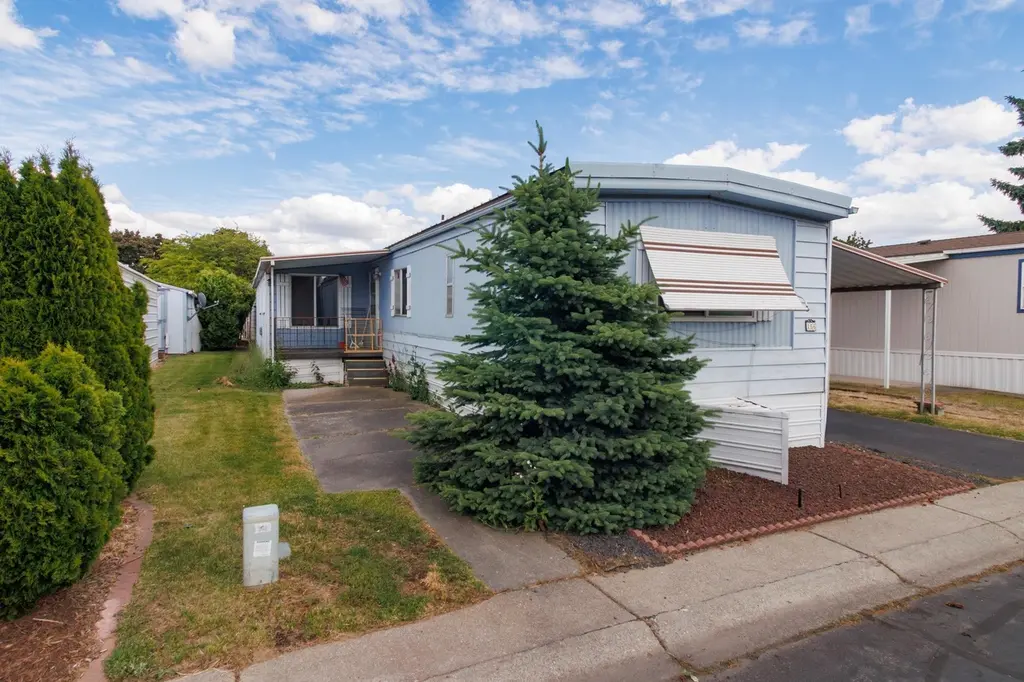
1205 E Lyons Ave Ave #156 · Spokane, WA
Flood risk 1/10 · Minimal
- FEMA flood zone
- X (unshaded)
- Chance of flooding over 30 yrs
- 0.0%
- Est. flood insurance / yr
- $507 – $1,088
Fire risk 1/10 · Minimal
- Est. fire insurance / yr
- $604 – $1,122
Heat risk 3/10 · Minor
- Hot days now (above 94°F)
- 6 days/yr
- Hot days in 30 yrs
- 12 days/yr
Wind risk 1/10 · Minimal
- Chance of severe wind over 30 yrs
- —
Air-quality risk 10/10 · Severe
- Unhealthy air days now
- 19 days/yr
- Unhealthy air days in 30 yrs
- 21 days/yr
Risk factors via First Street. Map © Google.
Why this score? — see what drove the B+ grade
The composite is a weighted blend of 9 inputs, each scored 0–100. Each bar is that input's sub-score; the figure is the points it added to the 100-point composite (weight × sub-score).
- Cash flow +30.0/30.0
- ARV discount +14.7/15.0
- 1% rule +10.0/10.0
- DSCR +10.0/10.0
- Schools +4.6/10.0
- Livability +4.0/5.0
- Rent growth +2.6/5.0
- Condition / age +2.5/5.0
- Appreciation +0.0/10.0
$73,000
🖨 Deal sheet 📄 Offer letter ✓ Due diligence
Listing remarks MLS
This home has 2 bedrooms and 2 full bathrooms as well as a sun room in addition to the family room. The square footage of the home is approximately 1260 ft sq. (taken from County Records). The home has a gas furnace and central A/C. ; it also has 2 large sheds and an attached carport. All appliances will stay. The lot rent includes water, sewer and garbage. Small pets are allowed. Buyer must be approved by the Park Management prior to offer. The home is located in Contempo Manufactured Home Park (a 55+ Park), a well maintained park which has a swimming pool (summer) and a dog walking park and is located close to restaurants, grocery store and Medical Facilities.
Key facts
- Dedicated pet park
- 2 parking spots
- Community pool
Tags
Property features AI
Finance
- Other: Property type: Residential — Manufactured Home; Make/Manufacturer: BNBRG
- Financial info: Monthly land lease: $550
- HOA & community: Senior community; Located in Contempo Comm (park)
Exterior
- Parking: Carport with space for 2 vehicles
- Utilities: Cable available; Internet provider: TDS; High-speed internet: No
- Home design: Manufactured home (manufactured house); Single-story (manufactured); Skirted and tie-down foundation
- Construction: Steel frame construction; Composition roof
- Exterior features: Deck; Level and open lot; City bus service within about 6 blocks; Private, paved road frontage; See remarks for other structures
Interior
- Kitchen: Free-standing range; Dishwasher; Refrigerator
- Bedrooms: 2 bedrooms
- Heating & cooling: Natural gas forced air heating; Central air conditioning
- Interior features: Smart thermostat; Utility room
Neighborhood map
What this means for you Summary
Snapshot
- This is a 3-bed/2.0-bath manufactured listed at $73k.
Deal economics
- At list price, monthly cash flow is $913 ($11k/yr) — positive.
- The deal already cash-flows at list — no discount required.
- Meets the 1% rule at list price ($2k rent vs $73k).
- Cap rate 21.3% vs local median 3.2% in Spokane — top-decile yield for the area; either an underpriced asset or a hidden risk that comps aren't pricing in. Stress-test before assuming the spread holds.
Location & tenants
- Location reads 80/100 on livability (#93 in WA, #1,822 nationally) — a professional / high-income tenant draw. Strengths: amenities A+, commute A+, housing A+; Watch: crime F.
- Spokane School District (urban): math 47% / reading 58% proficiency, ranked #136 of 291 in WA (top 47%) — acceptable for families but not a draw, mixed tenant base, ~2y average lease.
- Zoned schools: Rogers High School (1,536 students, 83% FRL) — zoned schools average 83% FRL vs 50% district-wide (33 pts higher); higher-poverty schools than district average — tighter screening recommended.
- Market conditions: Rents flat; 462 active listings in the ZIP; 16 comparable units currently listed for rent nearby; rentals at typical pace (median 14d on market — plan ~3-4 weeks tenant-placement turnaround); solid renter incomes; 3,608 units permitted in Spokane County in 2024 (1,792 in 5+ unit buildings).
Forward outlook
- Local home prices are declining (-3.0%/yr); year-one equity from $505 of loan paydown is wiped out by about $2k of value loss. Plan a longer hold.
- Spokane County population projected at +13% by 2050 — modest demand growth; plan on rents tracking national, not racing it.
- At projected returns (-3.0% appreciation + 0.5% rent growth), your $20k cash investment doubles in ~3 years — after that, you're playing with house money.
Negotiation context
- Only 13 days on market — expect competitive offers; lowballing is unlikely to land.
- 3 sale attempts since 16y ago; this cycle's ask has dropped $5k (6%) from the opening price — seller is motivated, your offer sets the floor, not the list.
- Current owner paid $60k; 22% above their basis — modest negotiation headroom, anchor on the comps not their cost.
Questions for the listing agent
- Built in 1976 — when were the roof, HVAC, electrical panel, plumbing, and water heater last replaced?
- Is there a deadline driving the sale (1031 exchange, divorce, estate, relocation)? That informs how much negotiation room exists.
- Schools are B-rated — typically a magnet for longer-tenancy family renters. What's the average tenant stay here, and is there a school-zone premium baked into asking?
- Crime grade is F in this area — have there been break-ins, vandalism, or insurance claims at this property in the last 3 years? What carrier currently insures it and at what premium?
- What's the average days-on-market for RENTAL listings here right now (not sales)? A rising rental-DOM trend means longer vacancies and softer asking-rent achievability than the comps imply.
- What's the recent tenant-quality profile in this submarket — average credit score on applications, eviction rate, late-payment / NSF rate, and stable-employment percentage? A property-management company in the area should have these aggregated.
- How much new for-sale + rental construction is in the pipeline within 1–3 miles? Heavy new supply typically softens prices + rents 12–24 months out; constrained supply supports both.
Investment metrics
- 1% rule
- 2.38% ✓
- Cap rate
- 21.31%
- Cash-on-cash
- 53.62%
- DSCR
- 3.39
- GRM
- 3.5
CMA / ARV
- ARV (on-the-fly)
- $86,940
- Comps found
- 9
Show comp detail 9 sales within ~0.75 mi
| Address | Dist | Beds/Ba | Sqft | Sold | Price | $/sf | Match |
|---|---|---|---|---|---|---|---|
| 1211 E Lyons Ave #83 | 0.17mi | 3/2.0 | 1,344 (+7%) | 5mo | $93,000 | $69 | 77 |
| 1205 E Lyons Ave #156 | 0.00mi | 2/2.0 (-1) | 1,260 (0%) | 24mo | $60,000 | $48 | 75 |
| 1205 E Lyons Rd #162 | 0.00mi | 2/1.0 (-1) | 1,124 (-11%) | 3mo | $68,000 | $60 | 71 |
| 1211 E Lyons #62 Ave | 0.15mi | 3/2.0 | 1,400 (+11%) | 6mo | $135,000 | $96 | 69 |
| 1205 E Lyons Ave #8 | 0.00mi | 2/2.0 (-1) | 1,344 (+7%) | 23mo | $140,000 | $104 | 65 |
| 1209 E Lyons Ave #219 | 0.11mi | 2/1.0 (-1) | 1,176 (-7%) | 23mo | $68,900 | $59 | 55 |
| 6805 N Crestline St #32 | 0.64mi | 3/2.0 | 1,248 (-1%) | 19mo | $105,000 | $84 | 52 |
| 1209 E Lyons Ave Unit CONTEMPO MOBILE HOME PARK SPACE 209 | 0.11mi | 2/1.0 (-1) | 1,100 (-13%) | 22mo | $60,000 | $55 | 46 |
| 6632 N Crestline St | 0.72mi | 3/2.0 | 1,386 (+10%) | 11mo | $330,000 | $238 | 40 |
Match score weights: distance 35% · size 25% · config 20% · recency 20%. Top-matched comps best support the ARV.
Projected returns pro-forma
-3.0% appreciation · 0.46% rent growth · sell at horizon
- IRR
- 48.9%
- Equity multiple
- 3.06×
- Total profit
- $42,006
- Equity at exit
- $10,885
- IRR
- 53.4%
- Equity multiple
- 5.63×
- Total profit
- $94,565
- Equity at exit
- $6,312
Cash invested: $20,440 (down + closing). Projections, not guarantees.
Landlord ↔ Tenant lean methodology
- Overall (STATE)
- 28 Tenant-Leaning
- State Washington
- 28 Tenant-Leaning · D+8
- County
- — inherits STATE
- City
- — inherits STATE
ZIP-level market 99208
- Rents YoY
- 0.5%
- Active inventory
- 462
- Price-to-rent
- 3.5×
Monthly cashflow live
- Estimated rent
- $1,741 high interval (Pro) →
- Mortgage (P&I)
- −$383
- Tax from tax record
- −$49 /mo · $584/yr
- Insurance
- −$30
- HOA
- −$0
- Vacancy / Maint / Mgmt
- −$366
- Net cashflow
- $913
Break-even live
UW: 25.0% down · 7.5% · 30yr · 1.5% tax · 5.0% vac · 8.0% maint · 8.0% mgmt
Financing live
Cash to close
- Down payment
- $18,250
- Closing costs
- $2,190
- Reserves months
- —
- Total cash needed
- —
Loan-product check · same deal, 3 products live
Conventional
25% down · 7.5% · 30yr
- Down + closing
- —
- Monthly P&I
- —
- Monthly cashflow
- —
- DSCR
- —
- Eligible?
- —
Personal DTI + credit; lowest rate.
DSCR
20% down · 8.5% · 30yr
- Down + closing
- —
- Monthly P&I
- —
- Monthly cashflow
- —
- DSCR
- —
- Eligible?
- —
No personal income docs; deal must DSCR.
Hard money
10% down · 12.0% · 12mo
- Down + closing
- —
- Monthly P&I
- —
- Monthly cashflow
- —
- DSCR
- —
- Eligible?
- —
Short-term bridge; refi at stabilization.
Rent comps 16 comps
| Address | Beds | Baths | Sqft | Rent | $/sqft | DOM | Units | Dist |
|---|---|---|---|---|---|---|---|---|
| 1015 E Cozza Dr Unit 14 Spokane, WA | 2.0 | 1.0 | 902 | $1,110 | $1.23 | 23d | 1 | 0.17mi |
| 910 E Holyoke Ave Spokane, WA | 1.0–2.0 | 1.0 | 755 | $1,425 | $1.89 | 14d | 4 | 0.29mi |
| 723 E Sitka Spokane, WA | 2.0 | 2.0 | 1400 | $1,875 | $1.34 | 14d | 1 | 0.30mi |
| 6903 N Cincinnati St Spokane, WA | 3.0 | 2.0 | 1600 | $2,100 | $1.31 | 23d | 1 | 0.32mi |
| 1011 E Sharpsburg Ave Unit 494 Spokane, WA | 2.0 | 1.0 | 902 | $1,150 | $1.27 | 23d | 1 | 0.37mi |
| 1517 E Calkins Ave Spokane, WA | 4.0 | 2.0 | 1753 | $2,200 | $1.25 | 14d | 1 | 0.54mi |
| 7024 N Colton St Spokane, WA | 2.0 | 2.0 | 1082 | $1,385 | $1.28 | 14d | 1 | 0.61mi |
| 1718 E Lincoln Rd Spokane, WA | 1.0–2.0 | 1.0–2.0 | 975 | $1,795 | $1.84 | 13d | 10 | 0.62mi |
| 121 E Wedgewood Ave Spokane, WA | 1.0–3.0 | 1.0–1.5 | 833 | $1,405 | $1.69 | 14d | 17 | 0.64mi |
| 510 E Dalke Ave Spokane, WA | 2.0 | 1.0 | 1500 | $1,595 | $1.06 | 21d | 1 | 0.71mi |
| 6203 N Astor St Spokane, WA | 2.0 | 1.0 | 1100 | $1,400 | $1.27 | 14d | 1 | 0.72mi |
| 6203 N Astor St Unit 2 Spokane, WA | 2.0 | 1.5 | 1100 | $1,400 | $1.27 | 21d | 1 | 0.72mi |
| 636 E Magnesium Rd Spokane, WA | 1.0–3.0 | 1.0–3.0 | 1053 | $2,325 | $2.21 | 14d | 12 | 1.06mi |
| 2420 E Joseph Ave Spokane, WA | 3.0 | 2.5 | 1268 | $1,900 | $1.50 | 23d | 1 | 1.20mi |
| 849 E Magnesium Rd Spokane, WA | 1.0–3.0 | 1.0–2.0 | 931 | $1,725 | $1.85 | 13d | 6 | 1.26mi |
| 8719 N Hill N Dale St Spokane, WA | 1.0–3.0 | 1.0–1.5 | 850 | $1,559 | $1.83 | 14d | 8 | 1.29mi |
Listing history 10 events
-
2026-06-18days on market $73,000 Active 13 DOM
-
2026-06-17days on market $73,000 Active 12 DOM
-
2026-06-16days on market $73,000 Active 11 DOM
-
2026-06-15days on market $73,000 Active 10 DOM
-
2026-06-14pricedays on market $73,000 Active 8 DOM
-
2026-06-10days on market $78,000 Active 5 DOM
-
2026-06-09days on market $78,000 Active 4 DOM
-
2026-06-08days on market $78,000 Active 3 DOM
-
2026-06-07remarks 683-char remark
-
2026-06-07$78,000 Active 2 DOM
ⓘ Source: listings_history table (triggers on properties + properties_extension) + one-shot
backfill from property_details.listing_events for pre-trigger history.
Tax reassessment forecast WA · Resets to sale price
- Current annual tax
- $584 · $49/mo
- Projected year-2 tax
- $715 · $60/mo
- Expected delta
- +$131/yr (+$11/mo · 22.4%)
ⓘ Screening estimate from a state-policy table — verify with the county assessor before closing.
Climate risk First Street
- Flood 1/10 Low FEMA zone X (unshaded) · 0% chance over 30 yrs
- Wildfire 1/10 Low
- Heat 3/10 Moderate 6 d/yr ≥94°F today · 12 d/yr by 30 yrs out
- Wind 1/10 Low
- Air quality 10/10 Extreme 19 unhealthy d/yr today · 21 by 30 yrs out
Nearby sold comps map
Loading sold comps map…
Walkable amenities ~0.75 mi
Loading nearby amenities…
Taxation est. · year 1
- Rental income
- $20,891
- − Mortgage interest
- −$4,089
- − Property taxes
- −$584
- − Insurance
- −$365
- − Repairs & maintenance
- −$1,671
- − Management
- −$1,671
- − Depreciation
- −$2,124
- Taxable income
- $10,386
- Est. tax owed @ 24.0%
- −$2,493
- After-tax cash flow
- $8,468/yr
For passive investors: Depreciation is non-cash, so a rental often shows a tax loss while cash-flowing — sheltering income. Rental losses are passive: they offset passive income freely, and up to $25,000/yr can offset ordinary (W-2) income if you actively participate and your MAGI is under $100k (phasing out to $0 by $150k); unused losses carry forward. On sale, claimed depreciation is recaptured at up to 25%, and gains may owe capital-gains tax (a 1031 exchange can defer both). Figures are a year-1 estimate at your 24.0% rate — not tax advice; consult a CPA.
Schools (NCES district)
- District
- Spokane School District
- NCES district ID
- 5308250
- Math proficiency
- 47% ▲ 1.00%
- Reading proficiency
- 58% ▲ 1.00%
- Median HH income
- $43,187
- Composite
- 46.1/100
- National rank
- #5477
- State rank
- #136 of 291 in WA
Livability — Spokane
- Score
- 80/100
- State rank
- #93
- US rank
- #1822
Category grades
Schools grade is shown separately in the Schools card above.
Census & demographics
- Census place
- Spokane, WA
- County
- Spokane County · 496,401 people
- City population
- 298,820
- Metro
- Spokane-Spokane Valley, WA
- Population (ZIP)
- 58,669
- Household income
- $88,599
- Rent vs Own
- Severe rent burden
- 1832.0
Population outlook (Spokane County) Hauer SSP2
- Today (2025)
- 531,314 people
- By 2030
- 549,278 · +3.4%
- By 2040
- 577,822 · +8.8%
- By 2050
- 598,188 · +12.6%
- By 2075
- 630,744 · +18.7%
- By 2100
- 622,360 · +17.1%
Race, ethnicity, and origin ACS 2023
- Neighborhood character
- Predominantly White (83%)
- Race & ethnicity
- White 83% Two or more races 7% Hispanic / Latino 5% Black 2% Asian 2% Pacific Islander 1%
- Hispanic origin (detail)
- Mexican 4%
- Common ancestry
- Portuguese 4% Italian 2% Lithuanian 2%
- Foreign-born
- 6% · Canada, China
- Languages at home
- 93% English-only · Spanish 2% Russian/Polish/Slavic 1% Other Asian/Pacific 1%
Political lean MEDSL · Spokane
- 2024 margin
- Toss-up / Even · D 46.0% · R 51.0% · Other 3.0%
- 2008→2024 swing
- -3.8pp toward R · 2008: -1.1pp · 2024: -5.0pp
- All cycles
- 2024: R+5.0 2020: R+4.3 2016: R+8.3 2012: R+6.3 2008: R+1.1
Not yet ingested
- Civics
- —
Market trends
- HPI YoY
- ▼ -392.58%
- Current HPI
- 324.2299
- Rent YoY
- ▲ 0.46%
- Metro
- Spokane-Spokane Valley, WA
- State GDP YoY
- ▲ 4.65%
- F500 in state
- 22
Industry mix (Fortune 500 HQ in WA)
| Industry | F500 HQs | Revenue |
|---|---|---|
| Retail | 2 | $269B |
|
||
| Technology / Retail | 1 | $638B |
|
||
| Technology | 1 | $245B |
|
||
| Telecommunications | 1 | $38B |
|
||
| Food / Beverage | 1 | $36B |
|
||
| Automotive / Trucks | 1 | $34B |
|
||
Price history
+262.8% since first listed6 events — show timeline
- 2026-06-05 Listed $78,000 SPOKANEMLS as Distributed by MLS Grid
- 2024-06-21 Sold (MLS) $60,000 SPOKANEMLS as Distributed by MLS Grid
- 2024-05-29 Pending — SPOKANEMLS as Distributed by MLS Grid
- 2024-04-05 Listed $65,000 SPOKANEMLS as Distributed by MLS Grid
- 2010-07-23 Sold (MLS) $18,000 SPOKANEMLS as Distributed by MLS Grid
- 2010-06-11 Listed $21,500 SPOKANEMLS as Distributed by MLS Grid
Property tax history
+9.7%/yrLatest (2026): $584 · +57.9% YoY. Source: county tax records.
Cash-flow waterfall
monthlySold comps — $/sqft
last 12 mo · ≤1 miLoading sold comps…