 🏗️ New Construction
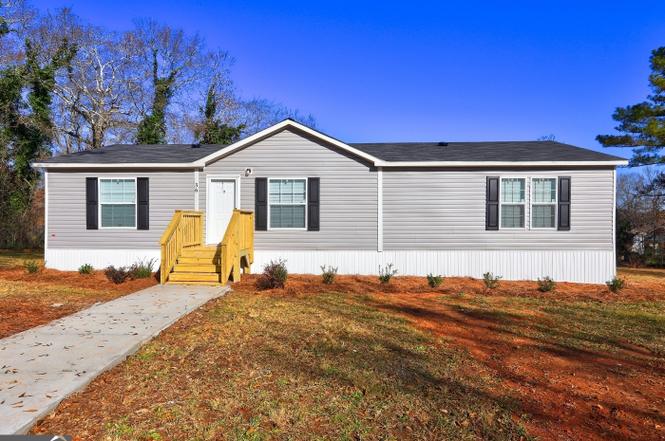
36 Highpoint Ln · Locust Grove, GA
Flood risk 1/10 · Minimal
- FEMA flood zone
- X (unshaded)
- Chance of flooding over 30 yrs
- 0.0%
- Est. flood insurance / yr
- $507 – $1,088
Fire risk 3/10 · Minor
- Est. fire insurance / yr
- $963 – $1,789
Heat risk 7/10 · Major
- Hot days now (above 106°F)
- 7 days/yr
- Hot days in 30 yrs
- 18 days/yr
Wind risk 6/10 · Moderate
- Chance of severe wind over 30 yrs
- 27.0%
Air-quality risk 4/10 · Minor
- Unhealthy air days now
- 4 days/yr
- Unhealthy air days in 30 yrs
- 5 days/yr
Risk factors via First Street. Map © Google.
Why this score? — see what drove the D grade
The composite is a weighted blend of 9 inputs, each scored 0–100. Each bar is that input's sub-score; the figure is the points it added to the 100-point composite (weight × sub-score).
- Cash flow +14.0/30.0
- ARV discount +7.5/15.0
- DSCR +4.2/10.0
- 1% rule +3.9/10.0
- Livability +3.1/5.0
- Rent growth +3.0/5.0
- Schools +2.6/10.0
- Condition / age +2.5/5.0
- Appreciation +0.0/10.0
$230,000
🖨 Deal sheet (PDF) 📄 Offer letter ✓ Due diligence
Listing remarks
Buyer Financing Fell Through No Fault of Seller -- Deeded Lot - Brand New 2024 Manufactured Construction Home - Well BELOW APPRAISAL - 3 Bedroom 2 Full Bath Master Split - Open Floor Plan - Kitchen with Island, Lots of Cabinets, Stainless Appliances - LVP Flooring - Fireplace - All Electric - On Sewer - This Home Is Beautiful - Call Agent Today For Private Showing!!! * * Can Go FHA, VA & Conventional * * Titles Retired - Engineer Report Available * * * * * Easy Financing * * * * *
Key facts
- Open floor plan
- Deeded lot
- Stainless appliances
Tags
Neighborhood map
What this means for you Summary
Snapshot
- This is a 3-bed/2.0-bath manufactured listed at $230k.
Deal economics
- At list price, monthly cash flow is $28 ($341/yr) — positive.
- The deal already cash-flows at list — no discount required.
- To meet the 1% rule (rent ≥ 1% of price), the offer needs to be $205k (11.0% below list).
- Recommended offer: $205k (11.0% below list) — sets the bar for 1% rule.
- Cap rate 6.4% vs local median 4.1% in Locust Grove — top-decile yield for the area; either an underpriced asset or a hidden risk that comps aren't pricing in. Stress-test before assuming the spread holds.
Location & tenants
- Location reads 62/100 on livability (#315 in GA) — a middle-class / working-renter tenant base. Strengths: cost of living A+, housing A+; Watch: crime C-, employment D+, amenities F.
- Henry County (rural): math 24% / reading 33% proficiency, ranked #89 of 174 in GA (top 51%) — low school quality limits family demand, transient renter base, plan for 1-2y turnover.
- Zoned schools: Unity Grove Elementary School (math 33% / reading 30%, grade F, #612 of 1,228 statewide, top 50%, 838 students, 53% FRL); Locust Grove Middle (math 30% / reading 35%, grade F, #221 of 470 statewide, top 48%, 1,103 students, 51% FRL); Locust Grove High (math 7% / reading 33%, grade F, #232 of 424 statewide, top 56%, 1,637 students, 41% FRL).
- Market conditions: Rents rising (+2.2%/yr); 499 active listings in the ZIP; 30 comparable units currently listed for rent nearby; rentals at typical pace (median 24d on market — plan ~3-4 weeks tenant-placement turnaround); solid renter incomes; 1,989 units permitted in Henry County in 2024 (92 in 5+ unit buildings).
Forward outlook
- Local home prices are declining (-3.0%/yr); year-one equity from $2k of loan paydown is wiped out by about $7k of value loss. Plan a longer hold.
- Henry County population projected at +29% by 2050 — long-run rental-demand tailwind backs the buy-and-hold thesis.
Negotiation context
- It's been on market 77 days — a 6% lower offer ($216k) is reasonable based on typical stale-listing flexibility.
- 6 sale attempts with the ask held roughly flat each time — persistent listings suggest the price (not the market) is what's stuck; bring a comps-based counter.
Risks & watch-outs
- Climate carrying-cost: major wind risk, 27% chance of damaging wind over 30y; extreme-heat days projected 7→18/yr by 2055 (HVAC capex compounding) — expect insurance premiums to compound above CPI over the hold.
Questions for the listing agent
- It's been on market 77 days. Have you received any prior offers? Is the seller open to a 11% concession, seller financing, or rate buy-down credit?
- Why hasn't it sold? Are there any deal-killer items the seller is aware of (foundation, flood, title, zoning, code violations)?
- Is there a deadline driving the sale (1031 exchange, divorce, estate, relocation)? That informs how much negotiation room exists.
- Schools are F-rated, which usually means shorter tenancies and higher turnover. Who's the typical renter profile here, and what's been the actual vacancy rate?
- The area grade is low — what's the realistic commute time and amenity access for the typical tenant pool here? Any planned neighborhood developments (good or bad) we should know about?
- What's the average days-on-market for RENTAL listings here right now (not sales)? A rising rental-DOM trend means longer vacancies and softer asking-rent achievability than the comps imply.
- What's the recent tenant-quality profile in this submarket — average credit score on applications, eviction rate, late-payment / NSF rate, and stable-employment percentage? A property-management company in the area should have these aggregated.
- How much new for-sale + rental construction is in the pipeline within 1–3 miles? Heavy new supply typically softens prices + rents 12–24 months out; constrained supply supports both.
Investment metrics
- 1% rule
- 0.89% ✗
- Cap rate
- 6.44%
- Cash-on-cash
- 0.53%
- DSCR
- 1.02
- GRM
- 9.4
CMA / ARV
No comps found within radius.
Projected returns pro-forma
-3.0% appreciation · 2.16% rent growth · sell at horizon
- IRR
- -16.4%
- Equity multiple
- 0.42×
- Total profit
- $-37,145
- Equity at exit
- $34,294
- IRR
- -9.7%
- Equity multiple
- 0.43×
- Total profit
- $-36,814
- Equity at exit
- $19,886
Cash invested: $64,400 (down + closing). Projections, not guarantees.
Landlord ↔ Tenant lean methodology
- Overall (STATE)
- 90 Strongly Landlord-Friendly
- State Georgia
- 90 Strongly Landlord-Friendly · R+3
- County
- — inherits STATE
- City
- — inherits STATE
ZIP-level market 30248
- Home prices YoY
- -21.0%
- Rents YoY
- 2.2%
- Active inventory
- 499
- Price-to-rent
- 9.4×
Monthly cashflow live
- Estimated rent
- $2,048 high interval (Pro) →
- Mortgage (P&I)
- −$1,206
- Tax est. 1.5%
- −$288 /mo · $3,450/yr
- Insurance
- −$96
- HOA
- −$0
- Vacancy / Maint / Mgmt
- −$430
- Net cashflow
- $28
Break-even live
Sensitivity live
| Price | -10% $187 | -5% $108 | +0% $28 | +5% $-51 | +10% $-131 |
|---|---|---|---|---|---|
| Rent | -10% $-133 | -5% $-52 | +0% $28 | +5% $109 | +10% $190 |
| Rate | -1.0pp $144 | -0.5pp $87 | base $28 | +0.5pp $-31 | +1.0pp $-92 |
UW: 25.0% down · 7.5% · 30yr · 1.5% tax · 5.0% vac · 8.0% maint · 8.0% mgmt
Financing live
Cash to close
- Down payment
- $57,500
- Closing costs
- $6,900
- Reserves months
- —
- Total cash needed
- —
Loan-product check · same deal, 3 products live
Conventional
25% down · 7.5% · 30yr
- Down + closing
- —
- Monthly P&I
- —
- Monthly cashflow
- —
- DSCR
- —
- Eligible?
- —
Personal DTI + credit; lowest rate.
DSCR
20% down · 8.5% · 30yr
- Down + closing
- —
- Monthly P&I
- —
- Monthly cashflow
- —
- DSCR
- —
- Eligible?
- —
No personal income docs; deal must DSCR.
Hard money
10% down · 12.0% · 12mo
- Down + closing
- —
- Monthly P&I
- —
- Monthly cashflow
- —
- DSCR
- —
- Eligible?
- —
Short-term bridge; refi at stabilization.
Rent comps 30 comps
| Address | Beds | Baths | Sqft | Rent | $/sqft | DOM | Units | Dist |
|---|---|---|---|---|---|---|---|---|
| 163 Brentwood Ln Locust Grove, GA | 4.0 | 3.0 | 1602 | $1,650 | $1.03 | 45d | 1 | 0.19mi |
| 308 Kellys Walk Locust Grove, GA | 3.0 | 2.0 | 1319 | $1,810 | $1.37 | 1d | 1 | 0.28mi |
| 329 Kellys Walk Locust Grove, GA | 3.0 | 2.0 | 1550 | $1,769 | $1.14 | 5d | 1 | 0.36mi |
| 125 Waters Edge Dr Locust Grove, GA | 3.0 | 2.0 | 1320 | $1,825 | $1.38 | 26d | 1 | 0.48mi |
| 444 Grove Park Dr Locust Grove, GA | 4.0 | 2.5 | 2203 | $2,200 | $1.00 | 7d | 1 | 0.61mi |
| 384 Jasmine Dr Locust Grove, GA | 3.0 | 2.5 | 1719 | $1,880 | $1.09 | 45d | 1 | 0.62mi |
| 239 Kings Cv Locust Grove, GA | 3.0 | 2.0 | 1479 | $1,570 | $1.06 | 14d | 1 | 0.72mi |
| 2237 Ross Ln Locust Grove, GA | 3.0 | 2.0 | 1530 | $1,800 | $1.18 | 14d | 1 | 0.76mi |
| 1320 Elmstead Pl Locust Grove, GA | 3.0–5.0 | 2.0–3.0 | 2245 | $2,220 | $0.99 | 0d | 1 | 0.87mi |
| 206 Nadia Ct Locust Grove, GA | 3.0 | 2.0 | 1557 | $1,785 | $1.15 | 26d | 1 | 0.89mi |
| 1221 Browns Country Ln Locust Grove, GA | 3.0 | 2.0 | 1379 | $1,759 | $1.28 | 45d | 1 | 1.04mi |
| 419 Grier Dr Locust Grove, GA | 4.0 | 2.5 | 2100 | $2,030 | $0.97 | 45d | 1 | 1.08mi |
| 236 Sableshire Way Locust Grove, GA | 4.0 | 2.5 | 1907 | $2,080 | $1.09 | 26d | 1 | 1.17mi |
| 1201 Fendt Dr Locust Grove, GA | 3.0 | 2.0 | 2226 | $1,995 | $0.90 | 26d | 1 | 1.20mi |
| 1201 Fendt Dr Locust Grove, GA | 3.0 | 2.0 | 2016 | $1,995 | $0.99 | 24d | 1 | 1.20mi |
| 1104 Saint Phillips Ct Locust Grove, GA | 4.0 | 3.0 | 1981 | $2,019 | $1.02 | 14d | 1 | 1.21mi |
| 1106 Saint Phillips Ct Locust Grove, GA | 4.0 | 2.5 | 2006 | $1,800 | $0.90 | 7d | 1 | 1.21mi |
| 317 Nutwood Trce Locust Grove, GA | 3.0 | 2.5 | 1690 | $1,985 | $1.17 | 45d | 1 | 1.22mi |
| 121 Avonwood Cir Locust Grove, GA | 4.0 | 3.0 | 2168 | $1,975 | $0.91 | 26d | 1 | 1.24mi |
| 1021 Claas Way Locust Grove, GA | 4.0 | 2.0 | 2164 | $2,125 | $0.98 | 45d | 1 | 1.27mi |
| 820 Athens Ln Locust Grove, GA | 3.0 | 2.0 | 2016 | $2,170 | $1.08 | 45d | 1 | 1.40mi |
| 929 Justice Dr Locust Grove, GA | 4.0 | 2.5 | 1945 | $2,081 | $1.07 | 7d | 1 | 1.42mi |
| 927 Justice Dr Locust Grove, GA | 4.0 | 2.5 | 2177 | $2,120 | $0.97 | 7d | 1 | 1.43mi |
| 1267 Fendt Dr Locust Grove, GA | 3.0 | 2.0 | 2016 | $2,149 | $1.07 | 12d | 1 | 1.45mi |
| 1274 Fendt Dr Locust Grove, GA | 4.0 | 2.0 | 2188 | $2,202 | $1.01 | 0d | 1 | 1.48mi |
| 513 Kirkland Dr Locust Grove, GA | 3.0 | 2.5 | 1926 | $1,850 | $0.96 | 45d | 1 | 1.48mi |
| 1108 Amadas Dr Locust Grove, GA | 4.0 | 2.0 | 2226 | $2,415 | $1.08 | 0d | 1 | 1.48mi |
| 1110 Jury Ct Locust Grove, GA | 4.0 | 2.5 | 1970 | $2,081 | $1.06 | 7d | 1 | 1.48mi |
| 141 Colony Park Ln Locust Grove, GA | 3.0 | 3.0 | 1769 | $1,931 | $1.09 | 26d | 1 | 1.49mi |
| 1404 Sodbuster Dr Locust Grove, GA | 4.0 | 2.0 | 2164 | $2,395 | $1.11 | 4d | 1 | 1.50mi |
Listing history 18 events
-
2025-09-19status Under Contract
-
2025-08-25status Back On Market
-
2025-06-20status Under Contract
-
2025-04-29price $230,000
-
2025-04-29historical
-
2025-04-28price $230,000
-
2025-04-23$235,000 New
-
2025-04-16status Back On Market
-
2025-04-16historical
-
2025-04-14historical
-
2025-03-12historical
-
2025-03-01price $250,000
-
2025-01-06$240,000 New
-
2025-01-06$240,000 New
-
2025-01-06$260,000 New
-
2024-09-26soldstatus $328,000
-
1990-12-04soldstatus $15,400
-
1985-11-01soldstatus $9,500
ⓘ Source: listings_history table (triggers on properties + properties_extension) + one-shot
backfill from property_details.listing_events for pre-trigger history.
Climate risk First Street
- Flood 1/10 Low FEMA zone X (unshaded) · 0% chance over 30 yrs
- Wildfire 3/10 Moderate
- Heat 7/10 Severe 7 d/yr ≥106°F today · 18 d/yr by 30 yrs out
- Wind 6/10 Major 27% chance of damaging wind over 30 yrs
- Air quality 4/10 Moderate 4 unhealthy d/yr today · 5 by 30 yrs out
Nearby sold comps map
Loading sold comps map…
Walkable amenities ~0.75 mi
Loading nearby amenities…
Taxation est. · year 1
- Rental income
- $24,576
- − Mortgage interest
- −$12,884
- − Property taxes
- −$3,450
- − Insurance
- −$1,150
- − Repairs & maintenance
- −$1,966
- − Management
- −$1,966
- − Depreciation
- −$6,691
- Taxable loss
- −$3,531
- Est. tax savings @ 24.0%
- +$847
- After-tax cash flow
- $1,189/yr
For passive investors: Depreciation is non-cash, so a rental often shows a tax loss while cash-flowing — sheltering income. Rental losses are passive: they offset passive income freely, and up to $25,000/yr can offset ordinary (W-2) income if you actively participate and your MAGI is under $100k (phasing out to $0 by $150k); unused losses carry forward. On sale, claimed depreciation is recaptured at up to 25%, and gains may owe capital-gains tax (a 1031 exchange can defer both). Figures are a year-1 estimate at your 24.0% rate — not tax advice; consult a CPA.
Schools (NCES district)
- District
- Henry County
- NCES district ID
- 1302820
- Math proficiency
- 24% ▼ -9.00%
- Reading proficiency
- 33% ▼ -7.00%
- Median HH income
- $62,594
- Composite
- 26.13/100
- National rank
- #7279
- State rank
- #89 of 174 in GA
Livability — Locust Grove
- Score
- 62/100
- State rank
- #315
- US rank
- #17034
Category grades
Schools grade is shown separately in the Schools card above.
Census & demographics
- Census place
- Locust Grove, GA
- County
- Henry County · 316,359 people
- City population
- 36,038
- Metro
- Atlanta-Sandy Springs-Alpharetta, GA
- Population (ZIP)
- 36,038
- Household income
- $83,823
- Rent vs Own
- Severe rent burden
- 485.0
Population outlook (Henry County) Hauer SSP2
- Today (2025)
- 249,041 people
- By 2030
- 264,369 · +6.2%
- By 2040
- 294,459 · +18.2%
- By 2050
- 322,249 · +29.4%
- By 2075
- 392,310 · +57.5%
- By 2100
- 437,836 · +75.8%
Race, ethnicity, and origin ACS 2023
- Neighborhood character
- Diverse neighborhood (Simpson 0.59)
- Race & ethnicity
- White 51% Black 37% Hispanic / Latino 9% Two or more races 5%
- Hispanic origin (detail)
- Mexican 3% Puerto Rican 3%
- Common ancestry
- Slovak 2% Italian 2% Iranian 1%
- Foreign-born
- 6% · Canada
- Languages at home
- 92% English-only · Spanish 6% French/Haitian/Cajun 1%
Political lean MEDSL · Henry
- 2024 margin
- Strong D (+29.7) · D 64.5% · R 34.9%
- 2008→2024 swing
- +37.1pp toward D · 2008: -7.5pp · 2024: 29.7pp
- All cycles
- 2024: D+29.7 2020: D+20.5 2016: D+4.3 2012: R+3.2 2008: R+7.5
Not yet ingested
- Civics
- —
Market trends
- HPI YoY
- ▼ -54.09%
- Current HPI
- 203.5358
- Rent YoY
- ▲ 2.16%
- Metro
- Atlanta-Sandy Springs-Alpharetta, GA
- State GDP YoY
- ▲ 2.66%
- F500 in state
- 28
Industry mix (Fortune 500 HQ in GA)
| Industry | F500 HQs | Revenue |
|---|---|---|
| Paper / Packaging | 2 | $29B |
|
||
| Retail | 1 | $160B |
|
||
| Transportation / Logistics | 1 | $91B |
|
||
| Airlines | 1 | $62B |
|
||
| Consumer Goods | 1 | $47B |
|
||
| Utilities | 1 | $25B |
|
||
Price history
+2321.1% since first listed18 events — show timeline
- 2025-09-19 Pending — GAMLS
- 2025-08-25 Relisted — GAMLS
- 2025-06-20 Pending — GAMLS
- 2025-04-29 Price Changed $230,000 GAMLS
- 2025-04-29 Listing Removed — GAMLS
- 2025-04-28 Price Changed $230,000 GAMLS
- 2025-04-23 Listed $235,000 GAMLS
- 2025-04-16 Relisted — GAMLS
- 2025-04-16 Listing Removed — GAMLS
- 2025-04-14 Listing Removed — GAMLS
- 2025-03-12 Listing Removed — GAMLS
- 2025-03-01 Price Changed $250,000 GAMLS
- 2025-01-06 Listed $260,000 GAMLS
- 2025-01-06 Listed $240,000 GAMLS
- 2025-01-06 Listed $240,000 GAMLS
- 2024-09-26 Sold (Public Records) $328,000 Public Records
- 1990-12-04 Sold (Public Records) $15,400 Public Records
- 1985-11-01 Sold (Public Records) $9,500 Public Records
Property tax history
+8.4%/yrLatest (2025): $433 · +50.0% YoY. Source: county tax records.
Cash-flow waterfall
monthlySold comps — $/sqft
last 12 mo · ≤1 miLoading sold comps…