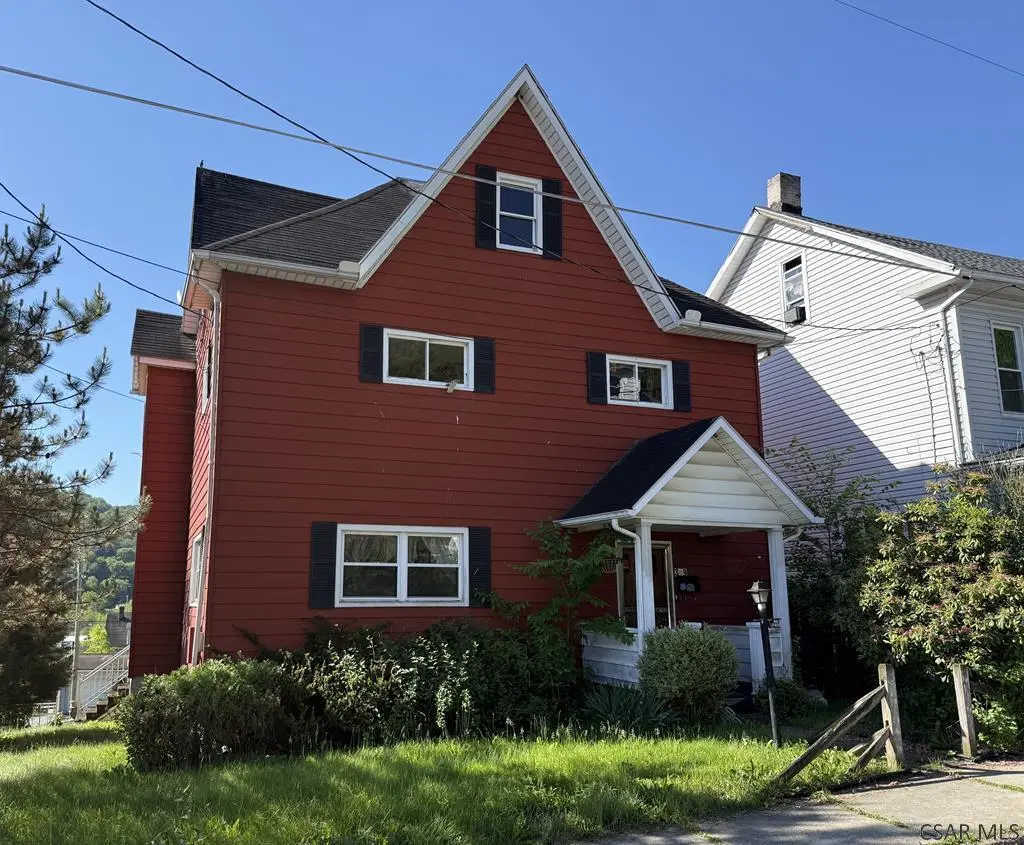
349 Third St · East Conemaugh, PA
Flood risk 1/10 · Minimal
- FEMA flood zone
- X (unshaded)
- Chance of flooding over 30 yrs
- 0.0%
- Est. flood insurance / yr
- $473 – $860
Fire risk 3/10 · Minor
- Est. fire insurance / yr
- $511 – $949
Heat risk 4/10 · Minor
- Hot days now (above 91°F)
- 8 days/yr
- Hot days in 30 yrs
- 20 days/yr
Wind risk 2/10 · Minimal
- Chance of severe wind over 30 yrs
- —
Air-quality risk 2/10 · Minimal
- Unhealthy air days now
- 1 days/yr
- Unhealthy air days in 30 yrs
- 2 days/yr
Risk factors via First Street. Map © Google.
Why this score? — see what drove the A- grade
The composite is a weighted blend of 9 inputs, each scored 0–100. Each bar is that input's sub-score; the figure is the points it added to the 100-point composite (weight × sub-score).
- Cash flow +30.0/30.0
- ARV discount +15.0/15.0
- 1% rule +10.0/10.0
- DSCR +10.0/10.0
- Appreciation +6.8/10.0
- Schools +3.6/10.0
- Livability +3.0/5.0
- Rent growth +2.5/5.0
- Condition / age +2.5/5.0
$45,000
🖨 Deal sheet (PDF) 📄 Offer letter ✓ Due diligence
Listing remarks MLS
Spacious 2-story home ready for a handy new owner in East Conemaugh Boro! This vinyl-sided property on a corner lot features just above 2,000 square feet of living space between 2 floors, and a partially finished basement. An enclosed back porch and hardwood floors in multiple rooms await you inside. Outside you'll discover a large backyard with two concrete off-street parking spaces. Great fixer-upper home to live in or rent.
Key facts
- Large level lot
- Large bonus area
- Walk-up attic
Tags
Property features AI
Exterior
- Parking: Off-street parking
- Utilities: Public water; Public sewer (sewer available)
- Home design: Single-family residence; Two levels / 2 stories
- Construction: Aluminum siding and frame construction; Shingle roof
- Exterior features: Patio; Porch; Corner lot; Rectangular lot; City street frontage; Publicly maintained road
Interior
- Kitchen: Eat-in kitchen
- Flooring: Wood flooring
- Bathrooms: 1 full bathroom; 1 half bathroom
- Heating & cooling: Ceiling fan(s); No central heating
- Interior features: Eat-in kitchen; Entrance foyer; Full, unfinished basement
- Laundry & utility: Laundry in basement
Neighborhood map
What this means for you Summary
Snapshot
- This is a 3-bed/1.5-bath single-family listed at $45k.
Deal economics
- At list price, monthly cash flow is $682 ($8k/yr) — positive.
- The deal already cash-flows at list — no discount required.
- Meets the 1% rule at list price ($1k rent vs $45k).
- Recommended offer: $44k (1.5% below list) — sets the bar for market timing.
Location & tenants
- Location reads 60/100 on livability (#1,504 in PA) — a middle-class / working-renter tenant base. Strengths: crime A+, cost of living A+; Watch: schools F, amenities F, commute F.
- Conemaugh Valley SD (rural): math 30% / reading 56% proficiency, ranked #313 of 539 in PA (top 58%) — families likely to look elsewhere, expect single-tenant / working-renter base with shorter leases.
- Market conditions: 22 active listings in the ZIP; 64 units permitted in Cambria County in 2024 (0 in 5+ unit buildings).
Forward outlook
- In year one you build about $2k of equity ($311 loan paydown + $2k appreciation (3.6% local appreciation)).
- Cambria County population projected at -28% by 2050 — secular population decline; favor cash flow + early exit over multi-decade hold.
- At projected returns (3.6% appreciation + 3.0% rent growth), your $13k cash investment doubles in ~2 years — after that, you're playing with house money.
Negotiation context
- It's been on market 17 days — a 2% lower offer ($44k) is reasonable based on typical stale-listing flexibility.
- 4 sale attempts since 19y ago; this cycle's ask has dropped $10k (18%) from the opening price — seller is motivated, your offer sets the floor, not the list.
- Current owner paid $15k; list at $45k implies a 200% gain — meaningful room to come down on a strong offer.
Risks & watch-outs
- Watch-outs: property tax is 2.6% of price.
Questions for the listing agent
- Property tax is high relative to price — has the assessment been appealed recently, and will the sale trigger a re-assessment?
- Is there a deadline driving the sale (1031 exchange, divorce, estate, relocation)? That informs how much negotiation room exists.
- Schools are F-rated, which usually means shorter tenancies and higher turnover. Who's the typical renter profile here, and what's been the actual vacancy rate?
- What's the average days-on-market for RENTAL listings here right now (not sales)? A rising rental-DOM trend means longer vacancies and softer asking-rent achievability than the comps imply.
- What's the recent tenant-quality profile in this submarket — average credit score on applications, eviction rate, late-payment / NSF rate, and stable-employment percentage? A property-management company in the area should have these aggregated.
- How much new for-sale + rental construction is in the pipeline within 1–3 miles? Heavy new supply typically softens prices + rents 12–24 months out; constrained supply supports both.
Investment metrics
- 1% rule
- 2.92% ✓
- Cap rate
- 24.49%
- Cash-on-cash
- 65.00%
- DSCR
- 3.89
- GRM
- 2.9
CMA / ARV
- ARV (on-the-fly)
- $76,368
- Comps found
- 5
Show comp detail 5 sales within ~0.75 mi
| Address | Dist | Beds/Ba | Sqft | Sold | Price | $/sf | Match |
|---|---|---|---|---|---|---|---|
| 349 Third St | 0.00mi | 3/1.0 | 2,040 (-1%) | 16mo | $15,000 | $7 | 83 |
| 211 Main St | 0.06mi | 3/1.0 | 2,028 (-2%) | 21mo | $75,000 | $37 | 74 |
| 117 Main St | 0.10mi | 4/1.0 (+1) | 1,976 (-4%) | 11mo | $49,900 | $25 | 72 |
| 320 Oak St | 0.21mi | 4/3.0 (+1) | 1,824 (-12%) | 19mo | $77,900 | $43 | 44 |
| 949 William Penn Ave | 0.69mi | 3/2.0 | 2,260 (+10%) | 21mo | $100,000 | $44 | 32 |
Match score weights: distance 35% · size 25% · config 20% · recency 20%. Top-matched comps best support the ARV.
Projected returns pro-forma
3.56% appreciation · 3.0% rent growth · sell at horizon
- IRR
- 70.3%
- Equity multiple
- 4.99×
- Total profit
- $50,290
- Equity at exit
- $21,676
- IRR
- 69.4%
- Equity multiple
- 10.25×
- Total profit
- $116,541
- Equity at exit
- $34,572
Cash invested: $12,600 (down + closing). Projections, not guarantees.
Landlord ↔ Tenant lean methodology
- Overall (STATE)
- 62 Landlord-Friendly
- State Pennsylvania
- 62 Landlord-Friendly · EVEN
- County
- — inherits STATE
- City
- — inherits STATE
ZIP-level market 15909
- Home prices YoY
- 2.4%
- Active inventory
- 22
- Price-to-rent
- 2.9×
Monthly cashflow live
- Estimated rent
- $1,312 medium interval (Pro) →
- Mortgage (P&I)
- −$236
- Tax from tax record
- −$99 /mo · $1,191/yr
- Insurance
- −$19
- HOA
- −$0
- Vacancy / Maint / Mgmt
- −$276
- Net cashflow
- $682
Break-even live
Sensitivity live
| Price | -10% $708 | -5% $695 | +0% $682 | +5% $670 | +10% $657 |
|---|---|---|---|---|---|
| Rent | -10% $579 | -5% $631 | +0% $682 | +5% $734 | +10% $786 |
| Rate | -1.0pp $705 | -0.5pp $694 | base $682 | +0.5pp $671 | +1.0pp $659 |
UW: 25.0% down · 7.5% · 30yr · 1.5% tax · 5.0% vac · 8.0% maint · 8.0% mgmt
Financing live
Cash to close
- Down payment
- $11,250
- Closing costs
- $1,350
- Reserves months
- —
- Total cash needed
- —
Loan-product check · same deal, 3 products live
Conventional
25% down · 7.5% · 30yr
- Down + closing
- —
- Monthly P&I
- —
- Monthly cashflow
- —
- DSCR
- —
- Eligible?
- —
Personal DTI + credit; lowest rate.
DSCR
20% down · 8.5% · 30yr
- Down + closing
- —
- Monthly P&I
- —
- Monthly cashflow
- —
- DSCR
- —
- Eligible?
- —
No personal income docs; deal must DSCR.
Hard money
10% down · 12.0% · 12mo
- Down + closing
- —
- Monthly P&I
- —
- Monthly cashflow
- —
- DSCR
- —
- Eligible?
- —
Short-term bridge; refi at stabilization.
Listing history 13 events
-
2026-06-19days on market $45,000 Active 17 DOM
-
2026-06-18days on market $45,000 Active 16 DOM
-
2026-06-17days on market $45,000 Active 15 DOM
-
2026-06-16days on market $45,000 Active 14 DOM
-
2026-06-15days on market $45,000 Active 13 DOM
-
2026-06-14days on market $45,000 Active 11 DOM
-
2026-06-12days on market $45,000 Active 10 DOM
-
2026-06-09days on market $45,000 Active 7 DOM
-
2026-06-09price $45,000 Active 6 DOM
-
2026-06-08days on market $55,000 Active 6 DOM
-
2026-06-07days on market $55,000 Active 5 DOM
-
2026-06-02remarks 699-char remark
-
2026-06-02$55,000 Active 1 DOM
ⓘ Source: listings_history table (triggers on properties + properties_extension) + one-shot
backfill from property_details.listing_events for pre-trigger history.
Tax reassessment forecast PA · Partial reset (capped growth)
- Current annual tax
- $1,191 · $99/mo
- Projected year-2 tax
- $1,191 · $99/mo
- Expected delta
- $0/yr ($0/mo · 0.0%)
ⓘ Screening estimate from a state-policy table — verify with the county assessor before closing.
Climate risk First Street
- Flood 1/10 Low FEMA zone X (unshaded) · 0% chance over 30 yrs
- Wildfire 3/10 Moderate
- Heat 4/10 Moderate 8 d/yr ≥91°F today · 20 d/yr by 30 yrs out
- Wind 2/10 Low
- Air quality 2/10 Low 1 unhealthy d/yr today · 2 by 30 yrs out
Nearby sold comps map
Loading sold comps map…
Walkable amenities ~0.75 mi
Loading nearby amenities…
Taxation est. · year 1
- Rental income
- $15,744
- − Mortgage interest
- −$2,521
- − Property taxes
- −$1,191
- − Insurance
- −$225
- − Repairs & maintenance
- −$1,259
- − Management
- −$1,259
- − Depreciation
- −$1,309
- Taxable income
- $7,979
- Est. tax owed @ 24.0%
- −$1,915
- After-tax cash flow
- $6,275/yr
For passive investors: Depreciation is non-cash, so a rental often shows a tax loss while cash-flowing — sheltering income. Rental losses are passive: they offset passive income freely, and up to $25,000/yr can offset ordinary (W-2) income if you actively participate and your MAGI is under $100k (phasing out to $0 by $150k); unused losses carry forward. On sale, claimed depreciation is recaptured at up to 25%, and gains may owe capital-gains tax (a 1031 exchange can defer both). Figures are a year-1 estimate at your 24.0% rate — not tax advice; consult a CPA.
Schools (NCES district)
- District
- Conemaugh Valley SD
- NCES district ID
- 4206430
- Math proficiency
- 30% ▼ -18.00%
- Reading proficiency
- 56% ▼ -11.00%
- Median HH income
- $42,523
- Composite
- 36.16/100
- National rank
- #4739
- State rank
- #313 of 539 in PA
Livability — East Conemaugh
- Score
- 60/100
- State rank
- #1504
- US rank
- #19510
Category grades
Schools grade is shown separately in the Schools card above.
Census & demographics
- Census place
- East Conemaugh, PA
- Population (ZIP)
- 4,850
Population outlook (Cambria County) Hauer SSP2
- Today (2025)
- 122,754 people
- By 2030
- 115,827 · -5.6%
- By 2040
- 101,309 · -17.5%
- By 2050
- 88,379 · -28.0%
- By 2075
- 65,237 · -46.9%
- By 2100
- 46,909 · -61.8%
Race, ethnicity, and origin ACS 2023
- Neighborhood character
- Predominantly White (95%)
- Race & ethnicity
- White 95% Two or more races 3% Hispanic / Latino 2%
- Common ancestry
- Romanian 13% Polish 2% Slovak 2%
- Foreign-born
- 0%
- Languages at home
- 99% English-only · Spanish 1%
Political lean MEDSL · Cambria
- 2024 margin
- Solid R (+39.7) · D 29.8% · R 69.5%
- 2008→2024 swing
- -40.4pp toward R · 2008: 0.7pp · 2024: -39.7pp
- All cycles
- 2024: R+39.7 2020: R+37.3 2016: R+37.8 2012: R+17.8 2008: D+0.7
Not yet ingested
- Civics
- —
Market trends
- HPI YoY
- ▲ 3.56%
- Current HPI
- 150.8221
- Rent YoY
- —
- Metro
- —
- State GDP YoY
- ▲ 1.68%
- F500 in state
- 34
Industry mix (Fortune 500 HQ in PA)
| Industry | F500 HQs | Revenue |
|---|---|---|
| Healthcare | 2 | $309B |
|
||
| Insurance | 2 | $27B |
|
||
| Telecommunications / Media | 1 | $124B |
|
||
| Industrial Distribution | 1 | $22B |
|
||
| Financial Services | 1 | $20B |
|
||
| Chemicals / Materials | 1 | $18B |
|
||
Price history
-4.3% since first listed9 events — show timeline
- 2026-06-02 Listed $55,000 CSMLS
- 2026-03-23 Listed $29,900 CSMLS
- 2025-03-03 Sold (MLS) $15,000 CSMLS
- 2024-12-02 Pending — CSMLS
- 2024-11-20 Price Changed $24,900 CSMLS
- 2024-11-07 Listed $29,900 CSMLS
- 2008-02-22 Sold (MLS) $53,500 CSMLS
- 2008-02-16 Sold (Public Records) $53,500 Public Records
- 2007-12-06 Listed $57,500 CSMLS
Property tax history
+0.3%/yrLatest (2026): $1,191 · +0.0% YoY. Source: county tax records.
Cash-flow waterfall
monthlySold comps — $/sqft
last 12 mo · ≤1 miLoading sold comps…