 5-Plex
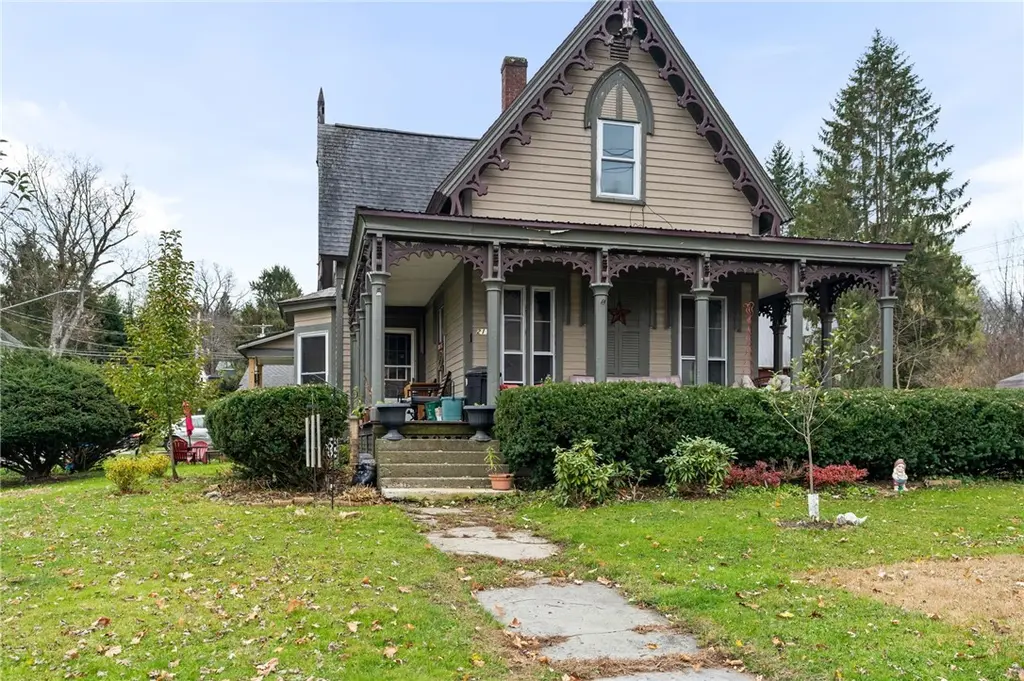
211 Main St · Newfield, NY
Flood risk 4/10 · Minor
- FEMA flood zone
- X
- Chance of flooding over 30 yrs
- 0.22%
- Est. flood insurance / yr
- $507 – $1,088
Fire risk 1/10 · Minimal
- Est. fire insurance / yr
- $691 – $1,283
Heat risk 2/10 · Minimal
- Hot days now (above 95°F)
- 7 days/yr
- Hot days in 30 yrs
- 15 days/yr
Wind risk 1/10 · Minimal
- Chance of severe wind over 30 yrs
- 1.0%
Air-quality risk 1/10 · Minimal
- Unhealthy air days now
- 0 days/yr
- Unhealthy air days in 30 yrs
- 0 days/yr
Risk factors via First Street. Map © Google.
Why this score? — see what drove the B- grade
The composite is a weighted blend of 9 inputs, each scored 0–100. Each bar is that input's sub-score; the figure is the points it added to the 100-point composite (weight × sub-score).
- Cash flow +28.2/30.0
- DSCR +10.0/10.0
- 1% rule +8.1/10.0
- ARV discount +7.5/15.0
- Appreciation +3.6/10.0
- Schools +3.4/10.0
- Rent growth +2.5/5.0
- Livability +2.5/5.0
- Condition / age +2.5/5.0
$369,000
🖨 Deal sheet 📄 Offer letter ✓ Due diligence
Multi-family units
County records classify this as Multi-Family (5+ Unit). Listing-text estimate: 5 units. confirmed
5+ unit building — per-unit beds/baths from public records are typically unavailable; the breakdown below (if shown) is an estimate from the listing text.
Listing remarks MLS
Excellent investment opportunity, one parcel with two separate residential buildings and a total of five units. The primary two story home is divided into four individual one bedroom apartments, each with its own private entrance. In addition, a standalone one bedroom bungalow sits separately on the property, providing an additional rental unit. This setup allows for strong rental income, flexible occupancy options, or the ability to live in one unit while leasing the others. A rare chance to own a well positioned income property with versatility, stable return potential, and room to elevate value over time.
Key facts
- Five units
- Private entrance
- Strong rental income
Tags
Neighborhood map
What this means for you Summary
Snapshot
- This is a 5 × 1-bed/1-bath units multifamily listed at $369k.
Deal economics
- At list price, monthly cash flow is $1k ($14k/yr) — positive. Per door: $234/mo.
- The deal already cash-flows at list — no discount required.
- Meets the 1% rule at list price ($5k rent vs $369k).
- Recommended offer: $336k (9.0% below list) — sets the bar for market timing.
- Cap rate 10.1% vs local median 3.2% in Newfield — top-decile yield for the area; either an underpriced asset or a hidden risk that comps aren't pricing in. Stress-test before assuming the spread holds.
Location & tenants
- Location reads: area grade B — affects rentability + tenant quality, not the cash-flow math above.
- Newfield Central School District (rural): math 32% / reading 48% proficiency, ranked #517 of 590 in NY (top 88%) — families likely to look elsewhere, expect single-tenant / working-renter base with shorter leases.
- Market conditions: 29 active listings in the ZIP; 382 units permitted in Tompkins County in 2024 (208 in 5+ unit buildings).
Forward outlook
- Local home prices are declining (-2.7%/yr); year-one equity from $3k of loan paydown is wiped out by about $10k of value loss. Plan a longer hold.
- Tompkins County population projected at +17% by 2050 — long-run rental-demand tailwind backs the buy-and-hold thesis.
- At projected returns (-2.7% appreciation + 3.0% rent growth), your $103k cash investment doubles in ~9 years — after that, you're playing with house money.
Negotiation context
- It's been on market 95 days — a 9% lower offer ($336k) is reasonable based on typical stale-listing flexibility.
- 4 sale attempts with the ask held roughly flat each time — persistent listings suggest the price (not the market) is what's stuck; bring a comps-based counter.
- Current owner paid $240k; list at $369k implies a 54% gain — meaningful room to come down on a strong offer.
Risks & watch-outs
- Watch-outs: built in 1860 — expect roof / HVAC / electrical / plumbing capex.
Questions for the listing agent
- It's been on market 95 days. Have you received any prior offers? Is the seller open to a 9% concession, seller financing, or rate buy-down credit?
- Can we see the unit-by-unit rent roll, current vacancy, and any below-market leases? What's the average tenancy length?
- What capital expenditures (roof, boiler, parking lot, exteriors) have been made in the last 5 years, and what's planned in the next 2?
- Built in 1860 — when were the roof, HVAC, electrical panel, plumbing, and water heater last replaced?
- Why hasn't it sold? Are there any deal-killer items the seller is aware of (foundation, flood, title, zoning, code violations)?
- Is there a deadline driving the sale (1031 exchange, divorce, estate, relocation)? That informs how much negotiation room exists.
- What's the average days-on-market for RENTAL listings here right now (not sales)? A rising rental-DOM trend means longer vacancies and softer asking-rent achievability than the comps imply.
- What's the recent tenant-quality profile in this submarket — average credit score on applications, eviction rate, late-payment / NSF rate, and stable-employment percentage? A property-management company in the area should have these aggregated.
- How much new apartment / multifamily construction is in the pipeline within 1–3 miles? Heavy new supply (>2% of stock underway) typically softens rents 12–24 months out; light construction supports rent growth.
Investment metrics
- 1% rule
- 1.31% ✓
- Cap rate
- 10.09%
- Cash-on-cash
- 13.57%
- DSCR
- 1.60
- GRM
- 6.4
CMA / ARV
No comps found within radius.
Projected returns pro-forma
-2.72% appreciation · 3.0% rent growth · sell at horizon
- IRR
- 4.7%
- Equity multiple
- 1.18×
- Total profit
- $18,994
- Equity at exit
- $59,551
- IRR
- 13.7%
- Equity multiple
- 2.13×
- Total profit
- $116,534
- Equity at exit
- $39,744
Cash invested: $103,320 (down + closing). Projections, not guarantees.
Landlord ↔ Tenant lean methodology
- Overall (STATE)
- 15 Strongly Tenant-Friendly
- State New York
- 15 Strongly Tenant-Friendly · D+10
- County
- — inherits STATE
- City
- — inherits STATE
ZIP-level market 14867
- Home prices YoY
- -1.0%
- Active inventory
- 29
- Price-to-rent
- 31.8×
Monthly cashflow live
- Estimated rent
- $4,830 medium interval (Pro) →
- Mortgage (P&I)
- −$1,935
- Tax from tax record
- −$559 /mo · $6,706/yr
- Insurance
- −$154
- HOA
- −$0
- Vacancy / Maint / Mgmt
- −$1,014
- Net cashflow
- $1,168
Break-even live
5-unit breakdown (identical units grouped — click to expand)
| Units | Beds | Baths | Est. rent |
|---|---|---|---|
| 5× units | 1 | 1 | $4,830 |
| #1 | 1 | 1 | $966 |
| #2 | 1 | 1 | $966 |
| #3 | 1 | 1 | $966 |
| #4 | 1 | 1 | $966 |
| #5 | 1 | 1 | $966 |
| Total (5 units) | $4,830 | ||
UW: 25.0% down · 7.5% · 30yr · 1.5% tax · 5.0% vac · 8.0% maint · 8.0% mgmt
Financing live
Cash to close
- Down payment
- $92,250
- Closing costs
- $11,070
- Reserves months
- —
- Total cash needed
- —
Loan-product check · same deal, 3 products live
Conventional
25% down · 7.5% · 30yr
- Down + closing
- —
- Monthly P&I
- —
- Monthly cashflow
- —
- DSCR
- —
- Eligible?
- —
Personal DTI + credit; lowest rate.
DSCR
20% down · 8.5% · 30yr
- Down + closing
- —
- Monthly P&I
- —
- Monthly cashflow
- —
- DSCR
- —
- Eligible?
- —
No personal income docs; deal must DSCR.
Hard money
10% down · 12.0% · 12mo
- Down + closing
- —
- Monthly P&I
- —
- Monthly cashflow
- —
- DSCR
- —
- Eligible?
- —
Short-term bridge; refi at stabilization.
Listing history 22 events
-
2026-06-19days on market $369,000 Active 95 DOM
-
2026-06-18days on market $369,000 Active 94 DOM
-
2026-06-17days on market $369,000 Active 93 DOM
-
2026-06-16days on market $369,000 Active 92 DOM
-
2026-06-15days on market $369,000 Active 91 DOM
-
2026-06-14days on market $369,000 Active 89 DOM
-
2026-06-13days on market $369,000 Active 88 DOM
-
2026-06-10days on market $369,000 Active 86 DOM
-
2026-06-09days on market $369,000 Active 85 DOM
-
2026-06-08days on market $369,000 Active 84 DOM
-
2026-06-07days on market $369,000 Active 83 DOM
-
2026-06-02days on market $369,000 Active 78 DOM
-
2026-06-01days on market $369,000 Active 77 DOM
-
2026-05-31days on market $369,000 Active 76 DOM
-
2026-05-30days on market $369,000 Active 75 DOM
-
2026-03-16$369,000 Active 615-char remark
Show marketing remark (615 chars)
Excellent investment opportunity, one parcel with two separate residential buildings and a total of five units. The primary two story home is divided into four individual one bedroom apartments, each with its own private entrance. In addition, a standalone one bedroom bungalow sits separately on the property, providing an additional rental unit. This setup allows for strong rental income, flexible occupancy options, or the ability to live in one unit while leasing the others. A rare chance to own a well positioned income property with versatility, stable return potential, and room to elevate value over time.
-
2025-11-12$385,000 Active
-
2025-11-06$385,000 Active
-
2022-08-29soldstatus $240,000
-
2007-02-28soldstatus $175,000
-
2002-06-07soldstatus $62,000
ⓘ Source: listings_history table (triggers on properties + properties_extension) + one-shot
backfill from property_details.listing_events for pre-trigger history.
Tax reassessment forecast NY · Partial reset (capped growth)
- Current annual tax
- $6,706 · $559/mo
- Projected year-2 tax
- $6,706 · $559/mo
- Expected delta
- $0/yr ($0/mo · 0.0%)
ⓘ Screening estimate from a state-policy table — verify with the county assessor before closing.
Climate risk First Street
- Flood 4/10 Moderate FEMA zone X · 22% chance over 30 yrs
- Wildfire 1/10 Low
- Heat 2/10 Low 7 d/yr ≥95°F today · 15 d/yr by 30 yrs out
- Wind 1/10 Low 100% chance of damaging wind over 30 yrs
- Air quality 1/10 Low 0 unhealthy d/yr today · 0 by 30 yrs out
Nearby sold comps map
Loading sold comps map…
Walkable amenities ~0.75 mi
Loading nearby amenities…
Taxation est. · year 1
- Rental income
- $57,960
- − Mortgage interest
- −$20,670
- − Property taxes
- −$6,706
- − Insurance
- −$1,845
- − Repairs & maintenance
- −$4,637
- − Management
- −$4,637
- − Depreciation
- −$10,735
- Taxable income
- $8,731
- Est. tax owed @ 24.0%
- −$2,096
- After-tax cash flow
- $11,921/yr
For passive investors: Depreciation is non-cash, so a rental often shows a tax loss while cash-flowing — sheltering income. Rental losses are passive: they offset passive income freely, and up to $25,000/yr can offset ordinary (W-2) income if you actively participate and your MAGI is under $100k (phasing out to $0 by $150k); unused losses carry forward. On sale, claimed depreciation is recaptured at up to 25%, and gains may owe capital-gains tax (a 1031 exchange can defer both). Figures are a year-1 estimate at your 24.0% rate — not tax advice; consult a CPA.
Schools (NCES district)
- District
- Newfield Central School District
- NCES district ID
- 3620790
- Math proficiency
- 32% ▼ -7.00%
- Reading proficiency
- 48% ▲ 10.00%
- Median HH income
- $50,430
- Composite
- 34.47/100
- National rank
- #5188
- State rank
- #517 of 590 in NY
Livability — Newfield
No livability data for this city. (Only ~50 U.S. cities are tracked.)
Census & demographics
- Census place
- Newfield, NY
- Population (ZIP)
- 5,188
Population outlook (Tompkins County) Hauer SSP2
- Today (2025)
- 113,958 people
- By 2030
- 118,774 · +4.2%
- By 2040
- 125,927 · +10.5%
- By 2050
- 133,599 · +17.2%
- By 2075
- 156,759 · +37.6%
- By 2100
- 169,896 · +49.1%
Race, ethnicity, and origin ACS 2023
- Neighborhood character
- Predominantly White (94%)
- Race & ethnicity
- White 94% Two or more races 5% Hispanic / Latino 5%
- Common ancestry
- Iranian 15% Lithuanian 4% Romanian 4%
- Foreign-born
- 2% · Canada
- Languages at home
- 98% English-only · Spanish 1% Russian/Polish/Slavic 1%
Political lean MEDSL · Tompkins
- 2024 margin
- Solid D (+50.6) · D 75.3% · R 24.7%
- 2008→2024 swing
- +8.6pp toward D · 2008: 42.1pp · 2024: 50.6pp
- All cycles
- 2024: D+50.6 2020: D+49.2 2016: D+42.1 2012: D+39.8 2008: D+42.1
Not yet ingested
- Civics
- —
Market trends
- HPI YoY
- ▼ -2.72%
- Current HPI
- 278.2047
- Rent YoY
- —
- Metro
- —
- State GDP YoY
- ▲ 2.60%
- F500 in state
- 92
Industry mix (Fortune 500 HQ in NY)
| Industry | F500 HQs | Revenue |
|---|---|---|
| Financial Services | 10 | $950B |
|
||
| Consumer Goods | 9 | $162B |
|
||
| Insurance | 4 | $225B |
|
||
| Telecommunications | 2 | $144B |
|
||
| Pharmaceuticals | 2 | $112B |
|
||
| Media / Entertainment | 2 | $69B |
|
||
Price history
+495.2% since first listed7 events — show timeline
- 2026-03-16 Listed $369,000 IBRMLS
- 2026-03-16 Listed $369,000 IBRMLS
- 2025-11-12 Listed $385,000 IBRMLS
- 2025-11-06 Listed $385,000 IBRMLS
- 2022-08-29 Sold (Public Records) $240,000 Public Records
- 2007-02-28 Sold (Public Records) $175,000 Public Records
- 2002-06-07 Sold (Public Records) $62,000 Public Records
Property tax history
+3.2%/yrLatest (2025): $6,706 · +0.8% YoY. Source: county tax records.
Cash-flow waterfall
monthlySold comps — $/sqft
last 12 mo · ≤1 miLoading sold comps…