14405 N Pennsylvania Ave Unit 6 Q · Oklahoma City, OK
Flood risk 1/10 · Minimal
- FEMA flood zone
- X (unshaded)
- Chance of flooding over 30 yrs
- 0.0%
- Est. flood insurance / yr
- $507 – $1,088
Fire risk 2/10 · Minimal
- Est. fire insurance / yr
- $2,463 – $4,575
Heat risk 6/10 · Moderate
- Hot days now (above 108°F)
- 7 days/yr
- Hot days in 30 yrs
- 19 days/yr
Wind risk 2/10 · Minimal
- Chance of severe wind over 30 yrs
- 4.0%
Air-quality risk 2/10 · Minimal
- Unhealthy air days now
- 1 days/yr
- Unhealthy air days in 30 yrs
- 1 days/yr
Risk factors via First Street. Map © Google.
Why this score? — see what drove the D grade
The composite is a weighted blend of 9 inputs, each scored 0–100. Each bar is that input's sub-score; the figure is the points it added to the 100-point composite (weight × sub-score).
- Cash flow +7.9/30.0
- ARV discount +7.5/15.0
- Appreciation +6.4/10.0
- 1% rule +4.9/10.0
- Livability +4.0/5.0
- Rent growth +3.8/5.0
- Schools +3.6/10.0
- Condition / age +2.5/5.0
- DSCR +2.0/10.0
$115,000
🖨 Deal sheet (PDF) 📄 Offer letter ✓ Due diligence
Listing remarks
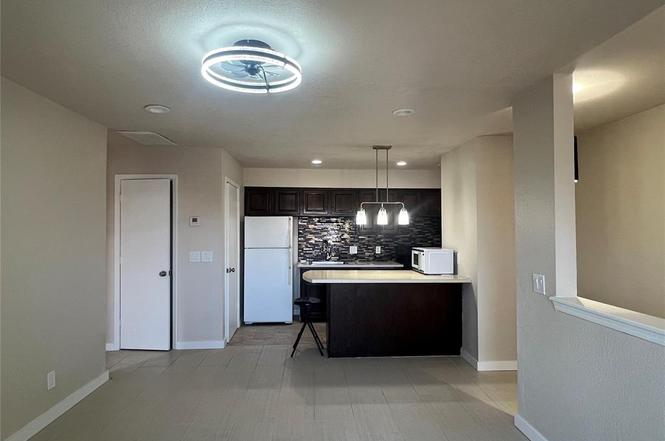
Welcome to this charming and well-maintained upstairs one-bedroom, one-bath condo in the highly desirable, gated community off N. Pennsylvania Avenue. Offering 645 square feet of smart, comfortable living, this move-in-ready home is perfect for anyone seeking convenience, low-maintenance living, or a fantastic investment opportunity. Step inside to a bright and inviting living area featuring updated finishes and plenty of natural light. The cozy layout includes a comfortable living room, a dining space, and a great size kitchen that provides excellent storage and functionality—perfect for everyday living. The spacious bedroom offers room to relax and includes generous closet space. Th
Key facts
- Covered parking
- Two secure gates
- Well-kept grounds
Tags
Property features AI
Finance
- Other: Located near Quail Springs Mall; north of Penn Avenue and south of NW 150th Street; Occupied: No; Home warranty: No
- Financial info: Not assumable
- HOA & community: Mandatory association dues; Association fee $2,700 — includes garbage, common area maintenance, exterior maintenance, recreation facility
Exterior
- Utilities: Living area reported from assessor
- Home design: Upper-level condominium; Residential condominium; Quail Springs Condo (legal addition)
- Construction: Brick and frame construction; Composition roof; Built as existing structure
- Exterior features: Wood fencing; Corner lot
Interior
- Kitchen: Kitchen (appliances not specified)
- Bedrooms: 1 bedroom
- Bathrooms: 1 full bathroom
- Heating & cooling: Electric heating; Fireplace (1) — forced air
- Interior features: One living area; Living room; Balcony
- Laundry & utility: No study; Slab foundation (utility access typical for slab)
Neighborhood map
What this means for you Summary
Snapshot
- This is a 1-bed/1.0-bath condo listed at $115k.
Deal economics
- At list price, monthly cash flow is $-121 ($-1k/yr) — negative.
- To cash-flow at today's rent, offer at most $98k (15.2% below list).
- To meet the 1% rule (rent ≥ 1% of price), the offer needs to be $114k (1.1% below list).
- Recommended offer: $98k (15.2% below list) — sets the bar for cash-flow.
- Cap rate 5.0% vs local median 3.7% in Oklahoma City — top-decile yield for the area; either an underpriced asset or a hidden risk that comps aren't pricing in. Stress-test before assuming the spread holds.
Location & tenants
- Location reads 80/100 on livability (#3 in OK, #1,635 nationally) — a professional / high-income tenant draw. Strengths: amenities A+, commute A+, cost of living A+; Watch: crime F.
- Edmond (suburban): math 38% / reading 40% proficiency, ranked #11 of 270 in OK (top 4%) — families likely to look elsewhere, expect single-tenant / working-renter base with shorter leases.
- Zoned schools: Angie Debo Es (math 32% / reading 27%, grade F, #255 of 845 statewide, top 35%, 579 students, 0% FRL); Summit Ms (math 22% / reading 27%, grade F, #97 of 345 statewide, top 31%, 940 students, 0% FRL); Santa Fe Hs (math 36% / reading 52%, grade F, #18 of 447 statewide, top 4%, 2,796 students, 0% FRL) — zoned schools average 0% FRL vs 22% district-wide (22 pts lower); this property's tenant base skews higher-income than the district average.
- Market conditions: Rents rising fast (+5.2%/yr); 42 active listings in the ZIP; 16 comparable units currently listed for rent nearby; rentals leasing fast (median 4d on market — plan ~1-2 weeks tenant-placement turnaround); 5,365 units permitted in Oklahoma County in 2024 (569 in 5+ unit buildings).
Forward outlook
- In year one you build about $4k of equity ($795 loan paydown + $3k appreciation (2.7% local appreciation)).
- Oklahoma County population projected at +41% by 2050 — long-run rental-demand tailwind backs the buy-and-hold thesis.
- By year 9, paydown + projected appreciation supports a ~$33k cash-out refi (75% LTV) — recoverable capital for the next deal without selling this one.
Negotiation context
- It's been on market 209 days — a 12% lower offer ($101k) is reasonable based on typical stale-listing flexibility.
- 2 sale attempts since 18y ago with the ask held roughly flat each time — persistent listings suggest the price (not the market) is what's stuck; bring a comps-based counter.
Risks & watch-outs
- Climate carrying-cost: extreme-heat days projected 7→19/yr by 2055 (HVAC capex compounding) — expect insurance premiums to compound above CPI over the hold.
Questions for the listing agent
- What do current leases actually rent for vs. the listed asking? Can we see a recent rent roll and the last 12 months of T-12 income?
- It's been on market 209 days. Have you received any prior offers? Is the seller open to a 15% concession, seller financing, or rate buy-down credit?
- What does the HOA fee cover, when was the last increase, and are there any pending special assessments or reserve-fund shortfalls?
- Any open or pending special assessments — roof, HVAC, plumbing, elevator, façade? What's the per-unit balance and payoff schedule, and is the seller paying it off at close or rolling it to the buyer?
- Why hasn't it sold? Are there any deal-killer items the seller is aware of (foundation, flood, title, zoning, code violations)?
- Is there a deadline driving the sale (1031 exchange, divorce, estate, relocation)? That informs how much negotiation room exists.
- Schools are F-rated, which usually means shorter tenancies and higher turnover. Who's the typical renter profile here, and what's been the actual vacancy rate?
- Crime grade is F in this area — have there been break-ins, vandalism, or insurance claims at this property in the last 3 years? What carrier currently insures it and at what premium?
- The area grade is low — what's the realistic commute time and amenity access for the typical tenant pool here? Any planned neighborhood developments (good or bad) we should know about?
- What's the average days-on-market for RENTAL listings here right now (not sales)? A rising rental-DOM trend means longer vacancies and softer asking-rent achievability than the comps imply.
- What's the recent tenant-quality profile in this submarket — average credit score on applications, eviction rate, late-payment / NSF rate, and stable-employment percentage? A property-management company in the area should have these aggregated.
- How much new apartment / multifamily construction is in the pipeline within 1–3 miles? Heavy new supply (>2% of stock underway) typically softens rents 12–24 months out; light construction supports rent growth.
Investment metrics
- 1% rule
- 0.99% ✗
- Cap rate
- 5.03%
- Cash-on-cash
- -4.50%
- DSCR
- 0.80
- GRM
- 8.4
CMA / ARV
No comps found within radius.
Projected returns pro-forma
2.71% appreciation · 5.21% rent growth · sell at horizon
- IRR
- 3.9%
- Equity multiple
- 1.22×
- Total profit
- $7,166
- Equity at exit
- $49,864
- IRR
- 8.6%
- Equity multiple
- 2.33×
- Total profit
- $42,854
- Equity at exit
- $75,441
Cash invested: $32,200 (down + closing). Projections, not guarantees.
Landlord ↔ Tenant lean methodology
- Overall (STATE)
- 83 Strongly Landlord-Friendly
- State Oklahoma
- 83 Strongly Landlord-Friendly · R+20
- County
- — inherits STATE
- City
- — inherits STATE
ZIP-level market 73134
- Home prices YoY
- 1.2%
- Rents YoY
- 5.2%
- Active inventory
- 42
- Price-to-rent
- 8.4×
Monthly cashflow live
- Estimated rent
- $1,138 high interval (Pro) →
- Mortgage (P&I)
- −$603
- Tax est. 1.5%
- −$144 /mo · $1,725/yr
- Insurance
- −$48
- HOA
- −$225
- Vacancy / Maint / Mgmt
- −$239
- Net cashflow
- $-121
Break-even live
Sensitivity live
| Price | -10% $-41 | -5% $-81 | +0% $-121 | +5% $-161 | +10% $-200 |
|---|---|---|---|---|---|
| Rent | -10% $-211 | -5% $-166 | +0% $-121 | +5% $-76 | +10% $-31 |
| Rate | -1.0pp $-63 | -0.5pp $-92 | base $-121 | +0.5pp $-151 | +1.0pp $-181 |
UW: 25.0% down · 7.5% · 30yr · 1.5% tax · 5.0% vac · 8.0% maint · 8.0% mgmt
Financing live
Cash to close
- Down payment
- $28,750
- Closing costs
- $3,450
- Reserves months
- —
- Total cash needed
- —
Loan-product check · same deal, 3 products live
Conventional
25% down · 7.5% · 30yr
- Down + closing
- —
- Monthly P&I
- —
- Monthly cashflow
- —
- DSCR
- —
- Eligible?
- —
Personal DTI + credit; lowest rate.
DSCR
20% down · 8.5% · 30yr
- Down + closing
- —
- Monthly P&I
- —
- Monthly cashflow
- —
- DSCR
- —
- Eligible?
- —
No personal income docs; deal must DSCR.
Hard money
10% down · 12.0% · 12mo
- Down + closing
- —
- Monthly P&I
- —
- Monthly cashflow
- —
- DSCR
- —
- Eligible?
- —
Short-term bridge; refi at stabilization.
Rent comps 16 comps
| Address | Beds | Baths | Sqft | Rent | $/sqft | DOM | Units | Dist |
|---|---|---|---|---|---|---|---|---|
| 14201 N Kentucky Ave Oklahoma City, OK | 1.0–2.0 | 1.0–2.0 | 905 | $1,628 | $1.80 | 3d | 18 | 0.27mi |
| 2300 NW 145th St Oklahoma City, OK | 1.0–3.0 | 1.0–2.0 | 1000 | $1,615 | $1.61 | 3d | 12 | 0.28mi |
| 14900 N Pennsylvania Ave Oklahoma City, OK | 1.0–3.0 | 1.0–2.0 | 1027 | $1,010 | $0.98 | 3d | 19 | 0.28mi |
| 14300 N Pennsylvania Ave Oklahoma City, OK | 1.0–2.0 | 1.0–2.0 | 844 | $799 | $0.95 | 3d | 1 | 0.37mi |
| 14712 Mezzaluna Blvd Oklahoma City, OK | 1.0–2.0 | 1.0–2.0 | 898 | $1,299 | $1.45 | 25d | 25 | 0.58mi |
| 2701 Watermark Blvd Oklahoma City, OK | 1.0–3.0 | 1.0–2.0 | 1047 | $1,161 | $1.11 | 3d | 19 | 0.74mi |
| 14300 N May Ave Oklahoma City, OK | 1.0–3.0 | 1.0–2.0 | 923 | $890 | $0.96 | 4d | 15 | 0.84mi |
| 13600 N Blackwelder Ave Oklahoma City, OK | 3.0 | 1.0–2.0 | 850 | $1,348 | $1.58 | 3d | 27 | 0.85mi |
| 14200 N May Ave Oklahoma City, OK | 1.0–3.0 | 1.0–2.0 | 1031 | $880 | $0.85 | 3d | 17 | 0.89mi |
| 2609 Featherstone Rd Oklahoma City, OK | 1.0–2.0 | 1.0–2.0 | 769 | $699 | $0.91 | 3d | 34 | 0.99mi |
| 12701 N Pennsylvania Ave Oklahoma City, OK | 3.0 | 1.0–2.0 | 912 | $1,122 | $1.23 | 3d | 15 | 1.11mi |
| 12831 Stratford Dr Oklahoma City, OK | 1.0–3.0 | 1.0–2.0 | 1122 | $854 | $0.76 | 3d | 22 | 1.11mi |
| 3101 NW 150th St Oklahoma City, OK | 1.0–2.0 | 1.0–2.0 | 811 | $895 | $1.10 | 3d | 12 | 1.31mi |
| 2301 NW 122nd St Oklahoma City, OK | 1.0 | 1.0 | 723 | $940 | $1.30 | 3d | 28 | 1.40mi |
| 2201 NW 122nd St Oklahoma City, OK | — | 1.0 | 520 | $767 | $1.48 | 45d | 1 | 1.40mi |
| 2401 NW 122nd St Oklahoma City, OK | 1.0–2.0 | 1.0–2.0 | 844 | $749 | $0.89 | 25d | 1 | 1.44mi |
HOA detail condo
- Monthly dues
- $225 · $2,700/yr
- Likely covers
- security
- Assessments
- None detected in remarks — confirm with the listing agent.
Listing history 16 events
-
2026-06-21days on market $115,000 Active 209 DOM
-
2026-06-18days on market $115,000 Active 206 DOM
-
2026-06-17days on market $115,000 Active 205 DOM
-
2026-06-16days on market $115,000 Active 204 DOM
-
2026-06-15days on market $115,000 Active 203 DOM
-
2026-06-13days on market $115,000 Active 201 DOM
-
2026-06-09days on market $115,000 Active 197 DOM
-
2026-06-08days on market $115,000 Active 196 DOM
-
2026-06-07days on market $115,000 Active 195 DOM
-
2026-06-03days on market $115,000 Active 191 DOM
-
2026-06-02days on market $115,000 Active 190 DOM
-
2026-06-01days on market $115,000 Active 189 DOM
-
2026-05-31days on market $115,000 Active 188 DOM
-
2025-11-24$115,000 Active
-
2008-05-14historical
-
2008-04-03$43,750
ⓘ Source: listings_history table (triggers on properties + properties_extension) + one-shot
backfill from property_details.listing_events for pre-trigger history.
Climate risk First Street
- Flood 1/10 Low FEMA zone X (unshaded) · 0% chance over 30 yrs
- Wildfire 2/10 Low
- Heat 6/10 Major 7 d/yr ≥108°F today · 19 d/yr by 30 yrs out
- Wind 2/10 Low 4% chance of damaging wind over 30 yrs
- Air quality 2/10 Low 1 unhealthy d/yr today · 1 by 30 yrs out
Nearby sold comps map
Loading sold comps map…
Walkable amenities ~0.75 mi
Loading nearby amenities…
Taxation est. · year 1
- Rental income
- $13,655
- − Mortgage interest
- −$6,442
- − Property taxes
- −$1,725
- − Insurance
- −$575
- − Repairs & maintenance
- −$1,092
- − Management
- −$1,092
- − HOA
- −$2,700
- − Depreciation
- −$3,345
- Taxable loss
- −$3,317
- Est. tax savings @ 24.0%
- +$796
- After-tax cash flow
- $-654/yr
For passive investors: Depreciation is non-cash, so a rental often shows a tax loss while cash-flowing — sheltering income. Rental losses are passive: they offset passive income freely, and up to $25,000/yr can offset ordinary (W-2) income if you actively participate and your MAGI is under $100k (phasing out to $0 by $150k); unused losses carry forward. On sale, claimed depreciation is recaptured at up to 25%, and gains may owe capital-gains tax (a 1031 exchange can defer both). Figures are a year-1 estimate at your 24.0% rate — not tax advice; consult a CPA.
Schools (NCES district)
- District
- Edmond
- NCES district ID
- 4010590
- Math proficiency
- 38% ▼ -12.00%
- Reading proficiency
- 40% ▼ -12.00%
- Median HH income
- $73,212
- Composite
- 35.88/100
- National rank
- #4814
- State rank
- #11 of 270 in OK
Livability — Oklahoma City
- Score
- 80/100
- State rank
- #3
- US rank
- #1635
Category grades
Schools grade is shown separately in the Schools card above.
Census & demographics
- Census place
- Oklahoma City, OK
- County
- Oklahoma County · 771,644 people
- City population
- 498,656
- Metro
- Oklahoma City, OK
- Population (ZIP)
- 7,522
- Household income
- $66,307
- Rent vs Own
- Severe rent burden
- 934.0
Population outlook (Oklahoma County) Hauer SSP2
- Today (2025)
- 911,875 people
- By 2030
- 982,413 · +7.7%
- By 2040
- 1,130,468 · +24.0%
- By 2050
- 1,288,422 · +41.3%
- By 2075
- 1,711,482 · +87.7%
- By 2100
- 2,088,448 · +129.0%
Race, ethnicity, and origin ACS 2023
- Neighborhood character
- Diverse neighborhood (Simpson 0.69)
- Race & ethnicity
- White 49% Black 20% Hispanic / Latino 14% Two or more races 8% Asian 7% Native American 4%
- Hispanic origin (detail)
- Mexican 12%
- Common ancestry
- Iranian 2% Italian 2% Lithuanian 1%
- Foreign-born
- 10% · Canada, Vietnam
- Languages at home
- 86% English-only · Spanish 7% Other Indo-European 2% Vietnamese 2%
Political lean MEDSL · Oklahoma
- 2024 margin
- Toss-up / Even · D 48.0% · R 49.7% · Other 2.3%
- 2008→2024 swing
- +15.1pp toward D · 2008: -16.8pp · 2024: -1.7pp
- All cycles
- 2024: R+1.7 2020: R+1.1 2016: R+10.5 2012: R+16.7 2008: R+16.8
Not yet ingested
- Civics
- —
Market trends
- HPI YoY
- ▲ 2.71%
- Current HPI
- 219.5373
- Rent YoY
- ▲ 5.21%
- Metro
- Oklahoma City, OK
- State GDP YoY
- ▲ 1.55%
- F500 in state
- 6
Industry mix (Fortune 500 HQ in OK)
| Industry | F500 HQs | Revenue |
|---|---|---|
| Energy | 3 | $48B |
|
||
Price history
+162.9% since first listed3 events — show timeline
- 2025-11-24 Listed $115,000 MLSOK
- 2008-05-14 Listing Removed — MLSOK
- 2008-04-03 Listed $43,750 MLSOK
Cash-flow waterfall
monthlySold comps — $/sqft
last 12 mo · ≤1 miLoading sold comps…