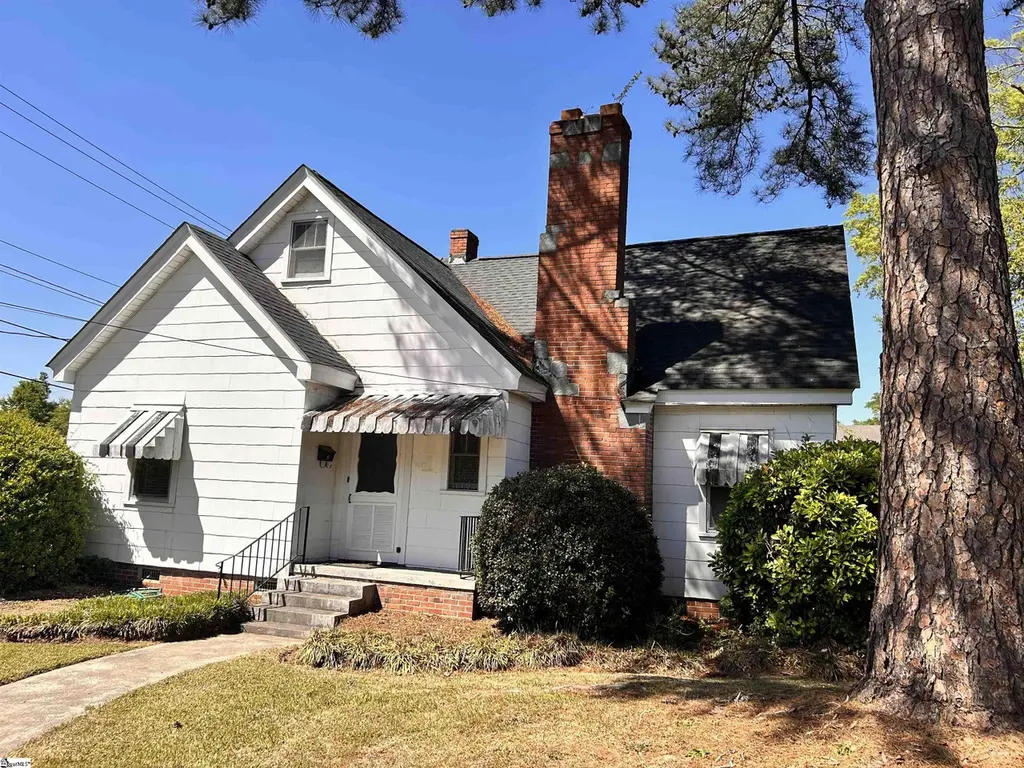
116 W Centennial St · Clinton, SC
Flood risk 1/10 · Minimal
- FEMA flood zone
- X (unshaded)
- Chance of flooding over 30 yrs
- 0.0%
- Est. flood insurance / yr
- $507 – $1,088
Fire risk 3/10 · Minor
- Est. fire insurance / yr
- $783 – $1,453
Heat risk 6/10 · Moderate
- Hot days now (above 106°F)
- 7 days/yr
- Hot days in 30 yrs
- 16 days/yr
Wind risk 4/10 · Minor
- Chance of severe wind over 30 yrs
- 15.0%
Air-quality risk 3/10 · Minor
- Unhealthy air days now
- 3 days/yr
- Unhealthy air days in 30 yrs
- 4 days/yr
Risk factors via First Street. Map © Google.
Why this score? — see what drove the C grade
The composite is a weighted blend of 9 inputs, each scored 0–100. Each bar is that input's sub-score; the figure is the points it added to the 100-point composite (weight × sub-score).
- Cash flow +24.0/30.0
- DSCR +7.8/10.0
- ARV discount +7.5/15.0
- 1% rule +7.3/10.0
- Schools +3.1/10.0
- Livability +2.8/5.0
- Rent growth +2.5/5.0
- Condition / age +2.5/5.0
- Appreciation +0.0/10.0
$70,000
🖨 Deal sheet 📄 Offer letter ✓ Due diligence
Listing remarks
Home to be sold As-Is. Built in the 40's, this is a charming home! It currently has one bedroom and one bath but a wall was taken down at some point to create an open space where there was another bedroom. There is also a small room in the attic that was used as a bedroom that has a gas heater. This room is not included in square footage. Roof is 10 years or less old. Family would love to see it brought back to its original beauty! As-is only.
Key facts
- 7,405 sq ft lot
- Garage
Neighborhood map
What this means for you Summary
Snapshot
- This is a 1-bed/1.0-bath other listed at $70k.
Deal economics
- At list price, monthly cash flow is $138 ($2k/yr) — positive.
- The deal already cash-flows at list — no discount required.
- Meets the 1% rule at list price ($860 rent vs $70k).
- Cap rate 8.7% vs local median 5.1% in Clinton — top-decile yield for the area; either an underpriced asset or a hidden risk that comps aren't pricing in. Stress-test before assuming the spread holds.
Location & tenants
- Location reads 56/100 on livability (#296 in SC) — a working-class tenant base; expect higher turnover. Strengths: cost of living A+, housing A+; Watch: crime F, amenities F, commute F.
- Laurens 56 (rural): math 35% / reading 40% proficiency, ranked #38 of 80 in SC (top 48%) — families likely to look elsewhere, expect single-tenant / working-renter base with shorter leases; 73% free/reduced lunch — lower-income household profile, screen leases tightly.
- Zoned schools: Clinton Elementary (math 41% / reading 38%, grade F, #295 of 597 statewide, top 50%, 383 students, 100% FRL) — zoned schools average 100% FRL vs 73% district-wide (27 pts higher); higher-poverty schools than district average — tighter screening recommended.
- Market conditions: 128 active listings in the ZIP; 2 comparable units currently listed for rent nearby; 621 units permitted in Laurens County in 2024 (0 in 5+ unit buildings).
Forward outlook
- Local home prices are declining (-3.0%/yr); year-one equity from $484 of loan paydown is wiped out by about $2k of value loss. Plan a longer hold.
- Laurens County population projected to shrink 7% by 2050 — rents likely to lag national; underwrite the cash flow, not the appreciation.
Negotiation context
- Only 0 days on market — expect competitive offers; lowballing is unlikely to land.
Risks & watch-outs
- Climate carrying-cost: extreme-heat days projected 7→16/yr by 2055 (HVAC capex compounding) — expect insurance premiums to compound above CPI over the hold.
Questions for the listing agent
- Is there a deadline driving the sale (1031 exchange, divorce, estate, relocation)? That informs how much negotiation room exists.
- Schools are D-rated, which usually means shorter tenancies and higher turnover. Who's the typical renter profile here, and what's been the actual vacancy rate?
- Crime grade is F in this area — have there been break-ins, vandalism, or insurance claims at this property in the last 3 years? What carrier currently insures it and at what premium?
- What's the average days-on-market for RENTAL listings here right now (not sales)? A rising rental-DOM trend means longer vacancies and softer asking-rent achievability than the comps imply.
- What's the recent tenant-quality profile in this submarket — average credit score on applications, eviction rate, late-payment / NSF rate, and stable-employment percentage? A property-management company in the area should have these aggregated.
- How much new for-sale + rental construction is in the pipeline within 1–3 miles? Heavy new supply typically softens prices + rents 12–24 months out; constrained supply supports both.
Investment metrics
- 1% rule
- 1.23% ✓
- Cap rate
- 8.65%
- Cash-on-cash
- 8.43%
- DSCR
- 1.38
- GRM
- 6.8
CMA / ARV
No comps found within radius.
Projected returns pro-forma
-3.0% appreciation · 3.0% rent growth · sell at horizon
- IRR
- -3.4%
- Equity multiple
- 0.87×
- Total profit
- $-2,525
- Equity at exit
- $10,437
- IRR
- 6.3%
- Equity multiple
- 1.47×
- Total profit
- $9,291
- Equity at exit
- $6,052
Cash invested: $19,600 (down + closing). Projections, not guarantees.
Landlord ↔ Tenant lean methodology
- Overall (STATE)
- 90 Strongly Landlord-Friendly
- State South Carolina
- 90 Strongly Landlord-Friendly · R+6
- County
- — inherits STATE
- City
- — inherits STATE
ZIP-level market 29325
- Active inventory
- 128
- Price-to-rent
- 6.8×
Monthly cashflow live
- Estimated rent
- $860 medium interval (Pro) →
- Mortgage (P&I)
- −$367
- Tax from tax record
- −$145 /mo · $1,741/yr
- Insurance
- −$29
- HOA
- −$0
- Vacancy / Maint / Mgmt
- −$180
- Net cashflow
- $138
Break-even live
UW: 25.0% down · 7.5% · 30yr · 1.5% tax · 5.0% vac · 8.0% maint · 8.0% mgmt
Financing live
Cash to close
- Down payment
- $17,500
- Closing costs
- $2,100
- Reserves months
- —
- Total cash needed
- —
Loan-product check · same deal, 3 products live
Conventional
25% down · 7.5% · 30yr
- Down + closing
- —
- Monthly P&I
- —
- Monthly cashflow
- —
- DSCR
- —
- Eligible?
- —
Personal DTI + credit; lowest rate.
DSCR
20% down · 8.5% · 30yr
- Down + closing
- —
- Monthly P&I
- —
- Monthly cashflow
- —
- DSCR
- —
- Eligible?
- —
No personal income docs; deal must DSCR.
Hard money
10% down · 12.0% · 12mo
- Down + closing
- —
- Monthly P&I
- —
- Monthly cashflow
- —
- DSCR
- —
- Eligible?
- —
Short-term bridge; refi at stabilization.
Rent comps 2 comps
| Address | Beds | Baths | Sqft | Rent | $/sqft | DOM | Units | Dist |
|---|---|---|---|---|---|---|---|---|
| 101 Clay St Clinton, SC | 1.0 | 1.0 | 700 | $808 | $1.15 | 10d | 1 | 0.32mi |
| 100 Clintion Manor Dr Clinton, SC | 1.0–4.0 | 1.0–2.5 | 921 | $1,035 | $1.12 | 10d | 1 | 1.41mi |
Listing history 2 events
-
2026-04-13$70,000
-
2026-04-13historical
ⓘ Source: listings_history table (triggers on properties + properties_extension) + one-shot
backfill from property_details.listing_events for pre-trigger history.
Tax reassessment forecast SC · Resets to sale price
- Current annual tax
- $1,741 · $145/mo
- Projected year-2 tax
- $1,741 · $145/mo
- Expected delta
- $0/yr ($0/mo · 0.0%)
ⓘ Screening estimate from a state-policy table — verify with the county assessor before closing.
Climate risk First Street
- Flood 1/10 Low FEMA zone X (unshaded) · 0% chance over 30 yrs
- Wildfire 3/10 Moderate
- Heat 6/10 Major 7 d/yr ≥106°F today · 16 d/yr by 30 yrs out
- Wind 4/10 Moderate 15% chance of damaging wind over 30 yrs
- Air quality 3/10 Moderate 3 unhealthy d/yr today · 4 by 30 yrs out
Nearby sold comps map
Loading sold comps map…
Walkable amenities ~0.75 mi
Loading nearby amenities…
Taxation est. · year 1
- Rental income
- $10,314
- − Mortgage interest
- −$3,921
- − Property taxes
- −$1,741
- − Insurance
- −$350
- − Repairs & maintenance
- −$825
- − Management
- −$825
- − Depreciation
- −$2,036
- Taxable income
- $616
- Est. tax owed @ 24.0%
- −$148
- After-tax cash flow
- $1,505/yr
For passive investors: Depreciation is non-cash, so a rental often shows a tax loss while cash-flowing — sheltering income. Rental losses are passive: they offset passive income freely, and up to $25,000/yr can offset ordinary (W-2) income if you actively participate and your MAGI is under $100k (phasing out to $0 by $150k); unused losses carry forward. On sale, claimed depreciation is recaptured at up to 25%, and gains may owe capital-gains tax (a 1031 exchange can defer both). Figures are a year-1 estimate at your 24.0% rate — not tax advice; consult a CPA.
Schools (NCES district)
- District
- Laurens 56
- NCES district ID
- 4502640
- Math proficiency
- 35% ▼ -5.00%
- Reading proficiency
- 40% ▲ 3.00%
- Median HH income
- $35,830
- Composite
- 31.05/100
- National rank
- #6079
- State rank
- #38 of 80 in SC
Livability — Clinton
- Score
- 56/100
- State rank
- #296
- US rank
- #22922
Category grades
Schools grade is shown separately in the Schools card above.
Census & demographics
- Census place
- Clinton, SC
- City population
- 14,164
- Population (ZIP)
- 14,164
Population outlook (Laurens County) Hauer SSP2
- Today (2025)
- 66,741 people
- By 2030
- 66,454 · -0.4%
- By 2040
- 64,881 · -2.8%
- By 2050
- 61,941 · -7.2%
- By 2075
- 53,266 · -20.2%
- By 2100
- 41,495 · -37.8%
Race, ethnicity, and origin ACS 2023
- Neighborhood character
- Majority White (59%)
- Race & ethnicity
- White 59% Black 33% Two or more races 4% Hispanic / Latino 3%
- Common ancestry
- Serbian 3% Slovak 2% Lithuanian 1%
- Foreign-born
- 2% · Canada
- Languages at home
- 96% English-only · Spanish 2%
Political lean MEDSL · Laurens
- 2024 margin
- Solid R (+40.9) · D 29.0% · R 69.9% · Other 1.1%
- 2008→2024 swing
- -22.8pp toward R · 2008: -18.1pp · 2024: -40.9pp
- All cycles
- 2024: R+40.9 2020: R+32.3 2016: R+29.9 2012: R+17.5 2008: R+18.1
Not yet ingested
- Civics
- —
Market trends
- HPI YoY
- ▼ -86.54%
- Current HPI
- 150.1573
- Rent YoY
- —
- Metro
- —
- State GDP YoY
- ▲ 4.51%
- F500 in state
- 2
Industry mix (Fortune 500 HQ in SC)
| Industry | F500 HQs | Revenue |
|---|---|---|
| Packaging | 1 | $7B |
|
||
Price history
2 events — show timeline
- 2026-04-13 Listing Removed — Greater Greenville MLS
- 2026-04-13 Listed $70,000 Greater Greenville MLS
Property tax history
+1.8%/yrLatest (2025): $1,741 · +1.7% YoY. Source: county tax records.
Cash-flow waterfall
monthlySold comps — $/sqft
last 12 mo · ≤1 miLoading sold comps…