 🏗️ New Construction
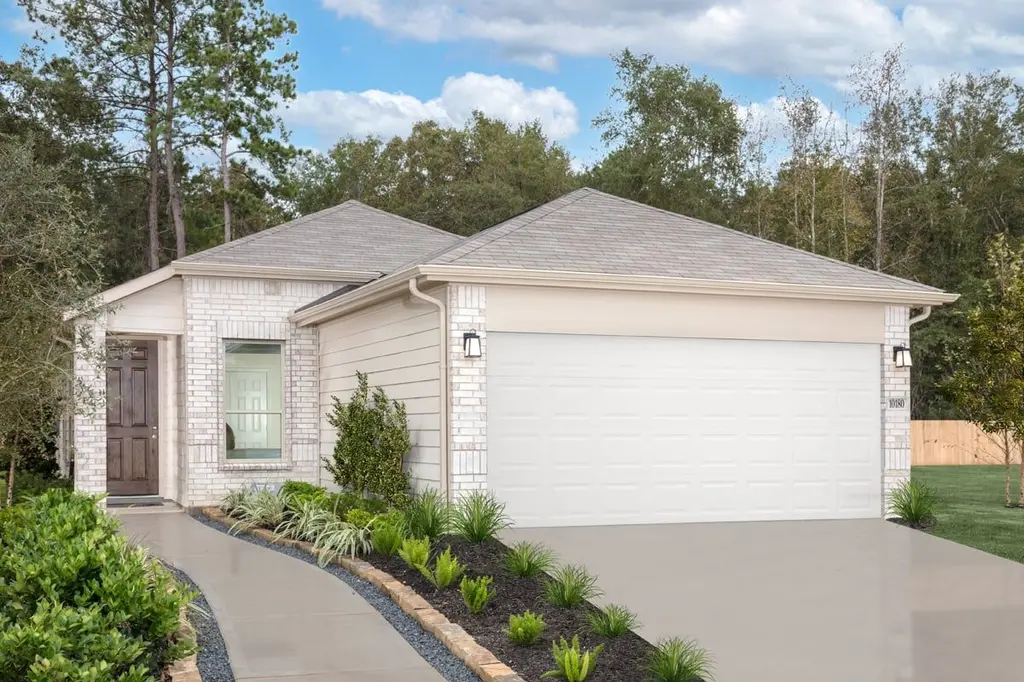
Plan 1242 Plan · Fresno, TX
Flood risk 6/10 · Moderate
- FEMA flood zone
- X (unshaded)
- Chance of flooding over 30 yrs
- 0.71%
- Est. flood insurance / yr
- $507 – $1,088
Fire risk 4/10 · Minor
- Est. fire insurance / yr
- $1,222 – $2,270
Heat risk 9/10 · Severe
- Hot days now (above 110°F)
- 7 days/yr
- Hot days in 30 yrs
- 21 days/yr
Wind risk 9/10 · Severe
- Chance of severe wind over 30 yrs
- 99.0%
Air-quality risk 3/10 · Minor
- Unhealthy air days now
- 2 days/yr
- Unhealthy air days in 30 yrs
- 3 days/yr
Risk factors via First Street. Map © Google.
Why this score? — see what drove the D+ grade
The composite is a weighted blend of 9 inputs, each scored 0–100. Each bar is that input's sub-score; the figure is the points it added to the 100-point composite (weight × sub-score).
- Cash flow +15.1/30.0
- ARV discount +7.5/15.0
- DSCR +4.6/10.0
- Schools +4.5/10.0
- 1% rule +4.2/10.0
- Appreciation +4.0/10.0
- Condition / age +4.0/5.0
- Livability +3.1/5.0
- Rent growth +2.3/5.0
$257,995
🖨 Deal sheet (PDF) 📄 Offer letter ✓ Due diligence
Listing remarks MLS
* Eat-in kitchen * Extra storage space * Front porch * Open floor plan * Granite kitchen countertops * Dedicated laundry room * Gas range * 5-panel interior doors * Smart thermostat * WaterSense® labeled faucets * Low-E windows * ENERGY STAR® certified home * Splash pad * Community park * Playground * Near local schools * Commuter-friendly location * Great shopping nearby
Key facts
- Extra storage space
- Front porch
- Eat-in kitchen
Tags
Neighborhood map
What this means for you Summary
Snapshot
- This is a 3-bed/2.0-bath single-family listed at $258k. Condition is rated good.
Deal economics
- At list price, monthly cash flow is $92 ($1k/yr) — positive.
- The deal already cash-flows at list — no discount required.
- To meet the 1% rule (rent ≥ 1% of price), the offer needs to be $254k (1.5% below list).
- Recommended offer: $227k (12.0% below list) — sets the bar for market timing.
- Cap rate 6.7% vs local median 5.3% in Fresno — meaningfully above typical; check what's discounted (condition, days-on-market, listing class) to confirm the premium yield is real.
Location & tenants
- Location reads 62/100 on livability (#943 in TX) — a middle-class / working-renter tenant base. Strengths: employment A+, housing A+, cost of living A; Watch: crime C-, amenities F, commute F.
- Fort Bend ISD (suburban): math 44% / reading 53% proficiency, ranked #140 of 826 in TX (top 17%) — families likely to look elsewhere, expect single-tenant / working-renter base with shorter leases.
- Zoned schools: Blue Ridge El (math 8% / reading 17%, grade F, #4,180 of 4,322 statewide, top 97%, 263 students, 89% FRL); Christa Mcauliffe Middle (math 9% / reading 20%, grade F, #1,583 of 1,662 statewide, top 96%, 835 students, 94% FRL); Willowridge H S (math 12% / reading 29%, grade F, #1,389 of 1,632 statewide, top 86%, 1,319 students, 87% FRL) — zoned schools average 90% FRL vs 35% district-wide (55 pts higher); higher-poverty schools than district average — tighter screening recommended.
- Zoned-school proficiency averages 16% at this address vs 48% district-wide (-33 pts) — the specific schools serving this property underperform the Fort Bend ISD average; the district grade overstates school quality for this exact location.
- Market conditions: Rents soft (-0.9%/yr); 177 active listings in the ZIP; 2 comparable units currently listed for rent nearby; solid renter incomes; 12,093 units permitted in Fort Bend County in 2024 (815 in 5+ unit buildings).
- This rent runs 32% of the median local income ($94k/yr) — at the standard rent-burdened threshold; future hikes will face affordability resistance.
Forward outlook
- Local home prices are declining (-2.0%/yr); year-one equity from $2k of loan paydown is wiped out by about $5k of value loss. Plan a longer hold.
- Fort Bend County population projected at +75% by 2050 — long-run rental-demand tailwind backs the buy-and-hold thesis.
Negotiation context
- It's been on market 219 days — a 12% lower offer ($227k) is reasonable based on typical stale-listing flexibility.
Risks & watch-outs
- Climate carrying-cost: major flood risk; severe wind risk, 99% chance of damaging wind over 30y; extreme-heat days projected 7→21/yr by 2055 (HVAC capex compounding) — expect insurance premiums to compound above CPI over the hold.
Questions for the listing agent
- It's been on market 219 days. Have you received any prior offers? Is the seller open to a 12% concession, seller financing, or rate buy-down credit?
- Why hasn't it sold? Are there any deal-killer items the seller is aware of (foundation, flood, title, zoning, code violations)?
- Is there a deadline driving the sale (1031 exchange, divorce, estate, relocation)? That informs how much negotiation room exists.
- Schools are D-rated, which usually means shorter tenancies and higher turnover. Who's the typical renter profile here, and what's been the actual vacancy rate?
- The area grade is low — what's the realistic commute time and amenity access for the typical tenant pool here? Any planned neighborhood developments (good or bad) we should know about?
- What's the average days-on-market for RENTAL listings here right now (not sales)? A rising rental-DOM trend means longer vacancies and softer asking-rent achievability than the comps imply.
- What's the recent tenant-quality profile in this submarket — average credit score on applications, eviction rate, late-payment / NSF rate, and stable-employment percentage? A property-management company in the area should have these aggregated.
- How much new for-sale + rental construction is in the pipeline within 1–3 miles? Heavy new supply typically softens prices + rents 12–24 months out; constrained supply supports both.
Investment metrics
- 1% rule
- 0.92% ✗
- Cap rate
- 6.69%
- Cash-on-cash
- 1.42%
- DSCR
- 1.06
- GRM
- 9.1
CMA / ARV
- ARV (median comp)
- $277,259
- List price
- $257,995
- Delta
- -6.95%
- Verdict
- FAIR
- Comps
- 20 within 1.0 mi
Show comp detail 9 sales within ~0.75 mi
| Address | Dist | Beds/Ba | Sqft | Sold | Price | $/sf | Match |
|---|---|---|---|---|---|---|---|
| 2826 Lyra Ct | 0.30mi | 3/2.0 | 1,234 (-1%) | 9mo | $259,995 | $211 | 78 |
| 1514 Grand Olympia Dr | 0.27mi | 3/2.0 | 1,360 (+10%) | 6mo | $294,995 | $217 | 66 |
| 3327 Bremerton Falls Dr | 0.62mi | 3/2.0 | 1,295 (+4%) | 1mo | $235,000 | $181 | 63 |
| 1519 Grand Olympia Dr | 0.22mi | 4/2.0 (+1) | 1,360 (+10%) | 8mo | $282,608 | $208 | 62 |
| 3035 Kalimera Ln | 0.16mi | 3/2.0 | 1,360 (+10%) | 21mo | $292,789 | $215 | 59 |
| 3011 Elassona Ln | 0.16mi | 3/2.0 | 1,360 (+10%) | 23mo | $292,696 | $215 | 57 |
| 3323 Aegean Dr | 0.66mi | 3/2.0 | 1,376 (+11%) | 1mo | $247,400 | $180 | 51 |
| 3303 Oaklawn Place Dr | 0.58mi | 3/2.0 | 1,295 (+4%) | 24mo | $275,000 | $212 | 46 |
| 2630 Argos Dr | 0.73mi | 3/2.0 | 1,376 (+11%) | 17mo | $220,000 | $160 | 34 |
Match score weights: distance 35% · size 25% · config 20% · recency 20%. Top-matched comps best support the ARV.
Projected returns pro-forma
-1.98% appreciation · 0.0% rent growth · sell at horizon
- IRR
- -11.5%
- Equity multiple
- 0.56×
- Total profit
- $-34,503
- Equity at exit
- $54,095
- IRR
- -7.6%
- Equity multiple
- 0.48×
- Total profit
- $-40,444
- Equity at exit
- $46,465
Cash invested: $77,633 (down + closing). Projections, not guarantees.
Landlord ↔ Tenant lean methodology
- Overall (STATE)
- 87 Strongly Landlord-Friendly
- State Texas
- 87 Strongly Landlord-Friendly · R+5
- County
- — inherits STATE
- City
- — inherits STATE
ZIP-level market 77545
- Home prices YoY
- -0.8%
- Rents YoY
- -0.9%
- Active inventory
- 177
- Price-to-rent
- 8.5×
Monthly cashflow live
- Estimated rent
- $2,542 medium interval (Pro) →
- Mortgage (P&I)
- −$1,454
- Tax est. 1.5%
- −$347 /mo · $4,159/yr
- Insurance
- −$116
- HOA
- −$0
- Vacancy / Maint / Mgmt
- −$534
- Net cashflow
- $92
Break-even live
Sensitivity live
| Price | -10% $283 | -5% $188 | +0% $92 | +5% $-4 | +10% $-100 |
|---|---|---|---|---|---|
| Rent | -10% $-109 | -5% $-9 | +0% $92 | +5% $192 | +10% $293 |
| Rate | -1.0pp $231 | -0.5pp $162 | base $92 | +0.5pp $20 | +1.0pp $-53 |
UW: 25.0% down · 7.5% · 30yr · 1.5% tax · 5.0% vac · 8.0% maint · 8.0% mgmt
Financing live
Cash to close
- Down payment
- $69,315
- Closing costs
- $8,318
- Reserves months
- —
- Total cash needed
- —
Loan-product check · same deal, 3 products live
Conventional
25% down · 7.5% · 30yr
- Down + closing
- —
- Monthly P&I
- —
- Monthly cashflow
- —
- DSCR
- —
- Eligible?
- —
Personal DTI + credit; lowest rate.
DSCR
20% down · 8.5% · 30yr
- Down + closing
- —
- Monthly P&I
- —
- Monthly cashflow
- —
- DSCR
- —
- Eligible?
- —
No personal income docs; deal must DSCR.
Hard money
10% down · 12.0% · 12mo
- Down + closing
- —
- Monthly P&I
- —
- Monthly cashflow
- —
- DSCR
- —
- Eligible?
- —
Short-term bridge; refi at stabilization.
Rent comps 2 comps
| Address | Beds | Baths | Sqft | Rent | $/sqft | DOM | Units | Dist |
|---|---|---|---|---|---|---|---|---|
| 1055 Memorial Bend Blvd Missouri City, TX | 1.0–2.0 | 1.0–2.0 | 994 | $2,514 | $2.53 | 0d | 118 | 0.72mi |
| 3235 Becker Glen St Fresno, TX | 3.0 | 2.0 | 1284 | $1,786 | $1.39 | 0d | 1 | 1.37mi |
Listing history 23 events
-
2026-06-21days on market $257,995 Active 219 DOM
-
2026-06-18days on market $257,995 Active 216 DOM
-
2026-06-17days on market $257,995 Active 215 DOM
-
2026-06-16days on market $257,995 Active 214 DOM
-
2026-06-15days on market $257,995 Active 213 DOM
-
2026-06-13days on market $257,995 Active 211 DOM
-
2026-06-09days on market $257,995 Active 207 DOM
-
2026-06-07pricedays on market $257,995 Active 205 DOM
-
2026-06-04days on market $255,995 Active 202 DOM
-
2026-06-03days on market $255,995 Active 201 DOM
-
2026-06-02days on market $255,995 Active 200 DOM
-
2026-06-01days on market $255,995 Active 199 DOM
-
2026-05-31days on market $255,995 Active 198 DOM
-
2026-05-16price $255,995 417-char remark
Show marketing remark (417 chars)
* Eat-in kitchen * Extra storage space * Front porch * Open floor plan * Granite kitchen countertops * Dedicated laundry room * Gas range * 5-panel interior doors * Smart thermostat * WaterSense® labeled faucets * Low-E windows * ENERGY STAR® certified home * Splash pad * Community park * Playground * Near local schools * Commuter-friendly location * Great shopping nearby
-
2026-05-10price $253,995 417-char remark
Show marketing remark (417 chars)
* Eat-in kitchen * Extra storage space * Front porch * Open floor plan * Granite kitchen countertops * Dedicated laundry room * Gas range * 5-panel interior doors * Smart thermostat * WaterSense® labeled faucets * Low-E windows * ENERGY STAR® certified home * Splash pad * Community park * Playground * Near local schools * Commuter-friendly location * Great shopping nearby
-
2026-05-09price $262,995 417-char remark
Show marketing remark (417 chars)
* Eat-in kitchen * Extra storage space * Front porch * Open floor plan * Granite kitchen countertops * Dedicated laundry room * Gas range * 5-panel interior doors * Smart thermostat * WaterSense® labeled faucets * Low-E windows * ENERGY STAR® certified home * Splash pad * Community park * Playground * Near local schools * Commuter-friendly location * Great shopping nearby
-
2026-04-18price $251,995 417-char remark
Show marketing remark (417 chars)
* Eat-in kitchen * Extra storage space * Front porch * Open floor plan * Granite kitchen countertops * Dedicated laundry room * Gas range * 5-panel interior doors * Smart thermostat * WaterSense® labeled faucets * Low-E windows * ENERGY STAR® certified home * Splash pad * Community park * Playground * Near local schools * Commuter-friendly location * Great shopping nearby
-
2026-04-11price $249,995 417-char remark
Show marketing remark (417 chars)
* Eat-in kitchen * Extra storage space * Front porch * Open floor plan * Granite kitchen countertops * Dedicated laundry room * Gas range * 5-panel interior doors * Smart thermostat * WaterSense® labeled faucets * Low-E windows * ENERGY STAR® certified home * Splash pad * Community park * Playground * Near local schools * Commuter-friendly location * Great shopping nearby
-
2026-03-28price $247,995 417-char remark
Show marketing remark (417 chars)
* Eat-in kitchen * Extra storage space * Front porch * Open floor plan * Granite kitchen countertops * Dedicated laundry room * Gas range * 5-panel interior doors * Smart thermostat * WaterSense® labeled faucets * Low-E windows * ENERGY STAR® certified home * Splash pad * Community park * Playground * Near local schools * Commuter-friendly location * Great shopping nearby
-
2026-03-07price $245,995 417-char remark
Show marketing remark (417 chars)
* Eat-in kitchen * Extra storage space * Front porch * Open floor plan * Granite kitchen countertops * Dedicated laundry room * Gas range * 5-panel interior doors * Smart thermostat * WaterSense® labeled faucets * Low-E windows * ENERGY STAR® certified home * Splash pad * Community park * Playground * Near local schools * Commuter-friendly location * Great shopping nearby
-
2026-01-22price $242,995 417-char remark
Show marketing remark (417 chars)
* Eat-in kitchen * Extra storage space * Front porch * Open floor plan * Granite kitchen countertops * Dedicated laundry room * Gas range * 5-panel interior doors * Smart thermostat * WaterSense® labeled faucets * Low-E windows * ENERGY STAR® certified home * Splash pad * Community park * Playground * Near local schools * Commuter-friendly location * Great shopping nearby
-
2025-11-18price $252,995 417-char remark
Show marketing remark (417 chars)
* Eat-in kitchen * Extra storage space * Front porch * Open floor plan * Granite kitchen countertops * Dedicated laundry room * Gas range * 5-panel interior doors * Smart thermostat * WaterSense® labeled faucets * Low-E windows * ENERGY STAR® certified home * Splash pad * Community park * Playground * Near local schools * Commuter-friendly location * Great shopping nearby
-
2025-11-14$247,995 Active 417-char remark
Show marketing remark (417 chars)
* Eat-in kitchen * Extra storage space * Front porch * Open floor plan * Granite kitchen countertops * Dedicated laundry room * Gas range * 5-panel interior doors * Smart thermostat * WaterSense® labeled faucets * Low-E windows * ENERGY STAR® certified home * Splash pad * Community park * Playground * Near local schools * Commuter-friendly location * Great shopping nearby
ⓘ Source: listings_history table (triggers on properties + properties_extension) + one-shot
backfill from property_details.listing_events for pre-trigger history.
Climate risk First Street
- Flood 6/10 Major FEMA zone X (unshaded) · 71% chance over 30 yrs
- Wildfire 4/10 Moderate
- Heat 9/10 Extreme 7 d/yr ≥110°F today · 21 d/yr by 30 yrs out
- Wind 9/10 Extreme 99% chance of damaging wind over 30 yrs
- Air quality 3/10 Moderate 2 unhealthy d/yr today · 3 by 30 yrs out
Nearby sold comps map
Loading sold comps map…
Walkable amenities ~0.75 mi
Loading nearby amenities…
Taxation est. · year 1
- Rental income
- $30,499
- − Mortgage interest
- −$15,531
- − Property taxes
- −$4,159
- − Insurance
- −$1,386
- − Repairs & maintenance
- −$2,440
- − Management
- −$2,440
- − Depreciation
- −$8,066
- Taxable loss
- −$3,523
- Est. tax savings @ 24.0%
- +$845
- After-tax cash flow
- $1,947/yr
For passive investors: Depreciation is non-cash, so a rental often shows a tax loss while cash-flowing — sheltering income. Rental losses are passive: they offset passive income freely, and up to $25,000/yr can offset ordinary (W-2) income if you actively participate and your MAGI is under $100k (phasing out to $0 by $150k); unused losses carry forward. On sale, claimed depreciation is recaptured at up to 25%, and gains may owe capital-gains tax (a 1031 exchange can defer both). Figures are a year-1 estimate at your 24.0% rate — not tax advice; consult a CPA.
Condition & rehab AI · 1 photo
This home is in excellent condition with no visible repairs needed. It offers a good ROI with updates focusing on curb appeal and energy efficiency.
Value-add opportunities
- Both Paint exterior siding — Enhances curb appeal and value
- Both Replace low-E windows with newer, more energy-efficient ones — Improves energy efficiency and reduces utility costs
- Both Install smart home security system — Enhances safety and adds modern amenities
Renovation cost estimate screening
Value-add ROI direction
- Both Paint exterior siding — Enhances curb appeal and value ↑
- Both Replace low-E windows with newer, more energy-efficient ones — Improves energy efficiency and reduces utility costs ↑
- Both Install smart home security system — Enhances safety and adds modern amenities ↑
ⓘ Cost ranges are severity-bucket heuristics (US national rule-of-thumb). Get contractor quotes + a written scope before underwriting a rehab budget.
Schools (NCES district)
- District
- Fort Bend ISD
- NCES district ID
- 4819650
- Math proficiency
- 44% ▼ -15.00%
- Reading proficiency
- 53% ▼ -4.00%
- Median HH income
- $82,360
- Composite
- 44.61/100
- National rank
- #2779
- State rank
- #140 of 826 in TX
Livability — Fresno
- Score
- 62/100
- State rank
- #943
- US rank
- #16815
Category grades
Schools grade is shown separately in the Schools card above.
Census & demographics
- Census place
- Fresno, TX
- County
- Fort Bend County · 836,777 people
- City population
- 26,236
- Metro
- Houston-The Woodlands-Sugar Land, TX
- Population (ZIP)
- 26,236
- Household income
- $94,474
- Rent vs Own
- Severe rent burden
- 360.0
Population outlook (Fort Bend County) Hauer SSP2
- Today (2025)
- 1,004,526 people
- By 2030
- 1,153,104 · +14.8%
- By 2040
- 1,453,718 · +44.7%
- By 2050
- 1,753,781 · +74.6%
- By 2075
- 2,455,772 · +144.5%
- By 2100
- 2,930,528 · +191.7%
Race, ethnicity, and origin ACS 2023
- Neighborhood character
- Diverse neighborhood (Simpson 0.61)
- Race & ethnicity
- Black 51% Hispanic / Latino 34% Two or more races 12% White 8% Asian 2%
- Hispanic origin (detail)
- Mexican 29%
- Common ancestry
- Portuguese 1%
- Foreign-born
- 18% · Canada
- Languages at home
- 67% English-only · Spanish 29% Other Asian/Pacific 1% Other Indo-European 1%
Political lean MEDSL · Fort Bend
- 2024 margin
- Toss-up / Even · D 49.5% · R 47.9% · Other 2.6%
- 2008→2024 swing
- +4.0pp toward D · 2008: -2.4pp · 2024: 1.6pp
- All cycles
- 2024: D+1.6 2020: D+10.6 2016: D+6.6 2012: R+6.8 2008: R+2.4
Not yet ingested
- Civics
- —
Market trends
- HPI YoY
- ▼ -1.98%
- Current HPI
- 231.3921
- Rent YoY
- ▼ -0.95%
- Metro
- Houston-The Woodlands-Sugar Land, TX
- State GDP YoY
- ▲ 3.95%
- F500 in state
- 110
Industry mix (Fortune 500 HQ in TX)
| Industry | F500 HQs | Revenue |
|---|---|---|
| Energy | 16 | $1,198B |
|
||
| Technology | 5 | $198B |
|
||
| Engineering / Construction | 4 | $72B |
|
||
| Energy Services | 3 | $60B |
|
||
| Utilities | 3 | $41B |
|
||
| Healthcare | 2 | $330B |
|
||
Price history
+3.2% since first listed10 events — show timeline
- 2026-05-16 Price Changed $255,995 Zillow
- 2026-05-10 Price Changed $253,995 Zillow
- 2026-05-09 Price Changed $262,995 Zillow
- 2026-04-18 Price Changed $251,995 Zillow
- 2026-04-11 Price Changed $249,995 Zillow
- 2026-03-28 Price Changed $247,995 Zillow
- 2026-03-07 Price Changed $245,995 Zillow
- 2026-01-22 Price Changed $242,995 Zillow
- 2025-11-18 Price Changed $252,995 Zillow
- 2025-11-14 Listed $247,995 Zillow
Cash-flow waterfall
monthlySold comps — $/sqft
last 12 mo · ≤1 miLoading sold comps…