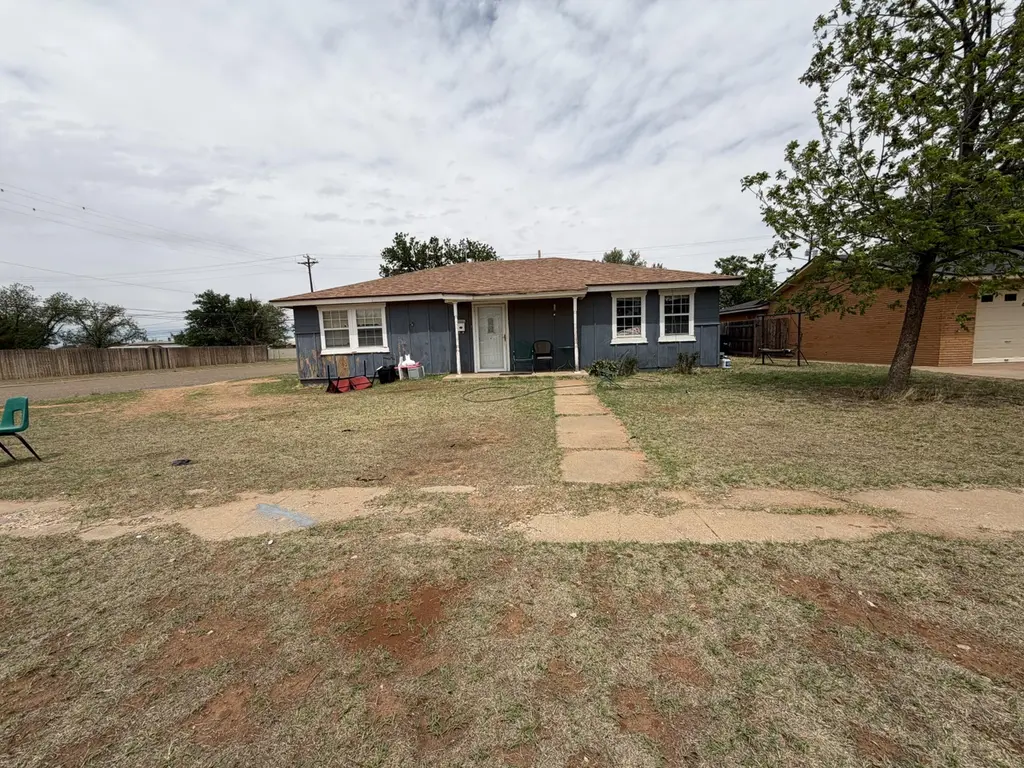
1101 E Reppto St · Brownfield, TX
Flood risk 1/10 · Minimal
- FEMA flood zone
- —
- Chance of flooding over 30 yrs
- 0.0%
- Est. flood insurance / yr
- —
Fire risk 1/10 · Minimal
- Est. fire insurance / yr
- $1,222 – $2,270
Heat risk 5/10 · Moderate
- Hot days now (above 99°F)
- 7 days/yr
- Hot days in 30 yrs
- 19 days/yr
Wind risk 2/10 · Minimal
- Chance of severe wind over 30 yrs
- 1.0%
Air-quality risk 1/10 · Minimal
- Unhealthy air days now
- 0 days/yr
- Unhealthy air days in 30 yrs
- 0 days/yr
Risk factors via First Street. Map © Google.
Why this score? — see what drove the C+ grade
The composite is a weighted blend of 9 inputs, each scored 0–100. Each bar is that input's sub-score; the figure is the points it added to the 100-point composite (weight × sub-score).
- Cash flow +25.4/30.0
- 1% rule +8.7/10.0
- DSCR +8.4/10.0
- ARV discount +7.5/15.0
- Livability +3.6/5.0
- Rent growth +2.5/5.0
- Condition / age +2.5/5.0
- Schools +2.2/10.0
- Appreciation +0.0/10.0
$85,000
🖨 Deal sheet 📄 Offer letter ✓ Due diligence
Listing remarks
Looking for an affordable opportunity in the growing market of homes for sale in Brownfield, TX? This property offers a chance to create something of your own while building equity in an established area. Situated on a spacious lot with a functional layout, this home is ideal for buyers ready to personalize a space or investors seeking a value-add opportunity. With some updates and vision, the potential here is easy to see. Conveniently located just minutes from Brownfield Regional Medical Center for everyday peace of mind, as well as Brownfield City Park for outdoor space and recreation. You're also close to local favorites like Taqueria Jalisco and Grill 54, making dining and daily conven
Key facts
- 0.24 acre lot
- Built 1958
- Listed 54 days
Property features AI
Exterior
- Parking: No parking
- Utilities: Public water; Public sewer; Electricity available; Cable available; Phone available
- Home design: Single-family residence; Residential property
- Construction: Wood siding exterior; Composition roof; Slab foundation; Built on a 0.24-acre lot
- Exterior features: Private yard; Fenced backyard with wood fencing; Paved road access
Interior
- Flooring: Tile floors
- Bathrooms: 2 full bathrooms
- Heating & cooling: Central heating; Central air; Ceiling fans
- Interior features: Ceiling fans
Neighborhood map
What this means for you Summary
Snapshot
- This is a 4-bed/2.0-bath single-family listed at $85k.
Deal economics
- At list price, monthly cash flow is $197 ($2k/yr) — positive.
- The deal already cash-flows at list — no discount required.
- Meets the 1% rule at list price ($1k rent vs $85k).
- Recommended offer: $82k (3.0% below list) — sets the bar for market timing.
Location & tenants
- Location reads 71/100 on livability (#298 in TX) — a middle-class / working-renter tenant base. Strengths: cost of living A+, housing A+, health & safety A+; Watch: crime D+, amenities D, commute F.
- Brownfield ISD (town): math 26% / reading 27% proficiency, ranked #704 of 826 in TX (top 85%) — low school quality limits family demand, transient renter base, plan for 1-2y turnover; 70% free/reduced lunch — lower-income household profile, screen leases tightly.
- Zoned schools: Brownfield Middle (math 24% / reading 28%, grade F, #1,222 of 1,662 statewide, top 74%, 354 students, 83% FRL); Brownfield H S (math 37% / reading 32%, grade F, #963 of 1,632 statewide, top 61%, 443 students, 78% FRL).
- Market conditions: 89 active listings in the ZIP; 2 comparable units currently listed for rent nearby; 2 units permitted in Terry County in 2024 (0 in 5+ unit buildings).
Forward outlook
- Local home prices are declining (-3.0%/yr); year-one equity from $588 of loan paydown is wiped out by about $3k of value loss. Plan a longer hold.
- Terry County population projected at +16% by 2050 — long-run rental-demand tailwind backs the buy-and-hold thesis.
Negotiation context
- It's been on market 55 days — a 3% lower offer ($82k) is reasonable based on typical stale-listing flexibility.
Risks & watch-outs
- Watch-outs: property tax is 3.4% of price; built in 1958 — expect roof / HVAC / electrical / plumbing capex.
- Climate carrying-cost: extreme-heat days projected 7→19/yr by 2055 (HVAC capex compounding) — expect insurance premiums to compound above CPI over the hold.
Questions for the listing agent
- It's been on market 55 days. Have you received any prior offers? Is the seller open to a 3% concession, seller financing, or rate buy-down credit?
- Built in 1958 — when were the roof, HVAC, electrical panel, plumbing, and water heater last replaced?
- Property tax is high relative to price — has the assessment been appealed recently, and will the sale trigger a re-assessment?
- Is there a deadline driving the sale (1031 exchange, divorce, estate, relocation)? That informs how much negotiation room exists.
- Schools are F-rated, which usually means shorter tenancies and higher turnover. Who's the typical renter profile here, and what's been the actual vacancy rate?
- Crime grade is D in this area — have there been break-ins, vandalism, or insurance claims at this property in the last 3 years? What carrier currently insures it and at what premium?
- What's the average days-on-market for RENTAL listings here right now (not sales)? A rising rental-DOM trend means longer vacancies and softer asking-rent achievability than the comps imply.
- What's the recent tenant-quality profile in this submarket — average credit score on applications, eviction rate, late-payment / NSF rate, and stable-employment percentage? A property-management company in the area should have these aggregated.
- How much new for-sale + rental construction is in the pipeline within 1–3 miles? Heavy new supply typically softens prices + rents 12–24 months out; constrained supply supports both.
Investment metrics
- 1% rule
- 1.37% ✓
- Cap rate
- 9.07%
- Cash-on-cash
- 9.93%
- DSCR
- 1.44
- GRM
- 6.1
CMA / ARV
No comps found within radius.
Projected returns pro-forma
-3.0% appreciation · 3.0% rent growth · sell at horizon
- IRR
- -1.3%
- Equity multiple
- 0.95×
- Total profit
- $-1,132
- Equity at exit
- $12,674
- IRR
- 8.5%
- Equity multiple
- 1.65×
- Total profit
- $15,568
- Equity at exit
- $7,349
Cash invested: $23,800 (down + closing). Projections, not guarantees.
Landlord ↔ Tenant lean methodology
- Overall (STATE)
- 87 Strongly Landlord-Friendly
- State Texas
- 87 Strongly Landlord-Friendly · R+5
- County
- — inherits STATE
- City
- — inherits STATE
ZIP-level market 79316
- Active inventory
- 89
- Price-to-rent
- 6.1×
Monthly cashflow live
- Estimated rent
- $1,161 medium interval (Pro) →
- Mortgage (P&I)
- −$446
- Tax from tax record
- −$239 /mo · $2,873/yr
- Insurance
- −$35
- HOA
- −$0
- Vacancy / Maint / Mgmt
- −$244
- Net cashflow
- $197
Break-even live
UW: 25.0% down · 7.5% · 30yr · 1.5% tax · 5.0% vac · 8.0% maint · 8.0% mgmt
Financing live
Cash to close
- Down payment
- $21,250
- Closing costs
- $2,550
- Reserves months
- —
- Total cash needed
- —
Loan-product check · same deal, 3 products live
Conventional
25% down · 7.5% · 30yr
- Down + closing
- —
- Monthly P&I
- —
- Monthly cashflow
- —
- DSCR
- —
- Eligible?
- —
Personal DTI + credit; lowest rate.
DSCR
20% down · 8.5% · 30yr
- Down + closing
- —
- Monthly P&I
- —
- Monthly cashflow
- —
- DSCR
- —
- Eligible?
- —
No personal income docs; deal must DSCR.
Hard money
10% down · 12.0% · 12mo
- Down + closing
- —
- Monthly P&I
- —
- Monthly cashflow
- —
- DSCR
- —
- Eligible?
- —
Short-term bridge; refi at stabilization.
Rent comps 2 comps
| Address | Beds | Baths | Sqft | Rent | $/sqft | DOM | Units | Dist |
|---|---|---|---|---|---|---|---|---|
| 1006 E Lons St Brownfield, TX | 3.0 | 2.0 | 1356 | $1,050 | $0.77 | 43d | 1 | 0.11mi |
| 1707 Gillham Dr Brownfield, TX | 3.0 | 2.0 | 2064 | $1,800 | $0.87 | 43d | 1 | 0.75mi |
Listing history 18 events
-
2026-06-18days on market $85,000 Active 55 DOM
-
2026-06-17days on market $85,000 Active 54 DOM
-
2026-06-16days on market $85,000 Active 53 DOM
-
2026-06-15days on market $85,000 Active 52 DOM
-
2026-06-13days on market $85,000 Active 50 DOM
-
2026-06-12days on market $85,000 Active 49 DOM
-
2026-06-09days on market $85,000 Active 46 DOM
-
2026-06-08days on market $85,000 Active 45 DOM
-
2026-06-08days on market $85,000 Active 44 DOM
-
2026-06-07days on market $85,000 Active 43 DOM
-
2026-06-03days on market $85,000 Active 40 DOM
-
2026-06-02days on market $85,000 Active 39 DOM
-
2026-06-01days on market $85,000 Active 38 DOM
-
2026-05-31days on market $85,000 Active 37 DOM
-
2026-05-12price $85,000 909-char remark
-
2026-04-24$95,000 Active 909-char remark
-
2008-07-23soldstatus
-
2007-11-02soldstatus
ⓘ Source: listings_history table (triggers on properties + properties_extension) + one-shot
backfill from property_details.listing_events for pre-trigger history.
Tax reassessment forecast TX · Resets to sale price
- Current annual tax
- $2,873 · $239/mo
- Projected year-2 tax
- $2,873 · $239/mo
- Expected delta
- $0/yr ($0/mo · 0.0%)
ⓘ Screening estimate from a state-policy table — verify with the county assessor before closing.
Climate risk First Street
- Flood 1/10 Low 0% chance over 30 yrs
- Wildfire 1/10 Low
- Heat 5/10 Major 7 d/yr ≥99°F today · 19 d/yr by 30 yrs out
- Wind 2/10 Low 100% chance of damaging wind over 30 yrs
- Air quality 1/10 Low 0 unhealthy d/yr today · 0 by 30 yrs out
Nearby sold comps map
Loading sold comps map…
Walkable amenities ~0.75 mi
Loading nearby amenities…
Taxation est. · year 1
- Rental income
- $13,937
- − Mortgage interest
- −$4,761
- − Property taxes
- −$2,873
- − Insurance
- −$425
- − Repairs & maintenance
- −$1,115
- − Management
- −$1,115
- − Depreciation
- −$2,473
- Taxable income
- $1,175
- Est. tax owed @ 24.0%
- −$282
- After-tax cash flow
- $2,081/yr
For passive investors: Depreciation is non-cash, so a rental often shows a tax loss while cash-flowing — sheltering income. Rental losses are passive: they offset passive income freely, and up to $25,000/yr can offset ordinary (W-2) income if you actively participate and your MAGI is under $100k (phasing out to $0 by $150k); unused losses carry forward. On sale, claimed depreciation is recaptured at up to 25%, and gains may owe capital-gains tax (a 1031 exchange can defer both). Figures are a year-1 estimate at your 24.0% rate — not tax advice; consult a CPA.
Schools (NCES district)
- District
- Brownfield ISD
- NCES district ID
- 4811610
- Math proficiency
- 26% ▼ -11.00%
- Reading proficiency
- 27% ▲ 1.00%
- Median HH income
- $37,385
- Composite
- 22.1/100
- National rank
- #8180
- State rank
- #704 of 826 in TX
Livability — Brownfield
- Score
- 71/100
- State rank
- #298
- US rank
- #6822
Category grades
Schools grade is shown separately in the Schools card above.
Census & demographics
- Census place
- Brownfield, TX
- Population (ZIP)
- 9,907
Population outlook (Terry County) Hauer SSP2
- Today (2025)
- 13,220 people
- By 2030
- 13,500 · +2.1%
- By 2040
- 14,327 · +8.4%
- By 2050
- 15,340 · +16.0%
- By 2075
- 18,459 · +39.6%
- By 2100
- 20,433 · +54.6%
Race, ethnicity, and origin ACS 2023
- Neighborhood character
- Majority Hispanic (57%)
- Race & ethnicity
- Hispanic / Latino 57% White 37% Two or more races 32% Black 5%
- Hispanic origin (detail)
- Mexican 47%
- Common ancestry
- Italian 2% Slovak 1% German 1%
- Foreign-born
- 8% · Canada
- Languages at home
- 63% English-only · Spanish 34% German/W. Germanic 2%
Political lean MEDSL · Terry
- 2024 margin
- Solid R (+65.2) · D 17.2% · R 82.3%
- 2008→2024 swing
- -30.1pp toward R · 2008: -35.0pp · 2024: -65.2pp
- All cycles
- 2024: R+65.2 2020: R+56.9 2016: R+49.4 2012: R+41.6 2008: R+35.0
Not yet ingested
- Civics
- —
Market trends
- HPI YoY
- ▼ -65.34%
- Current HPI
- 104.1813
- Rent YoY
- —
- Metro
- —
- State GDP YoY
- ▲ 3.95%
- F500 in state
- 110
Industry mix (Fortune 500 HQ in TX)
| Industry | F500 HQs | Revenue |
|---|---|---|
| Energy | 16 | $1,198B |
|
||
| Technology | 5 | $198B |
|
||
| Engineering / Construction | 4 | $72B |
|
||
| Energy Services | 3 | $60B |
|
||
| Utilities | 3 | $41B |
|
||
| Healthcare | 2 | $330B |
|
||
Price history
-10.5% since first listed4 events — show timeline
- 2026-05-12 Price Changed $85,000 LARMLS
- 2026-04-24 Listed $95,000 LARMLS
- 2008-07-23 Sold (Public Records) — Public Records
- 2007-11-02 Sold (Public Records) — Public Records
Property tax history
+11.3%/yrLatest (2025): $2,873 · +12.4% YoY. Source: county tax records.
Cash-flow waterfall
monthlySold comps — $/sqft
last 12 mo · ≤1 miLoading sold comps…