9544 Rhodes Ct · Salem, MI
Flood risk No data
- FEMA flood zone
- —
- Chance of flooding over 30 yrs
- %
- Est. flood insurance / yr
- —
Fire risk No data
- Est. fire insurance / yr
- —
Heat risk No data
- Hot days now (above °F)
- days/yr
- Hot days in 30 yrs
- days/yr
Wind risk No data
- Chance of severe wind over 30 yrs
- %
Air-quality risk No data
- Unhealthy air days now
- days/yr
- Unhealthy air days in 30 yrs
- days/yr
Risk factors via First Street. Map © Google.
Why this score? — see what drove the C+ grade
The composite is a weighted blend of 9 inputs, each scored 0–100. Each bar is that input's sub-score; the figure is the points it added to the 100-point composite (weight × sub-score).
- Cash flow +30.0/30.0
- 1% rule +10.0/10.0
- DSCR +10.0/10.0
- Schools +4.7/10.0
- Rent growth +3.5/5.0
- Livability +2.5/5.0
- Condition / age +2.5/5.0
- ARV discount +0.1/15.0
- Appreciation +0.0/10.0
$75,000
🖨 Deal sheet 📄 Offer letter ✓ Due diligence
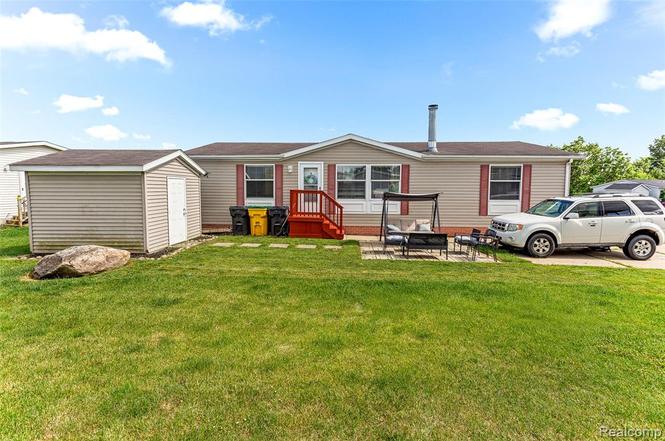
Listing remarks
Welcome to 9544 Rhodes Court, this is very nice three bedroom two bath one story ranch manufactured home that has a open floor plan, spacious rooms, neutral decor, this home has approximately 1,400 feet, storage shed is also included, great school district, located close to schools shopping and freeways.
Key facts
- Open floor plan
- Close to schools
- Close to freeways
Tags
Neighborhood map
What this means for you Summary
Snapshot
- This is a 3-bed/2.0-bath single-family listed at $75k.
Deal economics
- At list price, monthly cash flow is $296 ($4k/yr) — positive.
- The deal already cash-flows at list — no discount required.
- Meets the 1% rule at list price ($2k rent vs $75k).
Location & tenants
- Location reads: area grade C — affects rentability + tenant quality, not the cash-flow math above.
- South Lyon Community Schools (suburban): math 46% / reading 59% proficiency, ranked #74 of 540 in MI (top 14%) — acceptable for families but not a draw, mixed tenant base, ~2y average lease; only 16% free/reduced lunch — higher-income household profile.
- Market conditions: Rents rising (+4.0%/yr); 213 active listings in the ZIP; 1 comparable units currently listed for rent nearby; high-income renter base; 996 units permitted in Washtenaw County in 2024 (492 in 5+ unit buildings).
Forward outlook
- Local home prices are declining (-3.0%/yr); year-one equity from $519 of loan paydown is wiped out by about $2k of value loss. Plan a longer hold.
- Washtenaw County population projected at +25% by 2050 — long-run rental-demand tailwind backs the buy-and-hold thesis.
- At projected returns (-3.0% appreciation + 4.0% rent growth), your $21k cash investment doubles in ~7 years — after that, you're playing with house money.
Negotiation context
- Only 1 days on market — expect competitive offers; lowballing is unlikely to land.
Risks & watch-outs
- Watch-outs: HOA is 41% of rent.
Questions for the listing agent
- What does the HOA fee cover, when was the last increase, and are there any pending special assessments or reserve-fund shortfalls?
- Is there a deadline driving the sale (1031 exchange, divorce, estate, relocation)? That informs how much negotiation room exists.
- What's the average days-on-market for RENTAL listings here right now (not sales)? A rising rental-DOM trend means longer vacancies and softer asking-rent achievability than the comps imply.
- What's the recent tenant-quality profile in this submarket — average credit score on applications, eviction rate, late-payment / NSF rate, and stable-employment percentage? A property-management company in the area should have these aggregated.
- How much new for-sale + rental construction is in the pipeline within 1–3 miles? Heavy new supply typically softens prices + rents 12–24 months out; constrained supply supports both.
Investment metrics
- 1% rule
- 2.89% ✓
- Cap rate
- 11.03%
- Cash-on-cash
- 16.91%
- DSCR
- 1.75
- GRM
- 2.9
CMA / ARV
- ARV (on-the-fly)
- $64,400
- Comps found
- 5
Show comp detail 5 sales within ~0.75 mi
| Address | Dist | Beds/Ba | Sqft | Sold | Price | $/sf | Match |
|---|---|---|---|---|---|---|---|
| 9692 Keynes | 0.13mi | 3/2.0 | 1,456 (+4%) | 23mo | $65,000 | $45 | 68 |
| 3106 Cromwell St | 0.20mi | 3/2.0 | 1,456 (+4%) | 20mo | $67,000 | $46 | 68 |
| 2875 Verona Dr | 0.26mi | 3/2.0 | 1,500 (+7%) | 14mo | $88,000 | $59 | 65 |
| 9600 Astor | 0.13mi | 3/2.0 | 1,568 (+12%) | 18mo | $85,000 | $54 | 59 |
| 8175 Eaton Dr | 0.29mi | 3/2.0 | 1,600 (+14%) | 6mo | $65,000 | $41 | 58 |
Match score weights: distance 35% · size 25% · config 20% · recency 20%. Top-matched comps best support the ARV.
Projected returns pro-forma
-3.0% appreciation · 3.97% rent growth · sell at horizon
- IRR
- 11.0%
- Equity multiple
- 1.45×
- Total profit
- $9,421
- Equity at exit
- $11,183
- IRR
- 21.9%
- Equity multiple
- 3.09×
- Total profit
- $43,806
- Equity at exit
- $6,485
Cash invested: $21,000 (down + closing). Projections, not guarantees.
Landlord ↔ Tenant lean methodology
- Overall (STATE)
- 62 Landlord-Friendly
- State Michigan
- 62 Landlord-Friendly · EVEN
- County
- — inherits STATE
- City
- — inherits STATE
ZIP-level market 48167
- Rents YoY
- 4.0%
- Active inventory
- 213
- Price-to-rent
- 2.9×
Monthly cashflow live
- Estimated rent
- $2,170 medium interval (Pro) →
- Mortgage (P&I)
- −$393
- Tax est. 1.5%
- −$94 /mo · $1,125/yr
- Insurance
- −$31
- HOA
- −$900
- Vacancy / Maint / Mgmt
- −$456
- Net cashflow
- $296
Break-even live
UW: 25.0% down · 7.5% · 30yr · 1.5% tax · 5.0% vac · 8.0% maint · 8.0% mgmt
Financing live
Cash to close
- Down payment
- $18,750
- Closing costs
- $2,250
- Reserves months
- —
- Total cash needed
- —
Loan-product check · same deal, 3 products live
Conventional
25% down · 7.5% · 30yr
- Down + closing
- —
- Monthly P&I
- —
- Monthly cashflow
- —
- DSCR
- —
- Eligible?
- —
Personal DTI + credit; lowest rate.
DSCR
20% down · 8.5% · 30yr
- Down + closing
- —
- Monthly P&I
- —
- Monthly cashflow
- —
- DSCR
- —
- Eligible?
- —
No personal income docs; deal must DSCR.
Hard money
10% down · 12.0% · 12mo
- Down + closing
- —
- Monthly P&I
- —
- Monthly cashflow
- —
- DSCR
- —
- Eligible?
- —
Short-term bridge; refi at stabilization.
Rent comps 1 comps
| Address | Beds | Baths | Sqft | Rent | $/sqft | DOM | Units | Dist |
|---|---|---|---|---|---|---|---|---|
| 9800 Bloomsbury Cir Northville, MI | 3.0 | 2.0 | 1456 | $1,629 | $1.12 | 2d | 1 | 0.16mi |
HOA detail
- Monthly dues
- $900 · $10,800/yr
Listing history 2 events
-
2026-06-19remarks 305-char remark
-
2026-06-19$75,000 Active 1 DOM
ⓘ Source: listings_history table (triggers on properties + properties_extension) + one-shot
backfill from property_details.listing_events for pre-trigger history.
Nearby sold comps map
Loading sold comps map…
Walkable amenities ~0.75 mi
Loading nearby amenities…
Taxation est. · year 1
- Rental income
- $26,040
- − Mortgage interest
- −$4,201
- − Property taxes
- −$1,125
- − Insurance
- −$375
- − Repairs & maintenance
- −$2,083
- − Management
- −$2,083
- − HOA
- −$10,800
- − Depreciation
- −$2,182
- Taxable income
- $3,190
- Est. tax owed @ 24.0%
- −$766
- After-tax cash flow
- $2,786/yr
For passive investors: Depreciation is non-cash, so a rental often shows a tax loss while cash-flowing — sheltering income. Rental losses are passive: they offset passive income freely, and up to $25,000/yr can offset ordinary (W-2) income if you actively participate and your MAGI is under $100k (phasing out to $0 by $150k); unused losses carry forward. On sale, claimed depreciation is recaptured at up to 25%, and gains may owe capital-gains tax (a 1031 exchange can defer both). Figures are a year-1 estimate at your 24.0% rate — not tax advice; consult a CPA.
Schools (NCES district)
- District
- South Lyon Community Schools
- NCES district ID
- 2632250
- Math proficiency
- 46% ▼ -10.00%
- Reading proficiency
- 59% ▼ -4.00%
- Median HH income
- $71,419
- Composite
- 46.86/100
- National rank
- #2372
- State rank
- #74 of 540 in MI
Livability — Salem
No livability data for this city. (Only ~50 U.S. cities are tracked.)
Census & demographics
- County
- Wayne County · 1,562,939 people
- Metro
- Detroit-Warren-Dearborn, MI
- Population (ZIP)
- 24,713
- Household income
- $124,630
- Rent vs Own
- Severe rent burden
- 441.0
Population outlook (Washtenaw County) Hauer SSP2
- Today (2025)
- 402,878 people
- By 2030
- 424,104 · +5.3%
- By 2040
- 464,633 · +15.3%
- By 2050
- 504,728 · +25.3%
- By 2075
- 614,463 · +52.5%
- By 2100
- 676,181 · +67.8%
Race, ethnicity, and origin ACS 2023
- Neighborhood character
- Predominantly White (78%)
- Race & ethnicity
- White 78% Asian 10% Two or more races 5% Hispanic / Latino 4% Black 4%
- Common ancestry
- Romanian 11% Lithuanian 4% Slovak 3%
- Foreign-born
- 15% · Canada, China, South Korea
- Languages at home
- 85% English-only · Other Indo-European 4% Other Asian/Pacific 3% Chinese 2%
Political lean MEDSL · Washtenaw
- 2024 margin
- Solid D (+44.4) · D 71.0% · R 26.6% · Other 2.4%
- 2008→2024 swing
- +3.5pp toward D · 2008: 41.0pp · 2024: 44.4pp
- All cycles
- 2024: D+44.4 2020: D+46.6 2016: D+41.5 2012: D+36.0 2008: D+41.0
Not yet ingested
- Civics
- —
Market trends
- HPI YoY
- ▼ -275.65%
- Current HPI
- 176.171
- Rent YoY
- ▲ 3.97%
- Metro
- Detroit-Warren-Dearborn, MI
- State GDP YoY
- ▲ 1.37%
- F500 in state
- 28
Industry mix (Fortune 500 HQ in MI)
| Industry | F500 HQs | Revenue |
|---|---|---|
| Automotive Parts | 3 | $48B |
|
||
| Automotive | 2 | $372B |
|
||
| Chemicals | 1 | $45B |
|
||
| Automotive Retail | 1 | $29B |
|
||
| Healthcare / Medical Devices | 1 | $23B |
|
||
| Automotive Technology | 1 | $20B |
|
||
Cash-flow waterfall
monthlySold comps — $/sqft
last 12 mo · ≤1 miLoading sold comps…