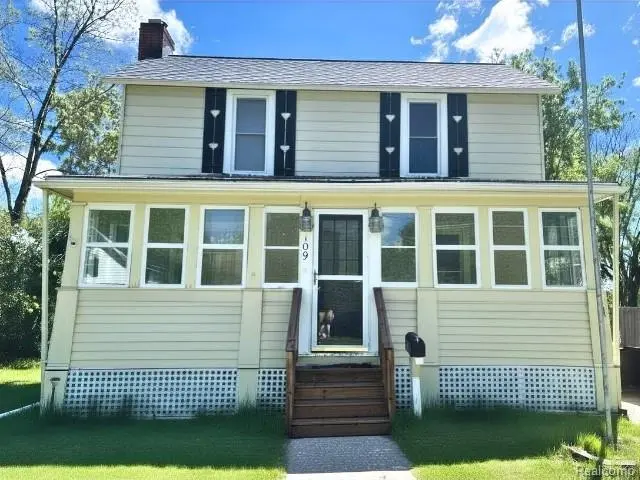
109 Cogshall St · Holly, MI
Flood risk 1/10 · Minimal
- FEMA flood zone
- X (unshaded)
- Chance of flooding over 30 yrs
- 0.0%
- Est. flood insurance / yr
- $473 – $860
Fire risk 1/10 · Minimal
- Est. fire insurance / yr
- $784 – $1,456
Heat risk 2/10 · Minimal
- Hot days now (above 96°F)
- 7 days/yr
- Hot days in 30 yrs
- 15 days/yr
Wind risk 2/10 · Minimal
- Chance of severe wind over 30 yrs
- —
Air-quality risk 3/10 · Minor
- Unhealthy air days now
- 2 days/yr
- Unhealthy air days in 30 yrs
- 3 days/yr
Risk factors via First Street. Map © Google.
Why this score? — see what drove the B- grade
The composite is a weighted blend of 9 inputs, each scored 0–100. Each bar is that input's sub-score; the figure is the points it added to the 100-point composite (weight × sub-score).
- Cash flow +25.3/30.0
- ARV discount +15.0/15.0
- DSCR +8.3/10.0
- 1% rule +7.0/10.0
- Livability +3.8/5.0
- Schools +3.7/10.0
- Rent growth +2.5/5.0
- Condition / age +2.5/5.0
- Appreciation +0.0/10.0
$159,900
🖨 Deal sheet (PDF) 📄 Offer letter ✓ Due diligence
Listing remarks MLS
Vintage farmhouse opportunity in the heart of Holly! Situated on a spacious . 58-acre lot, this 3-bedroom, 1.5-bath home is full of character and ready for your vision. Featuring a 2.5-car detached garage and plenty of room to grow, this property offers endless possibilities for investors, renovators, or buyers looking to create their dream home. Bring your ideas and imagination - with some updating, this farmhouse can truly shine. Conveniently located near downtown Holly shops, dining, and community events. Potential like this doesn't come around often!
Key facts
- Downtown holly
- Spacious lot
- Vintage farmhouse
Tags
Property features AI
Exterior
- Parking: Detached 2-car garage
- Utilities: Public water; Public sewer
- Home design: Single-family residence; Two stories; Ground-level entry with steps; Aluminum siding
- Construction: Asphalt roof
- Exterior features: Covered porch; Fenced yard; Paved road access
Interior
- Kitchen: Gas water heater
- Bathrooms: One full bathroom; One half bathroom
- Heating & cooling: Forced air heating (natural gas); No central cooling
- Interior features: Wood-burning fireplace in the living room; Full unfinished basement; Six total rooms
- Laundry & utility: Washer hookup; Electric dryer hookup
Neighborhood map
What this means for you Summary
Snapshot
- This is a 3-bed/1.0-bath single-family listed at $160k.
Deal economics
- At list price, monthly cash flow is $362 ($4k/yr) — positive.
- The deal already cash-flows at list — no discount required.
- Meets the 1% rule at list price ($2k rent vs $160k).
- Recommended offer: $158k (1.5% below list) — sets the bar for market timing.
- Cap rate 9.0% vs local median 3.5% in Holly — top-decile yield for the area; either an underpriced asset or a hidden risk that comps aren't pricing in. Stress-test before assuming the spread holds.
Location & tenants
- Location reads 75/100 on livability (#156 in MI, #3,930 nationally) — a middle-class / working-renter tenant base. Strengths: crime A+, cost of living A+, housing A+; Watch: amenities F, commute F, employment D-.
- Holly Area School District (town): math 31% / reading 52% proficiency, ranked #165 of 540 in MI (top 31%) — families likely to look elsewhere, expect single-tenant / working-renter base with shorter leases.
- Market conditions: 157 active listings in the ZIP; 2 comparable units currently listed for rent nearby; solid renter incomes; 2,614 units permitted in Oakland County in 2024 (721 in 5+ unit buildings).
Forward outlook
- Local home prices are declining (-3.0%/yr); year-one equity from $1k of loan paydown is wiped out by about $5k of value loss. Plan a longer hold.
- Oakland County population projected at +10% by 2050 — modest demand growth; plan on rents tracking national, not racing it.
Negotiation context
- It's been on market 25 days — a 2% lower offer ($158k) is reasonable based on typical stale-listing flexibility.
- 7 sale attempts since 30y ago with the ask held roughly flat each time — persistent listings suggest the price (not the market) is what's stuck; bring a comps-based counter.
- Current owner paid $61k; list at $160k implies a 162% gain — meaningful room to come down on a strong offer.
Risks & watch-outs
- Watch-outs: built in 1897 — expect roof / HVAC / electrical / plumbing capex.
Questions for the listing agent
- Built in 1897 — when were the roof, HVAC, electrical panel, plumbing, and water heater last replaced?
- Is there a deadline driving the sale (1031 exchange, divorce, estate, relocation)? That informs how much negotiation room exists.
- What's the average days-on-market for RENTAL listings here right now (not sales)? A rising rental-DOM trend means longer vacancies and softer asking-rent achievability than the comps imply.
- What's the recent tenant-quality profile in this submarket — average credit score on applications, eviction rate, late-payment / NSF rate, and stable-employment percentage? A property-management company in the area should have these aggregated.
- How much new for-sale + rental construction is in the pipeline within 1–3 miles? Heavy new supply typically softens prices + rents 12–24 months out; constrained supply supports both.
Investment metrics
- 1% rule
- 1.20% ✓
- Cap rate
- 9.01%
- Cash-on-cash
- 9.70%
- DSCR
- 1.43
- GRM
- 7.0
CMA / ARV
- ARV (on-the-fly)
- $196,458
- Comps found
- 12
Show comp detail 12 sales within ~0.75 mi
| Address | Dist | Beds/Ba | Sqft | Sold | Price | $/sf | Match |
|---|---|---|---|---|---|---|---|
| 725 E Sherman St | 0.21mi | 3/1.0 | 1,337 (-7%) | 12mo | $110,000 | $82 | 69 |
| 813 Partridge Ct | 0.16mi | 3/2.0 | 1,260 (-12%) | 1mo | $305,000 | $242 | 67 |
| 409 Fenwick St | 0.29mi | 3/2.0 | 1,442 (+1%) | 18mo | $259,999 | $180 | 66 |
| 428 Harden St | 0.42mi | 3/1.0 | 1,600 (+12%) | 7mo | $175,000 | $109 | 55 |
| 4288 N Hill Dr | 0.54mi | 3/2.0 | 1,409 (-2%) | 19mo | $38,941 | $28 | 52 |
| 810 Holly Bush Ct | 0.70mi | 2/1.5 (-1) | 1,500 (+5%) | 4mo | $415,000 | $277 | 49 |
| 433 N Saginaw St | 0.67mi | 3/2.0 | 1,336 (-7%) | 6mo | $250,000 | $187 | 49 |
| 210 Legrande St | 0.64mi | 4/2.0 (+1) | 1,483 (+3%) | 10mo | $270,000 | $182 | 47 |
| 202 Michigan St | 0.63mi | 3/1.5 | 1,534 (+7%) | 19mo | $169,000 | $110 | 41 |
| 307 N Saginaw St | 0.58mi | 2/2.0 (-1) | 1,491 (+4%) | 20mo | $205,000 | $137 | 41 |
| 407 Oakland St | 0.74mi | 3/1.0 | 1,327 (-8%) | 16mo | $180,000 | $136 | 40 |
| 109 2nd St | 0.72mi | 4/1.5 (+1) | 1,608 (+12%) | 2mo | $130,000 | $81 | 38 |
Match score weights: distance 35% · size 25% · config 20% · recency 20%. Top-matched comps best support the ARV.
Projected returns pro-forma
-3.0% appreciation · 3.0% rent growth · sell at horizon
- IRR
- -1.7%
- Equity multiple
- 0.94×
- Total profit
- $-2,813
- Equity at exit
- $23,842
- IRR
- 8.1%
- Equity multiple
- 1.61×
- Total profit
- $27,452
- Equity at exit
- $13,825
Cash invested: $44,772 (down + closing). Projections, not guarantees.
Landlord ↔ Tenant lean methodology
- Overall (STATE)
- 62 Landlord-Friendly
- State Michigan
- 62 Landlord-Friendly · EVEN
- County
- — inherits STATE
- City
- — inherits STATE
ZIP-level market 48442
- Active inventory
- 157
- Price-to-rent
- 7.0×
Monthly cashflow live
- Estimated rent
- $1,916 medium interval (Pro) →
- Mortgage (P&I)
- −$839
- Tax from tax record
- −$247 /mo · $2,959/yr
- Insurance
- −$67
- HOA
- −$0
- Vacancy / Maint / Mgmt
- −$402
- Net cashflow
- $362
Break-even live
Sensitivity live
| Price | -10% $452 | -5% $407 | +0% $362 | +5% $316 | +10% $271 |
|---|---|---|---|---|---|
| Rent | -10% $210 | -5% $286 | +0% $362 | +5% $437 | +10% $513 |
| Rate | -1.0pp $442 | -0.5pp $402 | base $362 | +0.5pp $320 | +1.0pp $278 |
UW: 25.0% down · 7.5% · 30yr · 1.5% tax · 5.0% vac · 8.0% maint · 8.0% mgmt
Financing live
Cash to close
- Down payment
- $39,975
- Closing costs
- $4,797
- Reserves months
- —
- Total cash needed
- —
Loan-product check · same deal, 3 products live
Conventional
25% down · 7.5% · 30yr
- Down + closing
- —
- Monthly P&I
- —
- Monthly cashflow
- —
- DSCR
- —
- Eligible?
- —
Personal DTI + credit; lowest rate.
DSCR
20% down · 8.5% · 30yr
- Down + closing
- —
- Monthly P&I
- —
- Monthly cashflow
- —
- DSCR
- —
- Eligible?
- —
No personal income docs; deal must DSCR.
Hard money
10% down · 12.0% · 12mo
- Down + closing
- —
- Monthly P&I
- —
- Monthly cashflow
- —
- DSCR
- —
- Eligible?
- —
Short-term bridge; refi at stabilization.
Rent comps 2 comps
| Address | Beds | Baths | Sqft | Rent | $/sqft | DOM | Units | Dist |
|---|---|---|---|---|---|---|---|---|
| 315 Crescent Ave Holly, MI | 3.0 | 1.0 | 1100 | $1,495 | $1.36 | 25d | 1 | 0.99mi |
| 4261 Grange Hall Rd Holly, MI | 3.0 | 2.0 | 1104 | $1,284 | $1.16 | 0d | 1 | 1.21mi |
Listing history 28 events
-
2026-06-15statusdays on market $159,900 Pending 25 DOM
-
2026-06-13days on market $159,900 Active Under Contract 24 DOM
-
2026-06-13days on market $159,900 Active Under Contract 23 DOM
-
2026-06-09days on market $159,900 Active Under Contract 20 DOM
-
2026-06-08days on market $159,900 Active Under Contract 19 DOM
-
2026-06-07days on market $159,900 Active Under Contract 18 DOM
-
2026-06-04days on market $159,900 Active Under Contract 15 DOM
-
2026-06-03days on market $159,900 Active Under Contract 14 DOM
-
2026-06-02days on market $159,900 Active Under Contract 13 DOM
-
2026-06-01days on market $159,900 Active Under Contract 12 DOM
-
2026-05-31days on market $159,900 Active Under Contract 11 DOM
-
2026-05-19$159,900 Active
Show marketing remark (562 chars)
Vintage farmhouse opportunity in the heart of Holly! Situated on a spacious . 58-acre lot, this 3-bedroom, 1.5-bath home is full of character and ready for your vision. Featuring a 2.5-car detached garage and plenty of room to grow, this property offers endless possibilities for investors, renovators, or buyers looking to create their dream home. Bring your ideas and imagination - with some updating, this farmhouse can truly shine. Conveniently located near downtown Holly shops, dining, and community events. Potential like this doesn't come around often!
-
2026-05-19$159,900 Active 562-char remark
Show marketing remark (562 chars)
Vintage farmhouse opportunity in the heart of Holly! Situated on a spacious . 58-acre lot, this 3-bedroom, 1.5-bath home is full of character and ready for your vision. Featuring a 2.5-car detached garage and plenty of room to grow, this property offers endless possibilities for investors, renovators, or buyers looking to create their dream home. Bring your ideas and imagination - with some updating, this farmhouse can truly shine. Conveniently located near downtown Holly shops, dining, and community events. Potential like this doesn't come around often!
-
2009-12-01soldstatus $61,000 236-char remark
Show marketing remark (236 chars)
Turn Of The Century Home In The Village Of Holly At A Great Price! 3 Bedrooms, 1.5 Baths, Full Basement And Detached 2 Car Garage. Homepath Available. Sold, as Is, Where Is. Lic Agent/Buyer No Commission. 1st-15 Days - Owner/Occ Only. .
-
2009-12-01soldstatus $61,000
Show marketing remark (236 chars)
Turn Of The Century Home In The Village Of Holly At A Great Price! 3 Bedrooms, 1.5 Baths, Full Basement And Detached 2 Car Garage. Homepath Available. Sold, as Is, Where Is. Lic Agent/Buyer No Commission. 1st-15 Days - Owner/Occ Only. .
-
2009-11-09historical
-
2009-10-22$54,900 236-char remark
Show marketing remark (236 chars)
Turn Of The Century Home In The Village Of Holly At A Great Price! 3 Bedrooms, 1.5 Baths, Full Basement And Detached 2 Car Garage. Homepath Available. Sold, as Is, Where Is. Lic Agent/Buyer No Commission. 1st-15 Days - Owner/Occ Only. .
-
2009-10-22$54,900
Show marketing remark (236 chars)
Turn Of The Century Home In The Village Of Holly At A Great Price! 3 Bedrooms, 1.5 Baths, Full Basement And Detached 2 Car Garage. Homepath Available. Sold, as Is, Where Is. Lic Agent/Buyer No Commission. 1st-15 Days - Owner/Occ Only. .
-
1997-06-03soldstatus $122,000
-
1997-05-12soldstatus $122,000
-
1997-05-12soldstatus $122,000
-
1997-05-12soldstatus $122,000
-
1997-04-04historical
-
1996-08-09$119,900
-
1996-08-09$119,900
-
1996-08-08$119,900
-
1993-11-15soldstatus $90,000
-
1991-05-21soldstatus $60,000
ⓘ Source: listings_history table (triggers on properties + properties_extension) + one-shot
backfill from property_details.listing_events for pre-trigger history.
Tax reassessment forecast MI · Partial reset (capped growth)
- Current annual tax
- $2,959 · $247/mo
- Projected year-2 tax
- $2,959 · $247/mo
- Expected delta
- $0/yr ($0/mo · 0.0%)
ⓘ Screening estimate from a state-policy table — verify with the county assessor before closing.
Climate risk First Street
- Flood 1/10 Low FEMA zone X (unshaded) · 0% chance over 30 yrs
- Wildfire 1/10 Low
- Heat 2/10 Low 7 d/yr ≥96°F today · 15 d/yr by 30 yrs out
- Wind 2/10 Low
- Air quality 3/10 Moderate 2 unhealthy d/yr today · 3 by 30 yrs out
Nearby sold comps map
Loading sold comps map…
Walkable amenities ~0.75 mi
Loading nearby amenities…
Taxation est. · year 1
- Rental income
- $22,990
- − Mortgage interest
- −$8,957
- − Property taxes
- −$2,959
- − Insurance
- −$800
- − Repairs & maintenance
- −$1,839
- − Management
- −$1,839
- − Depreciation
- −$4,652
- Taxable income
- $1,944
- Est. tax owed @ 24.0%
- −$467
- After-tax cash flow
- $3,874/yr
For passive investors: Depreciation is non-cash, so a rental often shows a tax loss while cash-flowing — sheltering income. Rental losses are passive: they offset passive income freely, and up to $25,000/yr can offset ordinary (W-2) income if you actively participate and your MAGI is under $100k (phasing out to $0 by $150k); unused losses carry forward. On sale, claimed depreciation is recaptured at up to 25%, and gains may owe capital-gains tax (a 1031 exchange can defer both). Figures are a year-1 estimate at your 24.0% rate — not tax advice; consult a CPA.
Schools (NCES district)
- District
- Holly Area School District
- NCES district ID
- 2618450
- Math proficiency
- 31% ▼ -12.00%
- Reading proficiency
- 52% ▼ -7.00%
- Median HH income
- $65,137
- Composite
- 37.1/100
- National rank
- #4496
- State rank
- #165 of 540 in MI
Livability — Holly
- Score
- 75/100
- State rank
- #156
- US rank
- #3930
Category grades
Schools grade is shown separately in the Schools card above.
Census & demographics
- Census place
- Holly, MI
- County
- Oakland County · 1,009,092 people
- City population
- 22,788
- Metro
- Detroit-Warren-Dearborn, MI
- Population (ZIP)
- 22,788
- Household income
- $86,575
- Rent vs Own
- Severe rent burden
- 532.0
Population outlook (Oakland County) Hauer SSP2
- Today (2025)
- 1,335,747 people
- By 2030
- 1,375,100 · +2.9%
- By 2040
- 1,435,385 · +7.5%
- By 2050
- 1,469,250 · +10.0%
- By 2075
- 1,531,946 · +14.7%
- By 2100
- 1,450,485 · +8.6%
Race, ethnicity, and origin ACS 2023
- Neighborhood character
- Predominantly White (89%)
- Race & ethnicity
- White 89% Two or more races 6% Hispanic / Latino 3% Black 3%
- Common ancestry
- Romanian 8% Slovak 4% Lithuanian 3%
- Foreign-born
- 4% · Canada
- Languages at home
- 96% English-only · Spanish 1% Russian/Polish/Slavic 1% Arabic 1%
Political lean MEDSL · Oakland
- 2024 margin
- D (+10.6) · D 54.4% · R 43.8% · Other 1.9%
- 2008→2024 swing
- -3.9pp toward R · 2008: 14.5pp · 2024: 10.6pp
- All cycles
- 2024: D+10.6 2020: D+14.1 2016: D+8.1 2012: D+8.1 2008: D+14.5
Not yet ingested
- Civics
- —
Market trends
- HPI YoY
- ▼ -229.30%
- Current HPI
- 227.7078
- Rent YoY
- —
- Metro
- Detroit-Warren-Dearborn, MI
- State GDP YoY
- ▲ 1.37%
- F500 in state
- 28
Industry mix (Fortune 500 HQ in MI)
| Industry | F500 HQs | Revenue |
|---|---|---|
| Automotive Parts | 3 | $48B |
|
||
| Automotive | 2 | $372B |
|
||
| Chemicals | 1 | $45B |
|
||
| Automotive Retail | 1 | $29B |
|
||
| Healthcare / Medical Devices | 1 | $23B |
|
||
| Automotive Technology | 1 | $20B |
|
||
Price history
+166.5% since first listed17 events — show timeline
- 2026-05-19 Listed $159,900 MiRealSource-MiMLS
- 2026-05-19 Listed $159,900 REALCOMP
- 2009-12-01 Sold (MLS) $61,000 MiRealSource-MiMLS
- 2009-12-01 Sold (MLS) $61,000 REALCOMP
- 2009-11-09 Listing Removed — MiRealSource-MiMLS
- 2009-10-22 Listed $54,900 MiRealSource-MiMLS
- 2009-10-22 Listed $54,900 REALCOMP
- 1997-06-03 Sold (Public Records) $122,000 Public Records
- 1997-05-12 Sold (MLS) $122,000 REALCOMP
- 1997-05-12 Sold (MLS) $122,000 MiRealSource-MiMLS
- 1997-05-12 Sold (MLS) $122,000 REALCOMP
- 1997-04-04 Listing Removed — MiRealSource-MiMLS
- 1996-08-09 Listed $119,900 MiRealSource-MiMLS
- 1996-08-09 Listed $119,900 REALCOMP
- 1996-08-08 Listed $119,900 REALCOMP
- 1993-11-15 Sold (Public Records) $90,000 Public Records
- 1991-05-21 Sold (Public Records) $60,000 Public Records
Property tax history
+6.4%/yrLatest (2025): $2,959 · +9.3% YoY. Source: county tax records.
Cash-flow waterfall
monthlySold comps — $/sqft
last 12 mo · ≤1 miLoading sold comps…