 Duplex
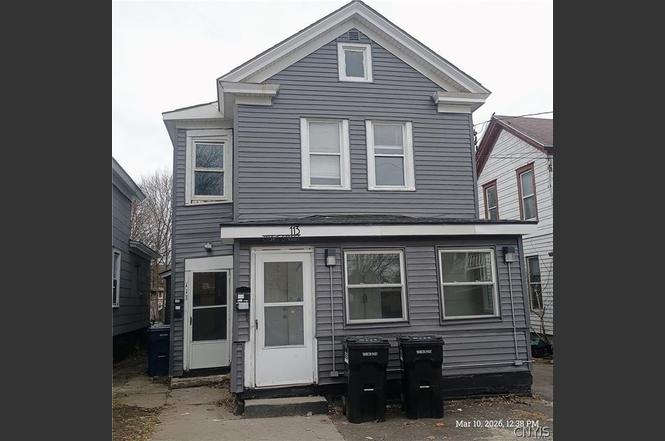
113 Olive St · Syracuse, NY
Flood risk 1/10 · Minimal
- FEMA flood zone
- X (unshaded)
- Chance of flooding over 30 yrs
- 0.0%
- Est. flood insurance / yr
- $473 – $860
Fire risk 1/10 · Minimal
- Est. fire insurance / yr
- $691 – $1,283
Heat risk 3/10 · Minor
- Hot days now (above 95°F)
- 7 days/yr
- Hot days in 30 yrs
- 16 days/yr
Wind risk 1/10 · Minimal
- Chance of severe wind over 30 yrs
- 0.0%
Air-quality risk 2/10 · Minimal
- Unhealthy air days now
- 0 days/yr
- Unhealthy air days in 30 yrs
- 1 days/yr
Risk factors via First Street. Map © Google.
Why this score? — see what drove the B grade
The composite is a weighted blend of 9 inputs, each scored 0–100. Each bar is that input's sub-score; the figure is the points it added to the 100-point composite (weight × sub-score).
- Cash flow +30.0/30.0
- DSCR +10.0/10.0
- Appreciation +10.0/10.0
- 1% rule +9.8/10.0
- Rent growth +4.6/5.0
- Livability +3.9/5.0
- Condition / age +2.5/5.0
- Schools +1.8/10.0
- ARV discount +0.0/15.0
$249,900
🖨 Deal sheet 📄 Offer letter ✓ Due diligence
Multi-family units
County records classify this as Multi-Family (2-4 Unit). Listing-text estimate: 2 units. confirmed
Listing remarks
This fully renovated 2-family property is the ideal opportunity! Located in a high-demand rental area, this low-maintenance duplex features two spacious 4-bedroom apartments with a strong rental history and potential monthly rent roll of nearly $3700! Each unit includes: 4 large bedrooms. Modern kitchens with granite countertops and stainless steel appliances Updated bathrooms, (unit #2 has two full baths!) all new flooring throughout Newer roof, vinyl siding, and energy-efficient windows With all the major updates already completed, you can enjoy peace of mind and minimal upkeep — perfect for first-time landlords or experienced investors alike. This is a smart, stable investment in a
Key facts
- Fully renovated
- Modern kitchens
- Granite countertops
Tags
Neighborhood map
What this means for you Summary
Snapshot
- This is a 2 × 4-bed/1.2-bath units multifamily listed at $250k.
Deal economics
- At list price, monthly cash flow is $1k ($17k/yr) — positive. Per door: $694/mo.
- The deal already cash-flows at list — no discount required.
- Meets the 1% rule at list price ($4k rent vs $250k).
- Cap rate 13.0% vs local median 8.2% in Syracuse — top-decile yield for the area; either an underpriced asset or a hidden risk that comps aren't pricing in. Stress-test before assuming the spread holds.
Location & tenants
- Location reads 77/100 on livability (#187 in NY, #2,869 nationally) — a middle-class / working-renter tenant base. Strengths: amenities A+, commute A+, cost of living A+; Watch: schools D+, crime F, employment D-.
- Syracuse City School District (urban): math 18% / reading 26% proficiency, ranked #590 of 590 in NY (top 100%) — low school quality limits family demand, transient renter base, plan for 1-2y turnover; 74% free/reduced lunch — lower-income household profile, screen leases tightly.
- Market conditions: Rents rising fast (+8.2%/yr); 119 active listings in the ZIP; 1 comparable units currently listed for rent nearby; 616 units permitted in Onondaga County in 2024 (256 in 5+ unit buildings).
- At $3,701/mo this rent would consume 98% of the median local household income ($45k/yr) (locally 2073% of renters already pay >50% of income on rent) — very limited rent-growth headroom before tenants either downsize or default.
Forward outlook
- In year one you build about $27k of equity ($2k loan paydown + $25k appreciation (10.0% local appreciation)).
- Onondaga County population projected to shrink 9% by 2050 — rents likely to lag national; underwrite the cash flow, not the appreciation.
- At projected returns (10.0% appreciation + 8.0% rent growth), your $70k cash investment doubles in ~2 years — after that, you're playing with house money.
- By year 2, paydown + projected appreciation supports a ~$43k cash-out refi (75% LTV) — recoverable capital for the next deal without selling this one.
Negotiation context
- Only 1 days on market — expect competitive offers; lowballing is unlikely to land.
- 2 sale attempts with the ask held roughly flat each time — persistent listings suggest the price (not the market) is what's stuck; bring a comps-based counter.
- Current owner paid $35k; list at $250k implies a 614% gain — meaningful room to come down on a strong offer.
Risks & watch-outs
- Watch-outs: built in 1925 — expect roof / HVAC / electrical / plumbing capex.
Questions for the listing agent
- Can we see the unit-by-unit rent roll, current vacancy, and any below-market leases? What's the average tenancy length?
- What capital expenditures (roof, boiler, parking lot, exteriors) have been made in the last 5 years, and what's planned in the next 2?
- Built in 1925 — when were the roof, HVAC, electrical panel, plumbing, and water heater last replaced?
- Is there a deadline driving the sale (1031 exchange, divorce, estate, relocation)? That informs how much negotiation room exists.
- Schools are D-rated, which usually means shorter tenancies and higher turnover. Who's the typical renter profile here, and what's been the actual vacancy rate?
- Crime grade is F in this area — have there been break-ins, vandalism, or insurance claims at this property in the last 3 years? What carrier currently insures it and at what premium?
- What's the average days-on-market for RENTAL listings here right now (not sales)? A rising rental-DOM trend means longer vacancies and softer asking-rent achievability than the comps imply.
- What's the recent tenant-quality profile in this submarket — average credit score on applications, eviction rate, late-payment / NSF rate, and stable-employment percentage? A property-management company in the area should have these aggregated.
- How much new apartment / multifamily construction is in the pipeline within 1–3 miles? Heavy new supply (>2% of stock underway) typically softens rents 12–24 months out; light construction supports rent growth.
Investment metrics
- 1% rule
- 1.48% ✓
- Cap rate
- 12.96%
- Cash-on-cash
- 23.80%
- DSCR
- 2.06
- GRM
- 5.6
CMA / ARV
- ARV (on-the-fly)
- $192,556
- Comps found
- 9
Show comp detail 9 sales within ~0.75 mi
| Address | Dist | Beds/Ba | Sqft | Sold | Price | $/sf | Match |
|---|---|---|---|---|---|---|---|
| 903 Milton Ave | 0.15mi | 6/2.0 | 2,084 (-2%) | 10mo | $190,000 | $91 | 82 |
| 119 Charles Ave | 0.33mi | 5/2.0 (-1) | 2,079 (-2%) | 7mo | $235,000 | $113 | 71 |
| 410 Chemung St | 0.25mi | 6/2.0 | 1,872 (-12%) | 4mo | $170,000 | $91 | 66 |
| 204 Essex St | 0.10mi | 5/2.0 (-1) | 1,952 (-8%) | 15mo | $232,300 | $119 | 65 |
| 211 Erie St | 0.37mi | 6/2.0 | 2,172 (+3%) | 20mo | $165,000 | $76 | 61 |
| 204 Charles Ave | 0.34mi | 6/2.0 | 2,186 (+3%) | 22mo | $206,000 | $94 | 60 |
| 222 Lamont Ave | 0.52mi | 5/2.0 (-1) | 2,068 (-2%) | 9mo | $125,000 | $60 | 60 |
| 104 Kincaid Ave | 0.26mi | 6/2.0 | 1,910 (-10%) | 14mo | $80,000 | $42 | 59 |
| 501 Willis Ave | 0.50mi | 6/2.0 | 1,861 (-12%) | 17mo | $210,000 | $113 | 42 |
Match score weights: distance 35% · size 25% · config 20% · recency 20%. Top-matched comps best support the ARV.
Projected returns pro-forma
10.0% appreciation · 8.0% rent growth · sell at horizon
- IRR
- 44.9%
- Equity multiple
- 4.49×
- Total profit
- $243,996
- Equity at exit
- $225,130
- IRR
- 40.8%
- Equity multiple
- 10.97×
- Total profit
- $697,346
- Equity at exit
- $485,501
Cash invested: $69,972 (down + closing). Projections, not guarantees.
Landlord ↔ Tenant lean methodology
- Overall (STATE)
- 15 Strongly Tenant-Friendly
- State New York
- 15 Strongly Tenant-Friendly · D+10
- County
- — inherits STATE
- City
- — inherits STATE
ZIP-level market 13204
- Home prices YoY
- 31.6%
- Rents YoY
- 8.2%
- Active inventory
- 119
- Price-to-rent
- 11.3×
Monthly cashflow live
- Estimated rent
- $3,701 high interval (Pro) →
- Mortgage (P&I)
- −$1,311
- Tax from tax record
- −$121 /mo · $1,455/yr
- Insurance
- −$104
- HOA
- −$0
- Vacancy / Maint / Mgmt
- −$777
- Net cashflow
- $1,388
Break-even live
2-unit breakdown (identical units grouped — click to expand)
| Units | Beds | Baths | Est. rent |
|---|---|---|---|
| 2× units | 4 | 1.2 | $3,700 |
| #1 | 4 | 1.2 | $1,850 |
| #2 | 4 | 1.2 | $1,850 |
| Total (2 units) | $3,701 | ||
UW: 25.0% down · 7.5% · 30yr · 1.5% tax · 5.0% vac · 8.0% maint · 8.0% mgmt
Financing live
Cash to close
- Down payment
- $62,475
- Closing costs
- $7,497
- Reserves months
- —
- Total cash needed
- —
Loan-product check · same deal, 3 products live
Conventional
25% down · 7.5% · 30yr
- Down + closing
- —
- Monthly P&I
- —
- Monthly cashflow
- —
- DSCR
- —
- Eligible?
- —
Personal DTI + credit; lowest rate.
DSCR
20% down · 8.5% · 30yr
- Down + closing
- —
- Monthly P&I
- —
- Monthly cashflow
- —
- DSCR
- —
- Eligible?
- —
No personal income docs; deal must DSCR.
Hard money
10% down · 12.0% · 12mo
- Down + closing
- —
- Monthly P&I
- —
- Monthly cashflow
- —
- DSCR
- —
- Eligible?
- —
Short-term bridge; refi at stabilization.
Rent comps 1 comps
| Address | Beds | Baths | Sqft | Rent | $/sqft | DOM | Units | Dist |
|---|---|---|---|---|---|---|---|---|
| 312 Hall Ave Solvay, NY | 5.0 | 2.5 | 1800 | $3,600 | $2.00 | 20d | 1 | 0.66mi |
Listing history 10 events
-
2026-06-19days on market $249,900 Active 1 DOM
-
2026-06-08days on market $249,900 Active 19 DOM
-
2026-06-07days on market $249,900 Active 18 DOM
-
2026-06-05statusdays on market $249,900 Active 15 DOM
-
2026-03-24status Pending
-
2026-03-09$249,900 Active
-
2025-11-13historical
-
2025-10-02price $249,900
-
2025-08-13$274,900 Active
-
2024-03-13soldstatus $35,000
ⓘ Source: listings_history table (triggers on properties + properties_extension) + one-shot
backfill from property_details.listing_events for pre-trigger history.
Tax reassessment forecast NY · Partial reset (capped growth)
- Current annual tax
- $1,455 · $121/mo
- Projected year-2 tax
- $2,839 · $237/mo
- Expected delta
- +$1,384/yr (+$115/mo · 95.1%)
ⓘ Screening estimate from a state-policy table — verify with the county assessor before closing.
Climate risk First Street
- Flood 1/10 Low FEMA zone X (unshaded) · 0% chance over 30 yrs
- Wildfire 1/10 Low
- Heat 3/10 Moderate 7 d/yr ≥95°F today · 16 d/yr by 30 yrs out
- Wind 1/10 Low 0% chance of damaging wind over 30 yrs
- Air quality 2/10 Low 0 unhealthy d/yr today · 1 by 30 yrs out
Nearby sold comps map
Loading sold comps map…
Walkable amenities ~0.75 mi
Loading nearby amenities…
Taxation est. · year 1
- Rental income
- $44,412
- − Mortgage interest
- −$13,998
- − Property taxes
- −$1,455
- − Insurance
- −$1,250
- − Repairs & maintenance
- −$3,553
- − Management
- −$3,553
- − Depreciation
- −$7,270
- Taxable income
- $13,333
- Est. tax owed @ 24.0%
- −$3,200
- After-tax cash flow
- $13,455/yr
For passive investors: Depreciation is non-cash, so a rental often shows a tax loss while cash-flowing — sheltering income. Rental losses are passive: they offset passive income freely, and up to $25,000/yr can offset ordinary (W-2) income if you actively participate and your MAGI is under $100k (phasing out to $0 by $150k); unused losses carry forward. On sale, claimed depreciation is recaptured at up to 25%, and gains may owe capital-gains tax (a 1031 exchange can defer both). Figures are a year-1 estimate at your 24.0% rate — not tax advice; consult a CPA.
Schools (NCES district)
- District
- Syracuse City School District
- NCES district ID
- 3628590
- Math proficiency
- 18% ▼ -5.00%
- Reading proficiency
- 26% ▬ 0.00%
- Median HH income
- $32,097
- Composite
- 17.83/100
- National rank
- #9007
- State rank
- #590 of 590 in NY
Livability — Syracuse
- Score
- 77/100
- State rank
- #187
- US rank
- #2869
Category grades
Schools grade is shown separately in the Schools card above.
Census & demographics
- Census place
- Syracuse, NY
- County
- Onondaga County · 247,257 people
- City population
- 152,627
- Metro
- Syracuse, NY
- Population (ZIP)
- 19,440
- Household income
- $45,351
- Rent vs Own
- Severe rent burden
- 2073.0
Population outlook (Onondaga County) Hauer SSP2
- Today (2025)
- 467,894 people
- By 2030
- 463,381 · -1.0%
- By 2040
- 447,697 · -4.3%
- By 2050
- 426,399 · -8.9%
- By 2075
- 373,661 · -20.1%
- By 2100
- 307,967 · -34.2%
Race, ethnicity, and origin ACS 2023
- Neighborhood character
- Diverse neighborhood (Simpson 0.68)
- Race & ethnicity
- White 47% Black 26% Hispanic / Latino 17% Two or more races 13% Native American 1%
- Hispanic origin (detail)
- Puerto Rican 12% Cuban 2% Dominican 1%
- Common ancestry
- Romanian 5% Lithuanian 2% Subsaharan African 2%
- Foreign-born
- 7% · Canada, Jamaica
- Languages at home
- 83% English-only · Spanish 11% Russian/Polish/Slavic 3% Arabic 1%
Political lean MEDSL · Onondaga
- 2024 margin
- D (+17.3) · D 58.6% · R 41.4%
- 2008→2024 swing
- -3.0pp toward R · 2008: 20.3pp · 2024: 17.3pp
- All cycles
- 2024: D+17.3 2020: D+20.6 2016: D+12.8 2012: D+21.1 2008: D+20.3
Not yet ingested
- Civics
- —
Market trends
- HPI YoY
- ▲ 100.14%
- Current HPI
- 416.7272
- Rent YoY
- ▲ 8.24%
- Metro
- Syracuse, NY
- State GDP YoY
- ▲ 2.60%
- F500 in state
- 92
Industry mix (Fortune 500 HQ in NY)
| Industry | F500 HQs | Revenue |
|---|---|---|
| Financial Services | 10 | $950B |
|
||
| Consumer Goods | 9 | $162B |
|
||
| Insurance | 4 | $225B |
|
||
| Telecommunications | 2 | $144B |
|
||
| Pharmaceuticals | 2 | $112B |
|
||
| Media / Entertainment | 2 | $69B |
|
||
Price history
+614.0% since first listed6 events — show timeline
- 2026-03-24 Pending — CNYIS
- 2026-03-09 Listed $249,900 CNYIS
- 2025-11-13 Listing Removed — CNYIS
- 2025-10-02 Price Changed $249,900 CNYIS
- 2025-08-13 Listed $274,900 CNYIS
- 2024-03-13 Sold (Public Records) $35,000 Public Records
Property tax history
+1.7%/yrLatest (2025): $1,455 · +0.0% YoY. Source: county tax records.
Cash-flow waterfall
monthlySold comps — $/sqft
last 12 mo · ≤1 miLoading sold comps…