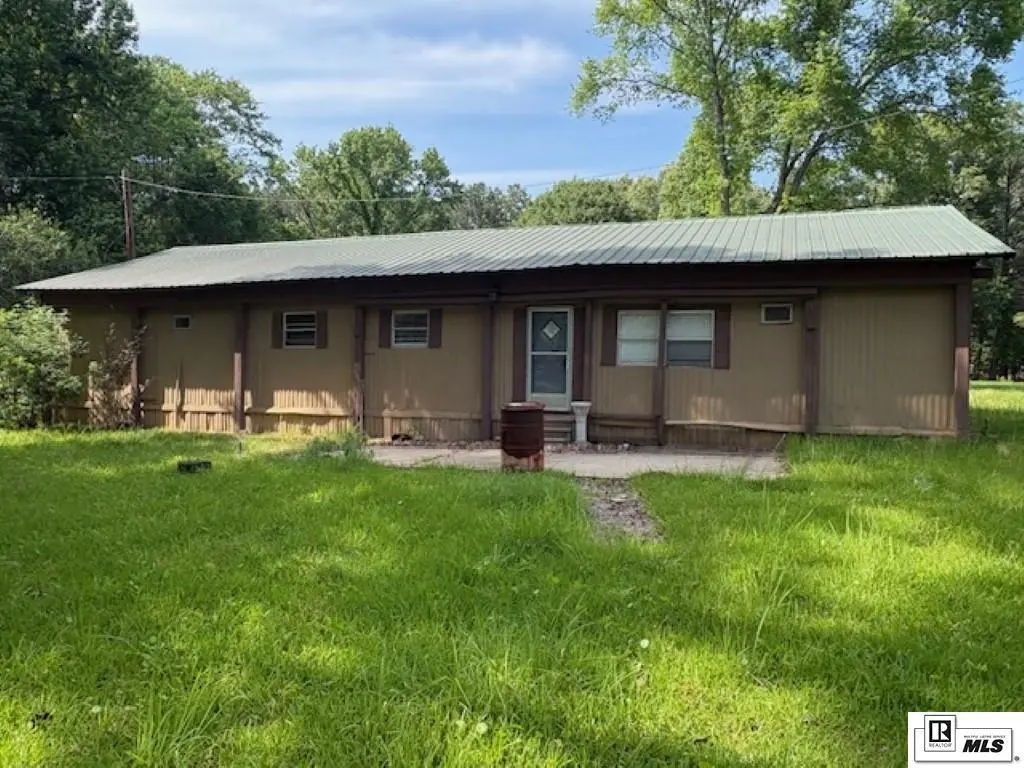
6703 Pete Montgomery Rd · Bastrop, LA
Flood risk 1/10 · Minimal
- FEMA flood zone
- X
- Chance of flooding over 30 yrs
- 0.0%
- Est. flood insurance / yr
- $507 – $1,088
Fire risk 4/10 · Minor
- Est. fire insurance / yr
- $1,269 – $2,357
Heat risk 7/10 · Major
- Hot days now (above 111°F)
- 7 days/yr
- Hot days in 30 yrs
- 20 days/yr
Wind risk 6/10 · Moderate
- Chance of severe wind over 30 yrs
- 60.0%
Air-quality risk 1/10 · Minimal
- Unhealthy air days now
- 0 days/yr
- Unhealthy air days in 30 yrs
- 0 days/yr
Risk factors via First Street. Map © Google.
Why this score? — see what drove the B grade
The composite is a weighted blend of 9 inputs, each scored 0–100. Each bar is that input's sub-score; the figure is the points it added to the 100-point composite (weight × sub-score).
- Cash flow +30.0/30.0
- 1% rule +10.0/10.0
- DSCR +10.0/10.0
- ARV discount +7.5/15.0
- Appreciation +3.9/10.0
- Rent growth +2.5/5.0
- Livability +2.5/5.0
- Condition / age +2.5/5.0
- Schools +1.1/10.0
$62,000
🖨 Deal sheet 📄 Offer letter ✓ Due diligence
Listing remarks
Take a look at this 4 bedroom 1 bath , with bonus room. Sitting on 2.85 acres with above ground pool!! All sitting on a quiet dead end road. Come see this today!! School is in Beekman school district and pick up at driveway. The seller is a license realtor. .
Key facts
- 2.85 acre lot
- Pool
- Listed 31 days
Property features AI
Finance
- Other: Lot size approximately 2.85 acres; Zoned residential
- HOA & community: No association amenities
Exterior
- Security: Smoke detector(s)
- Utilities: Public water; Septic tank sewer; Propane service
- Home design: Single-story mobile home (double wide); Entry at level 1; Residential property
- Construction: Metal siding; Metal roof; Pillar/post/pier foundation; Built as a double wide mobile home
- Exterior features: Covered patio/porch; Above-ground private pool; Cleared lot; Paved road access
Interior
- Kitchen: Dishwasher; Refrigerator; Electric range
- Bedrooms: 4 main-level bedrooms
- Bathrooms: 1 full bathroom (main level)
- Heating & cooling: Propane heating; Ceiling fans; Wall/window cooling unit(s)
- Interior features: Ceiling fan(s); Smoke detector(s)
- Laundry & utility: Electric water heater
Neighborhood map
What this means for you Summary
Snapshot
- This is a 4-bed/2.0-bath manufactured listed at $62k.
Deal economics
- At list price, monthly cash flow is $574 ($7k/yr) — positive.
- The deal already cash-flows at list — no discount required.
- Meets the 1% rule at list price ($1k rent vs $62k).
- Recommended offer: $60k (3.0% below list) — sets the bar for market timing.
Location & tenants
- Location reads 50/100 on livability (#425 in LA) — a working-class tenant base; expect higher turnover. Strengths: cost of living A+, housing A; Watch: schools D, health & safety D, crime F.
- Morehouse Parish (town): math 10% / reading 19% proficiency, ranked #83 of 98 in LA (top 85%) — low school quality limits family demand, transient renter base, plan for 1-2y turnover; 78% free/reduced lunch — lower-income household profile, screen leases tightly.
- Market conditions: 92 active listings in the ZIP; 11 units permitted in Morehouse Parish in 2024 (0 in 5+ unit buildings).
Forward outlook
- Local home prices are declining (-2.1%/yr); year-one equity from $429 of loan paydown is wiped out by about $1k of value loss. Plan a longer hold.
- Morehouse County population projected at -29% by 2050 — secular population decline; favor cash flow + early exit over multi-decade hold.
- At projected returns (-2.1% appreciation + 3.0% rent growth), your $17k cash investment doubles in ~3 years — after that, you're playing with house money.
Negotiation context
- It's been on market 32 days — a 3% lower offer ($60k) is reasonable based on typical stale-listing flexibility.
- 2 sale attempts since 2y ago with the ask held roughly flat each time — persistent listings suggest the price (not the market) is what's stuck; bring a comps-based counter.
Risks & watch-outs
- Climate carrying-cost: major wind risk, 60% chance of damaging wind over 30y; extreme-heat days projected 7→20/yr by 2055 (HVAC capex compounding) — expect insurance premiums to compound above CPI over the hold.
Questions for the listing agent
- It's been on market 32 days. Have you received any prior offers? Is the seller open to a 3% concession, seller financing, or rate buy-down credit?
- Built in 1972 — when were the roof, HVAC, electrical panel, plumbing, and water heater last replaced?
- Is there a deadline driving the sale (1031 exchange, divorce, estate, relocation)? That informs how much negotiation room exists.
- Schools are D-rated, which usually means shorter tenancies and higher turnover. Who's the typical renter profile here, and what's been the actual vacancy rate?
- Crime grade is F in this area — have there been break-ins, vandalism, or insurance claims at this property in the last 3 years? What carrier currently insures it and at what premium?
- What's the average days-on-market for RENTAL listings here right now (not sales)? A rising rental-DOM trend means longer vacancies and softer asking-rent achievability than the comps imply.
- What's the recent tenant-quality profile in this submarket — average credit score on applications, eviction rate, late-payment / NSF rate, and stable-employment percentage? A property-management company in the area should have these aggregated.
- How much new for-sale + rental construction is in the pipeline within 1–3 miles? Heavy new supply typically softens prices + rents 12–24 months out; constrained supply supports both.
Investment metrics
- 1% rule
- 1.98% ✓
- Cap rate
- 17.40%
- Cash-on-cash
- 39.66%
- DSCR
- 2.76
- GRM
- 4.2
CMA / ARV
No comps found within radius.
Projected returns pro-forma
-2.1% appreciation · 3.0% rent growth · sell at horizon
- IRR
- 37.4%
- Equity multiple
- 2.66×
- Total profit
- $28,847
- Equity at exit
- $11,747
- IRR
- 43.0%
- Equity multiple
- 5.28×
- Total profit
- $74,259
- Equity at exit
- $9,760
Cash invested: $17,360 (down + closing). Projections, not guarantees.
Landlord ↔ Tenant lean methodology
- Overall (STATE)
- 90 Strongly Landlord-Friendly
- State Louisiana
- 90 Strongly Landlord-Friendly · R+12
- County
- — inherits STATE
- City
- — inherits STATE
ZIP-level market 71220
- Home prices YoY
- -1.2%
- Active inventory
- 92
- Price-to-rent
- 4.2×
Monthly cashflow live
- Estimated rent
- $1,230 medium interval (Pro) →
- Mortgage (P&I)
- −$325
- Tax from tax record
- −$47 /mo · $569/yr
- Insurance
- −$26
- HOA
- −$0
- Vacancy / Maint / Mgmt
- −$258
- Net cashflow
- $574
Break-even live
UW: 25.0% down · 7.5% · 30yr · 1.5% tax · 5.0% vac · 8.0% maint · 8.0% mgmt
Financing live
Cash to close
- Down payment
- $15,500
- Closing costs
- $1,860
- Reserves months
- —
- Total cash needed
- —
Loan-product check · same deal, 3 products live
Conventional
25% down · 7.5% · 30yr
- Down + closing
- —
- Monthly P&I
- —
- Monthly cashflow
- —
- DSCR
- —
- Eligible?
- —
Personal DTI + credit; lowest rate.
DSCR
20% down · 8.5% · 30yr
- Down + closing
- —
- Monthly P&I
- —
- Monthly cashflow
- —
- DSCR
- —
- Eligible?
- —
No personal income docs; deal must DSCR.
Hard money
10% down · 12.0% · 12mo
- Down + closing
- —
- Monthly P&I
- —
- Monthly cashflow
- —
- DSCR
- —
- Eligible?
- —
Short-term bridge; refi at stabilization.
Listing history 24 events
-
2026-06-19days on market $62,000 Active 32 DOM
-
2026-06-18days on market $62,000 Active 31 DOM
-
2026-06-17days on market $62,000 Active 30 DOM
-
2026-06-16days on market $62,000 Active 29 DOM
-
2026-06-15days on market $62,000 Active 28 DOM
-
2026-06-14days on market $62,000 Active 26 DOM
-
2026-06-13days on market $62,000 Active 25 DOM
-
2026-06-10days on market $62,000 Active 23 DOM
-
2026-06-09days on market $62,000 Active 22 DOM
-
2026-06-08days on market $62,000 Active 21 DOM
-
2026-06-07days on market $62,000 Active 20 DOM
-
2026-06-05days on market $62,000 Active 17 DOM
-
2026-06-03days on market $62,000 Active 16 DOM
-
2026-06-03remarks 259-char remark
-
2026-06-02days on market $62,000 Active 15 DOM
-
2026-06-01days on market $62,000 Active 14 DOM
-
2026-05-31days on market $62,000 Active 13 DOM
-
2026-05-30days on market $62,000 Active 12 DOM
-
2026-05-18$62,000 Active
-
2025-02-04price $80,786
-
2025-01-15price $89,786
-
2024-12-02price $99,786
-
2024-09-26$114,786 Active
-
2009-09-28soldstatus
ⓘ Source: listings_history table (triggers on properties + properties_extension) + one-shot
backfill from property_details.listing_events for pre-trigger history.
Tax reassessment forecast LA · Resets to sale price
- Current annual tax
- $569 · $47/mo
- Projected year-2 tax
- $569 · $47/mo
- Expected delta
- $0/yr ($0/mo · 0.0%)
ⓘ Screening estimate from a state-policy table — verify with the county assessor before closing.
Climate risk First Street
- Flood 1/10 Low FEMA zone X · 0% chance over 30 yrs
- Wildfire 4/10 Moderate
- Heat 7/10 Severe 7 d/yr ≥111°F today · 20 d/yr by 30 yrs out
- Wind 6/10 Major 60% chance of damaging wind over 30 yrs
- Air quality 1/10 Low 0 unhealthy d/yr today · 0 by 30 yrs out
Nearby sold comps map
Loading sold comps map…
Walkable amenities ~0.75 mi
Loading nearby amenities…
Taxation est. · year 1
- Rental income
- $14,766
- − Mortgage interest
- −$3,473
- − Property taxes
- −$569
- − Insurance
- −$310
- − Repairs & maintenance
- −$1,181
- − Management
- −$1,181
- − Depreciation
- −$1,804
- Taxable income
- $6,248
- Est. tax owed @ 24.0%
- −$1,500
- After-tax cash flow
- $5,385/yr
For passive investors: Depreciation is non-cash, so a rental often shows a tax loss while cash-flowing — sheltering income. Rental losses are passive: they offset passive income freely, and up to $25,000/yr can offset ordinary (W-2) income if you actively participate and your MAGI is under $100k (phasing out to $0 by $150k); unused losses carry forward. On sale, claimed depreciation is recaptured at up to 25%, and gains may owe capital-gains tax (a 1031 exchange can defer both). Figures are a year-1 estimate at your 24.0% rate — not tax advice; consult a CPA.
Schools (NCES district)
- District
- Morehouse Parish
- NCES district ID
- 2201110
- Math proficiency
- 10% ▼ -29.00%
- Reading proficiency
- 19% ▼ -29.00%
- Median HH income
- $30,482
- Composite
- 11.46/100
- National rank
- #9704
- State rank
- #83 of 98 in LA
Livability — Bastrop
- Score
- 50/100
- State rank
- #425
- US rank
- #25547
Category grades
Schools grade is shown separately in the Schools card above.
Census & demographics
- Population (ZIP)
- 20,426
Population outlook (Morehouse County) Hauer SSP2
- Today (2025)
- 23,631 people
- By 2030
- 22,114 · -6.4%
- By 2040
- 19,203 · -18.7%
- By 2050
- 16,698 · -29.3%
- By 2075
- 11,998 · -49.2%
- By 2100
- 8,622 · -63.5%
Race, ethnicity, and origin ACS 2023
- Neighborhood character
- Majority Black (51%)
- Race & ethnicity
- Black 51% White 44% Two or more races 3% Hispanic / Latino 2%
- Common ancestry
- Lithuanian 2%
- Foreign-born
- 1% · China
Political lean MEDSL · Morehouse
- 2024 margin
- R (+19.4) · D 39.7% · R 59.0% · Other 1.3%
- 2008→2024 swing
- -8.3pp toward R · 2008: -11.1pp · 2024: -19.4pp
- All cycles
- 2024: R+19.4 2020: R+13.5 2016: R+11.4 2012: R+5.6 2008: R+11.1
Not yet ingested
- Civics
- —
Market trends
- HPI YoY
- ▼ -2.10%
- Current HPI
- 171.3272
- Rent YoY
- —
- Metro
- —
- State GDP YoY
- ▲ 3.29%
- F500 in state
- 10
Industry mix (Fortune 500 HQ in LA)
| Industry | F500 HQs | Revenue |
|---|---|---|
| Telecommunications | 2 | $23B |
|
||
| Utilities | 1 | $12B |
|
||
| Wholesale / Distribution | 1 | $5B |
|
||
| Advertising | 1 | $2B |
|
||
Price history
-46.0% since first listed6 events — show timeline
- 2026-05-18 Listed $62,000 NELABOR
- 2025-02-04 Price Changed $80,786 NELABOR
- 2025-01-15 Price Changed $89,786 NELABOR
- 2024-12-02 Price Changed $99,786 NELABOR
- 2024-09-26 Listed $114,786 NELABOR
- 2009-09-28 Sold (Public Records) — Public Records
Property tax history
+2.8%/yrLatest (2024): $569 · +35.4% YoY. Source: county tax records.
Cash-flow waterfall
monthlySold comps — $/sqft
last 12 mo · ≤1 miLoading sold comps…