 🏗️ New Construction
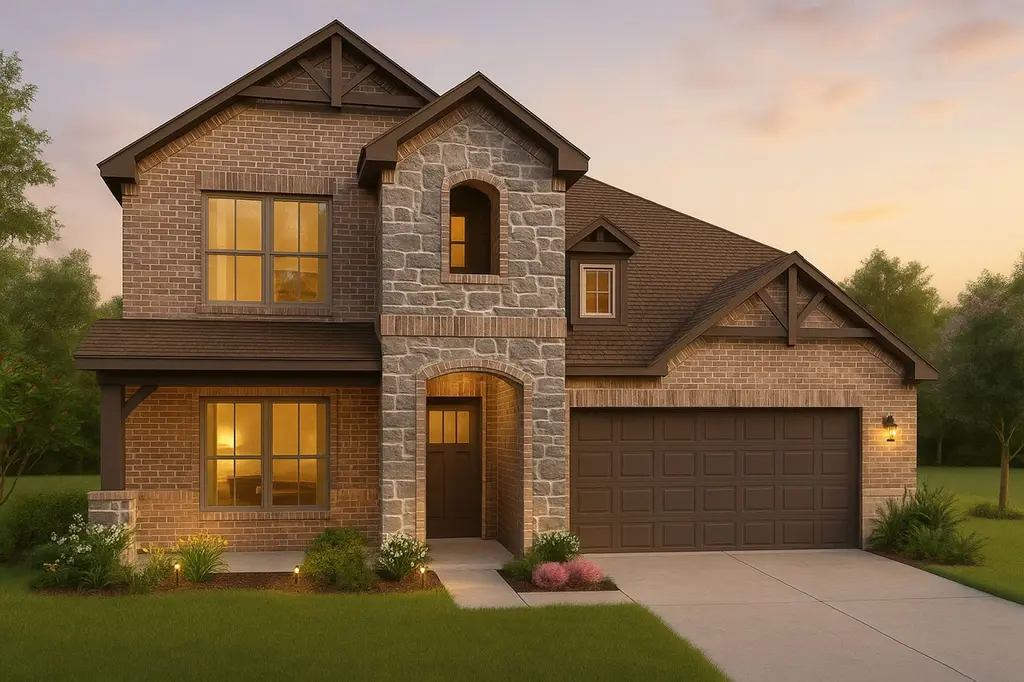
Sunterra Ironwood 2589 Plan · Katy, TX
Flood risk 1/10 · Minimal
- FEMA flood zone
- X (unshaded)
- Chance of flooding over 30 yrs
- 0.0%
- Est. flood insurance / yr
- $507 – $1,088
Fire risk 4/10 · Minor
- Est. fire insurance / yr
- $1,222 – $2,270
Heat risk 9/10 · Severe
- Hot days now (above 111°F)
- 7 days/yr
- Hot days in 30 yrs
- 22 days/yr
Wind risk 9/10 · Severe
- Chance of severe wind over 30 yrs
- 99.0%
Air-quality risk 2/10 · Minimal
- Unhealthy air days now
- 1 days/yr
- Unhealthy air days in 30 yrs
- 2 days/yr
Risk factors via First Street. Map © Google.
Why this score? — see what drove the D- grade
The composite is a weighted blend of 9 inputs, each scored 0–100. Each bar is that input's sub-score; the figure is the points it added to the 100-point composite (weight × sub-score).
- Cash flow +8.0/30.0
- ARV discount +7.5/15.0
- Schools +5.7/10.0
- Livability +3.8/5.0
- Condition / age +3.8/5.0
- 1% rule +2.5/10.0
- Rent growth +2.3/5.0
- DSCR +2.1/10.0
- Appreciation +0.0/10.0
$337,990
🖨 Deal sheet 📄 Offer letter ✓ Due diligence
Listing remarks MLS
Sunterra brings a kind of excitement you won't find anywhere else in Katy, offering a lifestyle that feels fresh, inspired, and truly one-of-a-kind. Resort-style amenities, stunning water attractions, and thoughtful gathering spaces create a community experience that stands apart, giving residents more ways to relax, play, and enjoy time together. Its convenient location keeps shopping, dining, and major thoroughfares close at hand. Sunterra is where fun, comfort, and something truly special come together.
Key facts
- 2 garage spots
- Listed 77 days
Neighborhood map
What this means for you Summary
Snapshot
- This is a 4-bed/3.0-bath single-family listed at $338k. Condition is rated good.
Deal economics
- At list price, monthly cash flow is $-418 ($-5k/yr) — negative.
- The deal already cash-flows at list — no discount required.
- To meet the 1% rule (rent ≥ 1% of price), the offer needs to be $305k (9.8% below list).
- Recommended offer: $305k (9.8% below list) — sets the bar for 1% rule.
- Cap rate 5.1% vs local median 3.0% in Katy — top-decile yield for the area; either an underpriced asset or a hidden risk that comps aren't pricing in. Stress-test before assuming the spread holds.
Location & tenants
- Location reads 76/100 on livability (#111 in TX, #3,613 nationally) — a middle-class / working-renter tenant base. Strengths: employment A+, cost of living A+, housing A+; Watch: crime C-, amenities D, commute F.
- Katy ISD (suburban): math 61% / reading 63% proficiency, ranked #29 of 826 in TX (top 4%) — acceptable for families but not a draw, mixed tenant base, ~2y average lease.
- Market conditions: Rents soft (-0.8%/yr); 2696 active listings in the ZIP; 22 comparable units currently listed for rent nearby; rentals at typical pace (median 24d on market — plan ~3-4 weeks tenant-placement turnaround); high-income renter base; 29,883 units permitted in Harris County in 2024 (8,621 in 5+ unit buildings).
- This rent runs 31% of the median local income ($118k/yr) — at the standard rent-burdened threshold; future hikes will face affordability resistance.
Forward outlook
- Local home prices are declining (-3.0%/yr); year-one equity from $3k of loan paydown is wiped out by about $12k of value loss. Plan a longer hold.
- Harris County population projected at +47% by 2050 — long-run rental-demand tailwind backs the buy-and-hold thesis.
Negotiation context
- It's been on market 77 days — a 6% lower offer ($318k) is reasonable based on typical stale-listing flexibility.
Risks & watch-outs
- Climate carrying-cost: severe wind risk, 99% chance of damaging wind over 30y; extreme-heat days projected 7→22/yr by 2055 (HVAC capex compounding) — expect insurance premiums to compound above CPI over the hold.
Questions for the listing agent
- What do current leases actually rent for vs. the listed asking? Can we see a recent rent roll and the last 12 months of T-12 income?
- It's been on market 77 days. Have you received any prior offers? Is the seller open to a 10% concession, seller financing, or rate buy-down credit?
- Why hasn't it sold? Are there any deal-killer items the seller is aware of (foundation, flood, title, zoning, code violations)?
- Is there a deadline driving the sale (1031 exchange, divorce, estate, relocation)? That informs how much negotiation room exists.
- Schools are B-rated — typically a magnet for longer-tenancy family renters. What's the average tenant stay here, and is there a school-zone premium baked into asking?
- The area grade is low — what's the realistic commute time and amenity access for the typical tenant pool here? Any planned neighborhood developments (good or bad) we should know about?
- What's the average days-on-market for RENTAL listings here right now (not sales)? A rising rental-DOM trend means longer vacancies and softer asking-rent achievability than the comps imply.
- What's the recent tenant-quality profile in this submarket — average credit score on applications, eviction rate, late-payment / NSF rate, and stable-employment percentage? A property-management company in the area should have these aggregated.
- How much new for-sale + rental construction is in the pipeline within 1–3 miles? Heavy new supply typically softens prices + rents 12–24 months out; constrained supply supports both.
Investment metrics
- 1% rule
- 0.75% ✗
- Cap rate
- 5.07%
- Cash-on-cash
- -4.38%
- DSCR
- 0.81
- GRM
- 11.2
CMA / ARV
- ARV (median comp)
- $409,167
- List price
- $337,990
- Delta
- -17.40%
- Verdict
- UNDERPRICED
- Comps
- 20 within 1.0 mi
Show comp detail 12 sales within ~0.75 mi
| Address | Dist | Beds/Ba | Sqft | Sold | Price | $/sf | Match |
|---|---|---|---|---|---|---|---|
| 27034 Flower Isle Ln | 0.17mi | 4/3.0 | 2,262 (-2%) | 1mo | $375,315 | $166 | 89 |
| 4684 Peony Green Dr | 0.62mi | 4/3.0 | 2,190 (-5%) | 2mo | $359,990 | $164 | 61 |
| 2237 Sonder Shore Dr | 0.45mi | 4/3.0 | 2,554 (+11%) | 1mo | $379,990 | $149 | 60 |
| 5635 Birchwood Glen Dr | 0.69mi | 4/3.5 | 2,370 (+3%) | 2mo | $371,175 | $157 | 60 |
| 5619 Pearl Vista Dr | 0.64mi | 4/3.5 | 2,432 (+6%) | 1mo | $394,889 | $162 | 58 |
| 27411 Cinnamon Shores Dr | 0.69mi | 4/2.5 | 2,206 (-4%) | 1mo | $349,990 | $159 | 58 |
| 5627 Pearl Vista Dr | 0.66mi | 4/3.5 | 2,449 (+6%) | 1mo | $419,115 | $171 | 56 |
| 4784 Luna Landing Dr | 0.74mi | 4/3.0 | 2,168 (-6%) | 0mo | $335,990 | $155 | 55 |
| 5065 Marcasca Dr | 0.65mi | 4/3.0 | 2,102 (-9%) | 0mo | $331,990 | $158 | 55 |
| 4669 Cleo Day Dr | 0.68mi | 4/3.0 | 2,488 (+8%) | 1mo | $359,990 | $145 | 54 |
| 4680 Peony Green Dr | 0.62mi | 4/2.0 | 2,056 (-11%) | 0mo | $343,990 | $167 | 49 |
| 4633 Cleo Day Dr | 0.73mi | 4/2.0 | 2,135 (-7%) | 1mo | $309,990 | $145 | 48 |
Match score weights: distance 35% · size 25% · config 20% · recency 20%. Top-matched comps best support the ARV.
Projected returns pro-forma
-3.0% appreciation · 0.0% rent growth · sell at horizon
- IRR
- -27.1%
- Equity multiple
- 0.11×
- Total profit
- $-101,842
- Equity at exit
- $61,008
- IRR
- -40.2%
- Equity multiple
- -0.37×
- Total profit
- $-157,348
- Equity at exit
- $35,377
Cash invested: $114,567 (down + closing). Projections, not guarantees.
Landlord ↔ Tenant lean methodology
- Overall (STATE)
- 87 Strongly Landlord-Friendly
- State Texas
- 87 Strongly Landlord-Friendly · R+5
- County
- — inherits STATE
- City
- — inherits STATE
ZIP-level market 77493
- Rents YoY
- -0.8%
- Active inventory
- 2696
- Price-to-rent
- 9.2×
Monthly cashflow live
- Estimated rent
- $3,050 high interval (Pro) →
- Mortgage (P&I)
- −$2,146
- Tax est. 1.5%
- −$511 /mo · $6,138/yr
- Insurance
- −$170
- HOA
- −$0
- Vacancy / Maint / Mgmt
- −$640
- Net cashflow
- $-418
Break-even live
UW: 25.0% down · 7.5% · 30yr · 1.5% tax · 5.0% vac · 8.0% maint · 8.0% mgmt
Financing live
Cash to close
- Down payment
- $102,292
- Closing costs
- $12,275
- Reserves months
- —
- Total cash needed
- —
Loan-product check · same deal, 3 products live
Conventional
25% down · 7.5% · 30yr
- Down + closing
- —
- Monthly P&I
- —
- Monthly cashflow
- —
- DSCR
- —
- Eligible?
- —
Personal DTI + credit; lowest rate.
DSCR
20% down · 8.5% · 30yr
- Down + closing
- —
- Monthly P&I
- —
- Monthly cashflow
- —
- DSCR
- —
- Eligible?
- —
No personal income docs; deal must DSCR.
Hard money
10% down · 12.0% · 12mo
- Down + closing
- —
- Monthly P&I
- —
- Monthly cashflow
- —
- DSCR
- —
- Eligible?
- —
Short-term bridge; refi at stabilization.
Rent comps 22 comps
| Address | Beds | Baths | Sqft | Rent | $/sqft | DOM | Units | Dist |
|---|---|---|---|---|---|---|---|---|
| 27064 Beach Ball Dr Katy, TX | 3.0–4.0 | 2.5–3.5 | 1705 | $2,957 | $1.73 | 1d | 25 | 0.38mi |
| 1495 Twilight Green Dr Katy, TX | 3.0 | 2.5 | 2000 | $2,400 | $1.20 | 43d | 1 | 0.41mi |
| 27035 Beacon Glen Dr Katy, TX | 2.0–4.0 | 2.0–3.0 | 1890 | $3,949 | $2.09 | 1d | 16 | 0.45mi |
| 4633 Peony Green Dr Katy, TX | 5.0 | 3.0 | 2680 | $3,995 | $1.49 | 24d | 1 | 0.60mi |
| 5631 Pearl Vista Dr Katy, TX | 4.0 | 3.0 | 2039 | $3,000 | $1.47 | 20d | 1 | 0.66mi |
| 27327 Blue Pool Dr Katy, TX | 4.0 | 3.0 | 2100 | $2,600 | $1.24 | 43d | 1 | 0.78mi |
| 5819 Bright Keel Dr Katy, TX | 4.0 | 3.0 | 2598 | $2,400 | $0.92 | 43d | 1 | 0.84mi |
| 27507 Hudson Sands Ln Katy, TX | 4.0 | 3.0 | 2294 | $3,000 | $1.31 | 16d | 1 | 1.09mi |
| 3004 Fall Gold Ln Katy, TX | 5.0 | 3.0 | 2156 | $3,850 | $1.79 | 43d | 1 | 1.14mi |
| 3004 Fall Gold Ln Katy, TX | 5.0 | 3.0 | 2156 | $2,762 | $1.28 | 10d | 1 | 1.14mi |
| 3136 Wild Dunes Dr Katy, TX | 4.0 | 2.0 | 1776 | $2,355 | $1.33 | 12d | 1 | 1.16mi |
| 3041 Colusa Ridge Dr Katy, TX | 4.0 | 2.5 | 2263 | $2,500 | $1.10 | 12d | 1 | 1.17mi |
| 3124 Wild Dunes Dr Katy, TX | 4.0 | 2.0 | 1776 | $2,330 | $1.31 | 24d | 1 | 1.18mi |
| 3112 Wild Dunes Dr Katy, TX | 4.0 | 2.0 | 1776 | $2,330 | $1.31 | 24d | 1 | 1.20mi |
| 3076 Dylan Skyland Dr Katy, TX | 4.0 | 2.5 | 2240 | $3,395 | $1.52 | 24d | 1 | 1.23mi |
| 3020 Nori Shores Dr Katy, TX | 5.0 | 2.5 | 2408 | $3,995 | $1.66 | 24d | 1 | 1.24mi |
| 3020 Wild Dunes Dr Katy, TX | 4.0 | 2.0 | 1776 | $2,355 | $1.33 | 12d | 1 | 1.25mi |
| 3048 Majestic Sunrise Dr Katy, TX | 4.0 | 2.0 | 1670 | $2,275 | $1.36 | 24d | 1 | 1.30mi |
| 3057 Majestic Sunrise Dr Katy, TX | 4.0 | 2.0 | 1644 | $2,252 | $1.37 | 24d | 1 | 1.31mi |
| 6414 Orchid Beach Dr Katy, TX | 5.0 | 4.0 | 2490 | $3,000 | $1.20 | 12d | 1 | 1.40mi |
| 3104 Nori Shores Dr Katy, TX | 5.0 | 2.5 | 1947 | $3,695 | $1.90 | 3d | 1 | 1.41mi |
| 6427 Seafoam Lake Dr Katy, TX | 4.0 | 4.0 | 2479 | $3,000 | $1.21 | 1d | 1 | 1.45mi |
Listing history 13 events
-
2026-06-18days on market $337,990 Active 77 DOM
-
2026-06-17days on market $337,990 Active 76 DOM
-
2026-06-16days on market $337,990 Active 75 DOM
-
2026-06-15pricedays on market $337,990 Active 74 DOM
-
2026-06-09days on market $377,990 Active 68 DOM
-
2026-06-08days on market $377,990 Active 67 DOM
-
2026-06-07days on market $377,990 Active 66 DOM
-
2026-06-04days on market $377,990 Active 63 DOM
-
2026-06-03days on market $377,990 Active 62 DOM
-
2026-06-02days on market $377,990 Active 61 DOM
-
2026-06-01days on market $377,990 Active 60 DOM
-
2026-05-31days on market $377,990 Active 59 DOM
-
2026-04-02$377,990 Active 511-char remark
Show marketing remark (511 chars)
Sunterra brings a kind of excitement you won't find anywhere else in Katy, offering a lifestyle that feels fresh, inspired, and truly one-of-a-kind. Resort-style amenities, stunning water attractions, and thoughtful gathering spaces create a community experience that stands apart, giving residents more ways to relax, play, and enjoy time together. Its convenient location keeps shopping, dining, and major thoroughfares close at hand. Sunterra is where fun, comfort, and something truly special come together.
ⓘ Source: listings_history table (triggers on properties + properties_extension) + one-shot
backfill from property_details.listing_events for pre-trigger history.
Climate risk First Street
- Flood 1/10 Low FEMA zone X (unshaded) · 0% chance over 30 yrs
- Wildfire 4/10 Moderate
- Heat 9/10 Extreme 7 d/yr ≥111°F today · 22 d/yr by 30 yrs out
- Wind 9/10 Extreme 99% chance of damaging wind over 30 yrs
- Air quality 2/10 Low 1 unhealthy d/yr today · 2 by 30 yrs out
Nearby sold comps map
Loading sold comps map…
Walkable amenities ~0.75 mi
Loading nearby amenities…
Taxation est. · year 1
- Rental income
- $36,597
- − Mortgage interest
- −$22,920
- − Property taxes
- −$6,138
- − Insurance
- −$2,046
- − Repairs & maintenance
- −$2,928
- − Management
- −$2,928
- − Depreciation
- −$11,903
- Taxable loss
- −$12,265
- Est. tax savings @ 24.0%
- +$2,944
- After-tax cash flow
- $-2,077/yr
For passive investors: Depreciation is non-cash, so a rental often shows a tax loss while cash-flowing — sheltering income. Rental losses are passive: they offset passive income freely, and up to $25,000/yr can offset ordinary (W-2) income if you actively participate and your MAGI is under $100k (phasing out to $0 by $150k); unused losses carry forward. On sale, claimed depreciation is recaptured at up to 25%, and gains may owe capital-gains tax (a 1031 exchange can defer both). Figures are a year-1 estimate at your 24.0% rate — not tax advice; consult a CPA.
Condition & rehab AI · 2 photos
This single-family home in Sunterra Ironwood 2589 Plan is in good condition with a good exterior and well-maintained landscaping. A fresh coat of paint and some landscaping maintenance would significantly enhance its resale and rental value.
Value-add opportunities
- Both Paint exterior — Fresh paint enhances curb appeal and property value
- Both Landscaping — Well-maintained landscaping improves curb appeal and property value
Renovation cost estimate screening
Value-add ROI direction
- Both Paint exterior — Fresh paint enhances curb appeal and property value ↑
- Both Landscaping — Well-maintained landscaping improves curb appeal and property value ↑
ⓘ Cost ranges are severity-bucket heuristics (US national rule-of-thumb). Get contractor quotes + a written scope before underwriting a rehab budget.
Schools (NCES district)
- District
- Katy ISD
- NCES district ID
- 4825170
- Math proficiency
- 61% ▼ -7.00%
- Reading proficiency
- 63% ▼ -3.00%
- Median HH income
- $90,312
- Composite
- 56.59/100
- National rank
- #1146
- State rank
- #29 of 826 in TX
Livability — Katy
- Score
- 76/100
- State rank
- #111
- US rank
- #3613
Category grades
Schools grade is shown separately in the Schools card above.
Census & demographics
- County
- Harris County · 4,702,590 people
- City population
- 413,575
- Metro
- Houston-The Woodlands-Sugar Land, TX
- Population (ZIP)
- 71,484
- Household income
- $118,464
- Rent vs Own
- Severe rent burden
- 913.0
Population outlook (Harris County) Hauer SSP2
- Today (2025)
- 5,571,493 people
- By 2030
- 6,089,821 · +9.3%
- By 2040
- 7,142,806 · +28.2%
- By 2050
- 8,185,864 · +46.9%
- By 2075
- 10,574,329 · +89.8%
- By 2100
- 12,109,958 · +117.4%
Race, ethnicity, and origin ACS 2023
- Neighborhood character
- Highly diverse neighborhood (Simpson 0.73)
- Race & ethnicity
- White 36% Hispanic / Latino 33% Two or more races 16% Black 15% Asian 12%
- Hispanic origin (detail)
- Mexican 20%
- Common ancestry
- Lithuanian 2% Slovak 1% Italian 1%
- Foreign-born
- 21% · Canada, Vietnam, Jamaica
- Languages at home
- 64% English-only · Spanish 22% Vietnamese 5% French/Haitian/Cajun 4%
Political lean MEDSL · Harris
- 2024 margin
- Lean D (+5.5) · D 52.0% · R 46.4% · Other 1.6%
- 2008→2024 swing
- +3.9pp toward D · 2008: 1.6pp · 2024: 5.5pp
- All cycles
- 2024: D+5.5 2020: D+13.3 2016: D+12.4 2012: D+0.1 2008: D+1.6
Not yet ingested
- Civics
- —
Market trends
- HPI YoY
- ▼ -140.65%
- Current HPI
- 233.1683
- Rent YoY
- ▼ -0.80%
- Metro
- Houston-The Woodlands-Sugar Land, TX
- State GDP YoY
- ▲ 3.95%
- F500 in state
- 110
Industry mix (Fortune 500 HQ in TX)
| Industry | F500 HQs | Revenue |
|---|---|---|
| Energy | 16 | $1,198B |
|
||
| Technology | 5 | $198B |
|
||
| Engineering / Construction | 4 | $72B |
|
||
| Energy Services | 3 | $60B |
|
||
| Utilities | 3 | $41B |
|
||
| Healthcare | 2 | $330B |
|
||
Price history
1 event — show timeline
- 2026-04-02 Listed $377,990 Zillow
Cash-flow waterfall
monthlySold comps — $/sqft
last 12 mo · ≤1 miLoading sold comps…