2048 SW 28th Ter · Fort Lauderdale, FL
Flood risk 4/10 · Minor
- FEMA flood zone
- AH
- Chance of flooding over 30 yrs
- 0.23%
- Est. flood insurance / yr
- $1,142 – $2,507
Fire risk 1/10 · Minimal
- Est. fire insurance / yr
- $947 – $1,759
Heat risk 10/10 · Severe
- Hot days now (above 105°F)
- 6 days/yr
- Hot days in 30 yrs
- 22 days/yr
Wind risk 10/10 · Severe
- Chance of severe wind over 30 yrs
- 99.0%
Air-quality risk 2/10 · Minimal
- Unhealthy air days now
- 2 days/yr
- Unhealthy air days in 30 yrs
- 2 days/yr
Risk factors via First Street. Map © Google.
Why this score? — see what drove the D- grade
The composite is a weighted blend of 9 inputs, each scored 0–100. Each bar is that input's sub-score; the figure is the points it added to the 100-point composite (weight × sub-score).
- Cash flow +15.1/30.0
- DSCR +4.6/10.0
- Schools +4.1/10.0
- Livability +4.1/5.0
- 1% rule +2.9/10.0
- Rent growth +2.8/5.0
- Condition / age +2.5/5.0
- ARV discount +0.0/15.0
- Appreciation +0.0/10.0
$799,000
🖨 Deal sheet (PDF) 📄 Offer letter ✓ Due diligence
Listing remarks
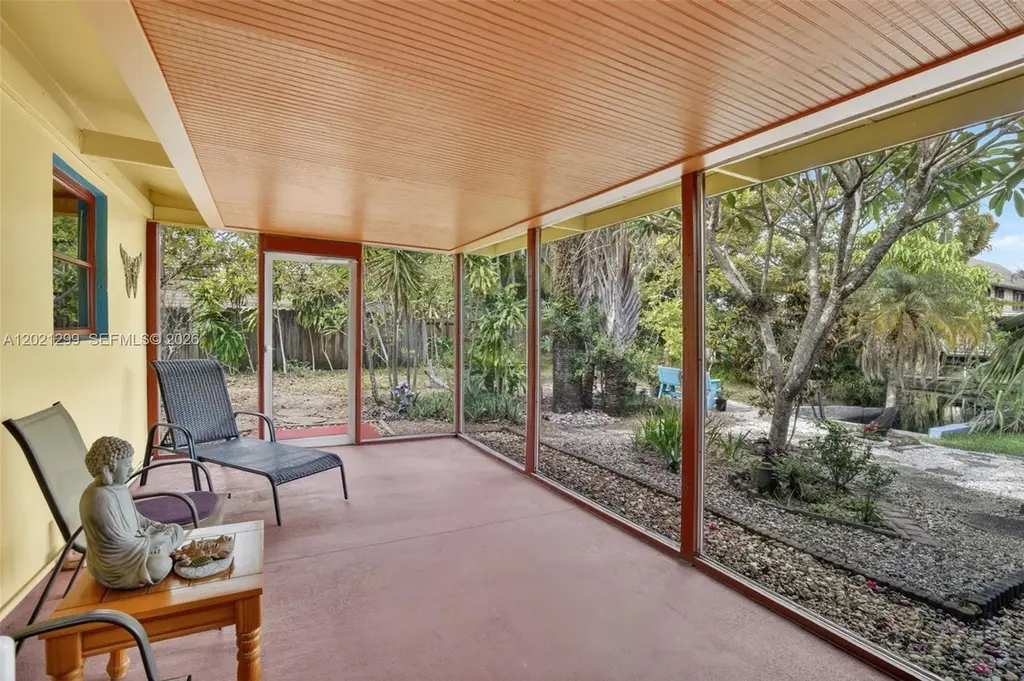
Fort Lauderdale waterfront lifestyle opportunity with ocean access, oversized lot, and no HOA for less than $1M. Welcome to this beautifully maintained home in a great location, quiet street on a dead end for less traffic; features 4 bedrooms, 2 bathrooms, spacious living and dining room, kitchen, screened in patio perfect for outdoor entertainment, a canal with direct ocean access that fits a boat up to 30 feet, carport and big enough driveway for up to 4 cars. Featuring a desirable split-bedroom floor plan, abundant natural light, and tasteful modern updates throughout, new vinyl waterproof flooring. Enjoy tropical outdoor living with mature fruit and palm trees, lush landscaping, screene
Key facts
- Quiet street
- Oversized lot
- Ocean access
Tags
Property features AI
Finance
- HOA & community: Street lights in the community
Exterior
- Parking: Covered driveway parking; Carport (1 space)
- Security: Storm/security shutters
- Utilities: Public water; Public sewer
- Home design: Single-story home; Faces west; Resale property
- Construction: Block construction; Shingle roof
- Exterior features: Enclosed porch; Screened porch; Fence; Shed; Storm/security shutters; Fruit trees; Room for pool; Canal access with fixed bridge and ocean access; Waterfront view
Interior
- Kitchen: Gas range; Dishwasher; Microwave; Refrigerator
- Bedrooms: At least one bedroom on the main level
- Flooring: Vinyl
- Bathrooms: 2 full bathrooms
- Heating & cooling: Central heating; Central air conditioning; Ceiling fans
- Interior features: First-floor entry; Bedroom on main level; Vaulted ceilings; Storage room
- Laundry & utility: Washer; Dryer
Neighborhood map
What this means for you Summary
Snapshot
- This is a 4-bed/2.0-bath single-family listed at $799k.
Deal economics
- At list price, monthly cash flow is $108 ($1k/yr) — positive.
- The deal already cash-flows at list — no discount required.
- To meet the 1% rule (rent ≥ 1% of price), the offer needs to be $627k (21.5% below list).
- Recommended offer: $627k (21.5% below list) — sets the bar for 1% rule.
- Cap rate 6.7% vs local median 2.2% in Fort Lauderdale — top-decile yield for the area; either an underpriced asset or a hidden risk that comps aren't pricing in. Stress-test before assuming the spread holds.
Location & tenants
- Location reads 82/100 on livability (#78 in FL, #1,293 nationally) — a professional / high-income tenant draw. Strengths: crime A+, amenities A+, health & safety A+; Watch: cost of living D-.
- Broward (suburban): math 42% / reading 53% proficiency, ranked #46 of 73 in FL (top 63%) — families likely to look elsewhere, expect single-tenant / working-renter base with shorter leases.
- Zoned schools: Nova Blanche Forman Elementary (math 35% / reading 55%, grade D-, #1,271 of 2,144 statewide, top 60%, 769 students, 72% FRL); New River Middle School (math 36% / reading 44%, grade F, #368 of 571 statewide, top 65%, 1,587 students, 70% FRL); Nova High School (math 22% / reading 56%, grade F, #312 of 667 statewide, top 48%, 2,227 students, 59% FRL) — zoned schools average 67% FRL vs 51% district-wide (16 pts higher); higher-poverty schools than district average — tighter screening recommended.
- Market conditions: Rents rising (+1.3%/yr); 420 active listings in the ZIP; 40 comparable units currently listed for rent nearby; rentals at typical pace (median 17d on market — plan ~3-4 weeks tenant-placement turnaround); solid renter incomes; 2,111 units permitted in Broward County in 2024 (1,265 in 5+ unit buildings).
- At $6,273/mo this rent would consume 99% of the median local household income ($76k/yr) (locally 1903% of renters already pay >50% of income on rent) — very limited rent-growth headroom before tenants either downsize or default.
Forward outlook
- Local home prices are declining (-3.0%/yr); year-one equity from $6k of loan paydown is wiped out by about $24k of value loss. Plan a longer hold.
- Broward County population projected at +34% by 2050 — long-run rental-demand tailwind backs the buy-and-hold thesis.
Negotiation context
- It's been on market 26 days — a 2% lower offer ($787k) is reasonable based on typical stale-listing flexibility.
- 2 sale attempts with the ask held roughly flat each time — persistent listings suggest the price (not the market) is what's stuck; bring a comps-based counter.
- Current owner paid $155k; list at $799k implies a 415% gain — meaningful room to come down on a strong offer.
Risks & watch-outs
- Watch-outs: flood insurance adds $152/mo.
- Climate carrying-cost: in FEMA flood zone AH (mandatory federal flood insurance); severe wind risk, 99% chance of damaging wind over 30y; extreme-heat days projected 6→22/yr by 2055 (HVAC capex compounding) — expect insurance premiums to compound above CPI over the hold.
Questions for the listing agent
- Built in 1968 — when were the roof, HVAC, electrical panel, plumbing, and water heater last replaced?
- What's the actual annual flood-insurance premium (NFIP or private), and is the property in a SFHA with mandatory coverage?
- Is there a deadline driving the sale (1031 exchange, divorce, estate, relocation)? That informs how much negotiation room exists.
- Schools are B-rated — typically a magnet for longer-tenancy family renters. What's the average tenant stay here, and is there a school-zone premium baked into asking?
- The area grade is low — what's the realistic commute time and amenity access for the typical tenant pool here? Any planned neighborhood developments (good or bad) we should know about?
- What's the average days-on-market for RENTAL listings here right now (not sales)? A rising rental-DOM trend means longer vacancies and softer asking-rent achievability than the comps imply.
- What's the recent tenant-quality profile in this submarket — average credit score on applications, eviction rate, late-payment / NSF rate, and stable-employment percentage? A property-management company in the area should have these aggregated.
- How much new for-sale + rental construction is in the pipeline within 1–3 miles? Heavy new supply typically softens prices + rents 12–24 months out; constrained supply supports both.
Investment metrics
- 1% rule
- 0.79% ✗
- Cap rate
- 6.68%
- Cash-on-cash
- 1.39%
- DSCR
- 1.06
- GRM
- 10.6
CMA / ARV
- ARV (on-the-fly)
- $684,218
- Comps found
- 5
Show comp detail 5 sales within ~0.75 mi
| Address | Dist | Beds/Ba | Sqft | Sold | Price | $/sf | Match |
|---|---|---|---|---|---|---|---|
| 3021 SW 23rd St | 0.32mi | 4/3.0 | 2,198 (+0%) | 4mo | $741,000 | $337 | 77 |
| 1561 SW 23rd Ave | 0.51mi | 5/3.0 (+1) | 2,233 (+2%) | 3mo | $1,150,000 | $515 | 61 |
| 2091 SW 29th Ave | 0.21mi | 3/2.0 (-1) | 1,998 (-9%) | 23mo | $625,000 | $313 | 52 |
| 1496 SW 30th Ter | 0.51mi | 4/2.0 | 1,885 (-14%) | 11mo | $489,900 | $260 | 44 |
| 3161 SW 20th St | 0.47mi | 3/2.0 (-1) | 1,970 (-10%) | 24mo | $499,500 | $254 | 37 |
Match score weights: distance 35% · size 25% · config 20% · recency 20%. Top-matched comps best support the ARV.
Projected returns pro-forma
-3.0% appreciation · 1.3% rent growth · sell at horizon
- IRR
- -17.1%
- Equity multiple
- 0.40×
- Total profit
- $-133,467
- Equity at exit
- $119,133
- IRR
- -12.2%
- Equity multiple
- 0.33×
- Total profit
- $-150,505
- Equity at exit
- $69,083
Cash invested: $223,720 (down + closing). Projections, not guarantees.
Landlord ↔ Tenant lean methodology
- Overall (STATE)
- 87 Strongly Landlord-Friendly
- State Florida
- 87 Strongly Landlord-Friendly · R+3
- County
- — inherits STATE
- City
- — inherits STATE
ZIP-level market 33312
- Rents YoY
- 1.3%
- Active inventory
- 420
- Price-to-rent
- 10.6×
Monthly cashflow live
- Estimated rent
- $6,273 high interval (Pro) →
- Mortgage (P&I)
- −$4,190
- Tax from tax record
- −$172 /mo · $2,068/yr
- Insurance
- −$333
- Flood insurance flood zone
- −$152 /mo · $1,824/yr
- HOA
- −$0
- Vacancy / Maint / Mgmt
- −$1,317
- Net cashflow
- $108
Break-even live
Sensitivity live
| Price | -10% $560 | -5% $334 | +0% $108 | +5% $-118 | +10% $-344 |
|---|---|---|---|---|---|
| Rent | -10% $-388 | -5% $-140 | +0% $108 | +5% $356 | +10% $603 |
| Rate | -1.0pp $510 | -0.5pp $311 | base $108 | +0.5pp $-99 | +1.0pp $-310 |
UW: 25.0% down · 7.5% · 30yr · 1.5% tax · 5.0% vac · 8.0% maint · 8.0% mgmt
Financing live
Cash to close
- Down payment
- $199,750
- Closing costs
- $23,970
- Reserves months
- —
- Total cash needed
- —
Loan-product check · same deal, 3 products live
Conventional
25% down · 7.5% · 30yr
- Down + closing
- —
- Monthly P&I
- —
- Monthly cashflow
- —
- DSCR
- —
- Eligible?
- —
Personal DTI + credit; lowest rate.
DSCR
20% down · 8.5% · 30yr
- Down + closing
- —
- Monthly P&I
- —
- Monthly cashflow
- —
- DSCR
- —
- Eligible?
- —
No personal income docs; deal must DSCR.
Hard money
10% down · 12.0% · 12mo
- Down + closing
- —
- Monthly P&I
- —
- Monthly cashflow
- —
- DSCR
- —
- Eligible?
- —
Short-term bridge; refi at stabilization.
Rent comps 40 comps
| Address | Beds | Baths | Sqft | Rent | $/sqft | DOM | Units | Dist |
|---|---|---|---|---|---|---|---|---|
| 2100 SW 28th Way Fort Lauderdale, FL | 5.0 | 4.0 | 2145 | $7,495 | $3.49 | 7d | 1 | 0.12mi |
| 2120 SW 28th Way Fort Lauderdale, FL | 5.0 | 3.0 | 2778 | $14,500 | $5.22 | 7d | 1 | 0.13mi |
| 1754 SW 28th Ter Fort Lauderdale, FL | 3.0 | 2.0 | 1432 | $6,750 | $4.71 | 9d | 1 | 0.14mi |
| 1773 SW 28th Way Fort Lauderdale, FL | 3.0 | 2.0 | 1430 | $4,350 | $3.04 | 26d | 1 | 0.15mi |
| 3160 SW 20th Ct Fort Lauderdale, FL | 4.0 | 3.0 | 1405 | $5,500 | $3.91 | 9d | 1 | 0.45mi |
| 2160 SW 16th Ct Fort Lauderdale, FL | 3.0 | 2.0 | 1850 | $3,900 | $2.11 | 26d | 1 | 0.61mi |
| 3138 SW 15th St Fort Lauderdale, FL | 3.0 | 2.0 | 1456 | $9,000 | $6.18 | 26d | 1 | 0.61mi |
| 3138 SW 15th St Fort Lauderdale, FL | 3.0 | 2.0 | 1456 | $9,000 | $6.18 | 9d | 1 | 0.61mi |
| 3340 SW 18th St Fort Lauderdale, FL | 4.0 | 2.0 | 1875 | $3,550 | $1.89 | 26d | 1 | 0.61mi |
| 3120 SW 12th Pl Fort Lauderdale, FL | 3.0 | 2.0 | 1532 | $2,950 | $1.93 | 26d | 1 | 0.75mi |
| 2600 Marina Bay Dr E Fort Lauderdale, FL | 1.0–3.0 | 1.5–2.0 | 1099 | $3,178 | $2.89 | 0d | 17 | 0.79mi |
| 1300 SW 34th Ave Unit n/a Fort Lauderdale, FL | 3.0 | 2.0 | 1634 | $3,500 | $2.14 | 26d | 1 | 0.86mi |
| 1930 SW 36th Ave Fort Lauderdale, FL | 5.0 | 2.5 | 2188 | $8,495 | $3.88 | 16d | 1 | 0.89mi |
| 1930 SW 36th Ave Fort Lauderdale, FL | 5.0 | 2.5 | 2188 | $8,295 | $3.79 | 7d | 1 | 0.89mi |
| 2518 Gulfstream Ln Fort Lauderdale, FL | 3.0 | 2.0 | 1550 | $4,800 | $3.10 | 26d | 1 | 0.92mi |
| 2518 Gulfstream Ln Fort Lauderdale, FL | 3.0 | 2.0 | 1550 | $4,800 | $3.10 | 6d | 1 | 0.92mi |
| 2320 SW 18th Ter #1 Fort Lauderdale, FL | 3.0 | 2.0 | 2598 | $2,700 | $1.04 | 14d | 1 | 0.96mi |
| 2320 SW 18th Ter #1 Fort Lauderdale, FL | 3.0 | 2.0 | 2598 | $2,600 | $1.00 | 6d | 1 | 0.96mi |
| 3421 SW 12th Ct Unit A Fort Lauderdale, FL | 3.0 | 1.0 | 1691 | $2,849 | $1.68 | 7d | 1 | 1.02mi |
| 3421 SW 12th Ct Unit A Fort Lauderdale, FL | 3.0 | 1.0 | 1691 | $2,849 | $1.68 | 26d | 1 | 1.02mi |
| 3421 SW 12th Ct Fort Lauderdale, FL | 3.0 | 1.0 | 1500 | $2,850 | $1.90 | 20d | 1 | 1.02mi |
| 1721 SW 23rd St Unit 1475645P Fort Lauderdale, FL | 5.0 | 3.5 | 2863 | $9,358 | $3.27 | 24d | 1 | 1.03mi |
| 2407 Nassau Ln Fort Lauderdale, FL | 3.0 | 2.0 | 1495 | $5,000 | $3.34 | 26d | 1 | 1.06mi |
| 2407 Nassau Ln Fort Lauderdale, FL | 3.0 | 2.0 | 1495 | $5,000 | $3.34 | 6d | 1 | 1.06mi |
| 630 SW 28th Dr Fort Lauderdale, FL | 3.0 | 2.0 | 1467 | $3,300 | $2.25 | 26d | 1 | 1.11mi |
| 2028 SW 16th Ter Unit 2028 Fort Lauderdale, FL | 4.0 | 3.5 | 2903 | $5,425 | $1.87 | 26d | 1 | 1.11mi |
| 1501 SW 21st St Fort Lauderdale, FL | 3.0 | 1.5 | 1946 | $2,900 | $1.49 | 26d | 1 | 1.17mi |
| 950 E Dayton Cir Fort Lauderdale, FL | 3.0 | 2.0 | 1521 | $2,699 | $1.77 | 17d | 1 | 1.20mi |
| 1454 SW 23rd St Fort Lauderdale, FL | 4.0 | 3.5 | 2831 | $7,000 | $2.47 | 26d | 1 | 1.21mi |
| 1502 SW 24th St Unit B Fort Lauderdale, FL | 3.0 | 2.0 | 2021 | $3,400 | $1.68 | 18d | 1 | 1.21mi |
| 1502 SW 24th St Unit B Fort Lauderdale, FL | 3.0 | 2.0 | 2021 | $3,400 | $1.68 | 17d | 1 | 1.21mi |
| 1759 SW 30th Pl Fort Lauderdale, FL | 5.0 | 3.0 | 2127 | $11,595 | $5.45 | 16d | 1 | 1.21mi |
| 610 Carolina Ave Unit 2 Fort Lauderdale, FL | 4.0 | 3.0 | 1865 | $2,000 | $1.07 | 16d | 1 | 1.25mi |
| 1541 SW 28th St Unit 1541 Fort Lauderdale, FL | 4.0 | 2.5 | 1782 | $3,950 | $2.22 | 26d | 1 | 1.26mi |
| 1541 SW 28th St Unit 1541 Fort Lauderdale, FL | 4.0 | 2.5 | 1782 | $3,950 | $2.22 | 3d | 1 | 1.26mi |
| 1435 SW 23rd Ct Fort Lauderdale, FL | 4.0 | 3.5 | 2738 | $6,750 | $2.47 | 6d | 1 | 1.27mi |
| 1427 SW 23rd St Fort Lauderdale, FL | 4.0 | 3.5 | 2632 | $7,000 | $2.66 | 26d | 1 | 1.28mi |
| 2637 Sugarloaf Ln Unit 2637 Fort Lauderdale, FL | 4.0 | 3.0 | 2326 | $8,000 | $3.44 | 16d | 1 | 1.29mi |
| 2637 Sugarloaf Ln Fort Lauderdale, FL | 4.0 | 3.0 | 2326 | $8,000 | $3.44 | 18d | 1 | 1.29mi |
| 2637 Sugarloaf Ln Fort Lauderdale, FL | 4.0 | 3.0 | 2292 | $8,000 | $3.49 | 6d | 1 | 1.29mi |
Listing history 23 events
-
2026-06-21days on market $799,000 Active 26 DOM
-
2026-06-18days on market $799,000 Active 23 DOM
-
2026-06-17days on market $799,000 Active 22 DOM
-
2026-06-16days on market $799,000 Active 21 DOM
-
2026-06-15days on market $799,000 Active 20 DOM
-
2026-06-13days on market $799,000 Active 18 DOM
-
2026-06-09days on market $799,000 Active 14 DOM
-
2026-06-08days on market $799,000 Active 13 DOM
-
2026-06-07days on market $799,000 Active 12 DOM
-
2026-06-04days on market $799,000 Active 9 DOM
-
2026-06-03days on market $799,000 Active 8 DOM
-
2026-06-02days on market $799,000 Active 7 DOM
-
2026-06-01days on market $799,000 Active 6 DOM
-
2026-05-31days on market $799,000 Active 5 DOM
-
2026-05-26$799,000 Active
-
2026-05-13historical
-
2026-01-30$799,000 Active
-
2000-04-13soldstatus $155,000
-
1995-01-04soldstatus $97,000
-
1990-01-25soldstatus $94,000
-
1988-12-28soldstatus $60,000
-
1983-07-01soldstatus $75,666
-
1980-06-01soldstatus $73,000
ⓘ Source: listings_history table (triggers on properties + properties_extension) + one-shot
backfill from property_details.listing_events for pre-trigger history.
Tax reassessment forecast FL · Resets to sale price
- Current annual tax
- $2,068 · $172/mo
- Projected year-2 tax
- $6,632 · $553/mo
- Expected delta
- +$4,563/yr (+$380/mo · 220.6%)
ⓘ Screening estimate from a state-policy table — verify with the county assessor before closing.
Climate risk First Street
- Flood 4/10 Moderate FEMA zone AH · 23% chance over 30 yrs
- Wildfire 1/10 Low
- Heat 10/10 Extreme 6 d/yr ≥105°F today · 22 d/yr by 30 yrs out
- Wind 10/10 Extreme 99% chance of damaging wind over 30 yrs
- Air quality 2/10 Low 2 unhealthy d/yr today · 2 by 30 yrs out
Nearby sold comps map
Loading sold comps map…
Walkable amenities ~0.75 mi
Loading nearby amenities…
Taxation est. · year 1
- Rental income
- $75,271
- − Mortgage interest
- −$44,756
- − Property taxes
- −$2,068
- − Insurance
- −$5,820
- − Repairs & maintenance
- −$6,022
- − Management
- −$6,022
- − Depreciation
- −$23,244
- Taxable loss
- −$12,660
- Est. tax savings @ 24.0%
- +$3,039
- After-tax cash flow
- $4,334/yr
For passive investors: Depreciation is non-cash, so a rental often shows a tax loss while cash-flowing — sheltering income. Rental losses are passive: they offset passive income freely, and up to $25,000/yr can offset ordinary (W-2) income if you actively participate and your MAGI is under $100k (phasing out to $0 by $150k); unused losses carry forward. On sale, claimed depreciation is recaptured at up to 25%, and gains may owe capital-gains tax (a 1031 exchange can defer both). Figures are a year-1 estimate at your 24.0% rate — not tax advice; consult a CPA.
Schools (NCES district)
- District
- Broward
- NCES district ID
- 1200180
- Math proficiency
- 42% ▼ -18.00%
- Reading proficiency
- 53% ▼ -5.00%
- Median HH income
- $52,139
- Composite
- 40.88/100
- National rank
- #3621
- State rank
- #46 of 73 in FL
Livability — Fort Lauderdale
- Score
- 82/100
- State rank
- #78
- US rank
- #1293
Category grades
Schools grade is shown separately in the Schools card above.
Census & demographics
- Census place
- Fort Lauderdale, FL
- County
- Broward County · 1,963,430 people
- City population
- 235,769
- Metro
- Miami-Fort Lauderdale-Pompano Beach, FL
- Population (ZIP)
- 52,798
- Household income
- $75,952
- Rent vs Own
- Severe rent burden
- 1903.0
Population outlook (Broward County) Hauer SSP2
- Today (2025)
- 2,207,033 people
- By 2030
- 2,360,704 · +7.0%
- By 2040
- 2,661,208 · +20.6%
- By 2050
- 2,946,698 · +33.5%
- By 2075
- 3,602,273 · +63.2%
- By 2100
- 3,970,984 · +79.9%
Race, ethnicity, and origin ACS 2023
- Neighborhood character
- Highly diverse neighborhood (Simpson 0.70)
- Race & ethnicity
- White 34% Hispanic / Latino 32% Black 29% Two or more races 20% Asian 2%
- Hispanic origin (detail)
- Mexican 2% Puerto Rican 5% Cuban 6% Salvadoran 1%
- Common ancestry
- Hispanic 6% Romanian 3% Italian 1%
- Foreign-born
- 33% · Canada, Jamaica, Dominican Republic
- Languages at home
- 59% English-only · Spanish 29% French/Haitian/Cajun 7% Other Indo-European 2%
Political lean MEDSL · Broward
- 2024 margin
- D (+17.0) · D 58.0% · R 41.0%
- 2008→2024 swing
- -17.8pp toward R · 2008: 34.7pp · 2024: 17.0pp
- All cycles
- 2024: D+17.0 2020: D+29.8 2016: D+35.0 2012: D+34.9 2008: D+34.7
Not yet ingested
- Civics
- —
Market trends
- HPI YoY
- ▼ -323.99%
- Current HPI
- 382.6298
- Rent YoY
- ▲ 1.30%
- Metro
- Miami-Fort Lauderdale-Pompano Beach, FL
- State GDP YoY
- ▲ 3.28%
- F500 in state
- 36
Industry mix (Fortune 500 HQ in FL)
| Industry | F500 HQs | Revenue |
|---|---|---|
| Industrial Technology | 2 | $29B |
|
||
| Insurance | 2 | $17B |
|
||
| Retail | 1 | $60B |
|
||
| Technology Distribution | 1 | $58B |
|
||
| Homebuilding | 1 | $35B |
|
||
| Technology Manufacturing | 1 | $35B |
|
||
Price history
+994.5% since first listed9 events — show timeline
- 2026-05-26 Listed $799,000 MARMLS
- 2026-05-13 Listing Removed — Beaches MLS
- 2026-01-30 Listed $799,000 Beaches MLS
- 2000-04-13 Sold (Public Records) $155,000 Public Records
- 1995-01-04 Sold (Public Records) $97,000 Public Records
- 1990-01-25 Sold (Public Records) $94,000 Public Records
- 1988-12-28 Sold (Public Records) $60,000 Public Records
- 1983-07-01 Sold (Public Records) $75,666 Public Records
- 1980-06-01 Sold (Public Records) $73,000 Public Records
Property tax history
+1.7%/yrLatest (2025): $2,068 · +9.7% YoY. Source: county tax records.
Cash-flow waterfall
monthlySold comps — $/sqft
last 12 mo · ≤1 miLoading sold comps…