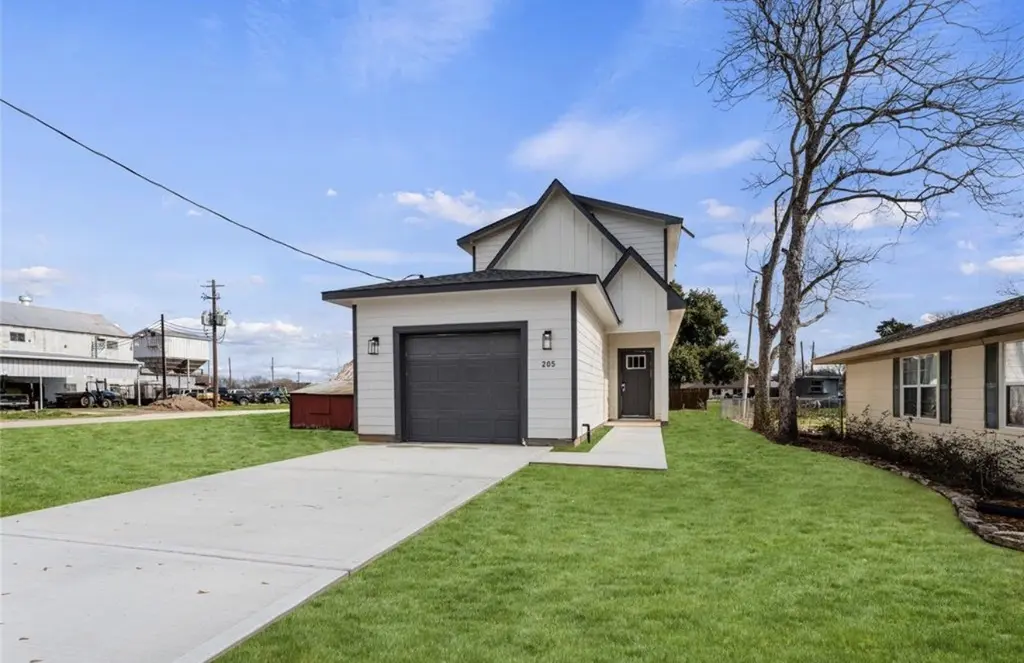
205 S Second St · Beasley, TX
Flood risk 6/10 · Moderate
- FEMA flood zone
- X (unshaded)
- Chance of flooding over 30 yrs
- 0.74%
- Est. flood insurance / yr
- $507 – $1,088
Fire risk 3/10 · Minor
- Est. fire insurance / yr
- $1,222 – $2,270
Heat risk 9/10 · Severe
- Hot days now (above 110°F)
- 7 days/yr
- Hot days in 30 yrs
- 22 days/yr
Wind risk 9/10 · Severe
- Chance of severe wind over 30 yrs
- 99.0%
Air-quality risk 2/10 · Minimal
- Unhealthy air days now
- 1 days/yr
- Unhealthy air days in 30 yrs
- 1 days/yr
Risk factors via First Street. Map © Google.
Why this score? — see what drove the B grade
The composite is a weighted blend of 9 inputs, each scored 0–100. Each bar is that input's sub-score; the figure is the points it added to the 100-point composite (weight × sub-score).
- Cash flow +26.0/30.0
- ARV discount +10.2/15.0
- DSCR +8.8/10.0
- Appreciation +7.1/10.0
- 1% rule +6.4/10.0
- Schools +4.6/10.0
- Livability +2.9/5.0
- Rent growth +2.5/5.0
- Condition / age +2.5/5.0
$245,000
🖨 Deal sheet (PDF) 📄 Offer letter ✓ Due diligence
Listing remarks MLS
Spacious corner lot in the heart of Beasley! This property has been well-maintained and is already cleared/ready for construction. Existing survey can be provided upon request. Call or email for more info.
Key facts
- Open concept
- 3,300 sq ft lot
- Garage
Tags
Property features AI
Finance
- Financial info: Owner will consider lease
Exterior
- Parking: Attached garage (1 car)
- Utilities: Public water; Public sewer
- Home design: Residential property; Built in 2024; Entry on slab foundation
- Construction: Brick and wood siding exterior; Shingle and wood roof; Slab foundation
- Exterior features: Subdivision lot
Interior
- Kitchen: Convection oven; Dishwasher; Gas range; Microwave
- Bathrooms: Two full bathrooms; One half bathroom
- Heating & cooling: Central gas heating; Central electric air conditioning
- Interior features: No fireplaces; 10 total rooms
- Laundry & utility: Washer hookup; Electric dryer hookup
Neighborhood map
What this means for you Summary
Snapshot
- This is a 3-bed/2.5-bath single-family listed at $245k.
Deal economics
- At list price, monthly cash flow is $610 ($7k/yr) — positive.
- The deal already cash-flows at list — no discount required.
- Meets the 1% rule at list price ($3k rent vs $245k).
- Recommended offer: $241k (1.5% below list) — sets the bar for market timing.
- Cap rate 9.3% vs local median 5.4% in Beasley — top-decile yield for the area; either an underpriced asset or a hidden risk that comps aren't pricing in. Stress-test before assuming the spread holds.
Location & tenants
- Location reads 57/100 on livability (#1,273 in TX) — a working-class tenant base; expect higher turnover. Strengths: cost of living A+, crime A; Watch: employment C-, schools D-, amenities F.
- Lamar CISD (suburban): math 50% / reading 53% proficiency, ranked #116 of 826 in TX (top 14%) — acceptable for families but not a draw, mixed tenant base, ~2y average lease.
- Market conditions: 232 active listings in the ZIP; 2 comparable units currently listed for rent nearby; 12,093 units permitted in Fort Bend County in 2024 (815 in 5+ unit buildings).
Forward outlook
- In year one you build about $12k of equity ($2k loan paydown + $10k appreciation (4.2% local appreciation)).
- Fort Bend County population projected at +75% by 2050 — long-run rental-demand tailwind backs the buy-and-hold thesis.
- At projected returns (4.2% appreciation + 3.0% rent growth), your $69k cash investment doubles in ~4 years — after that, you're playing with house money.
- By year 4, paydown + projected appreciation supports a ~$40k cash-out refi (75% LTV) — recoverable capital for the next deal without selling this one.
Negotiation context
- It's been on market 19 days — a 2% lower offer ($241k) is reasonable based on typical stale-listing flexibility.
- 2 sale attempts since 5y ago with the ask held roughly flat each time — persistent listings suggest the price (not the market) is what's stuck; bring a comps-based counter.
Risks & watch-outs
- Climate carrying-cost: major flood risk; severe wind risk, 99% chance of damaging wind over 30y; extreme-heat days projected 7→22/yr by 2055 (HVAC capex compounding) — expect insurance premiums to compound above CPI over the hold.
Questions for the listing agent
- Is there a deadline driving the sale (1031 exchange, divorce, estate, relocation)? That informs how much negotiation room exists.
- Schools are D-rated, which usually means shorter tenancies and higher turnover. Who's the typical renter profile here, and what's been the actual vacancy rate?
- What's the average days-on-market for RENTAL listings here right now (not sales)? A rising rental-DOM trend means longer vacancies and softer asking-rent achievability than the comps imply.
- What's the recent tenant-quality profile in this submarket — average credit score on applications, eviction rate, late-payment / NSF rate, and stable-employment percentage? A property-management company in the area should have these aggregated.
- How much new for-sale + rental construction is in the pipeline within 1–3 miles? Heavy new supply typically softens prices + rents 12–24 months out; constrained supply supports both.
Investment metrics
- 1% rule
- 1.14% ✓
- Cap rate
- 9.28%
- Cash-on-cash
- 10.68%
- DSCR
- 1.48
- GRM
- 7.3
CMA / ARV
- ARV (on-the-fly)
- $260,568
- Comps found
- 12
Show comp detail 12 sales within ~0.75 mi
| Address | Dist | Beds/Ba | Sqft | Sold | Price | $/sf | Match |
|---|---|---|---|---|---|---|---|
| 206 S 2nd St | 0.04mi | 3/2.0 | 1,368 (-1%) | 23mo | $295,000 | $216 | 75 |
| 7615 Avenue J | 0.35mi | 2/1.0 (-1) | 1,386 (0%) | 3mo | $275,000 | $198 | 70 |
| 214 N 8th St | 0.43mi | 3/1.5 | 1,404 (+1%) | 7mo | $110,000 | $78 | 68 |
| 403 N 5th St | 0.39mi | 3/2.0 | 1,368 (-1%) | 13mo | $294,999 | $216 | 67 |
| 210 S 2nd St | 0.03mi | 3/1.0 | 1,500 (+8%) | 18mo | $180,000 | $120 | 63 |
| 7025 Loop 540 | 0.12mi | 4/2.0 (+1) | 1,517 (+10%) | 16mo | $220,000 | $145 | 59 |
| 8014 Alamo Ct | 0.72mi | 3/2.0 | 1,364 (-2%) | 9mo | $272,987 | $200 | 54 |
| 319 N 9th St | 0.54mi | 3/1.0 | 1,301 (-6%) | 9mo | $124,900 | $96 | 51 |
| 215 N 8th St N | 0.45mi | 3/2.0 | 1,467 (+6%) | 20mo | $295,000 | $201 | 51 |
| 231 N 5th St | 0.31mi | 3/2.0 | 1,226 (-12%) | 19mo | $209,000 | $170 | 48 |
| 8015 Jim Bowie Ct | 0.66mi | 4/2.0 (+1) | 1,535 (+11%) | 6mo | $288,103 | $188 | 40 |
| 8015 Alamo Ct | 0.70mi | 4/2.0 (+1) | 1,535 (+11%) | 10mo | $278,843 | $182 | 34 |
Match score weights: distance 35% · size 25% · config 20% · recency 20%. Top-matched comps best support the ARV.
Projected returns pro-forma
4.15% appreciation · 3.0% rent growth · sell at horizon
- IRR
- 20.2%
- Equity multiple
- 2.22×
- Total profit
- $83,654
- Equity at exit
- $126,419
- IRR
- 20.5%
- Equity multiple
- 4.29×
- Total profit
- $225,390
- Equity at exit
- $208,545
Cash invested: $68,600 (down + closing). Projections, not guarantees.
Landlord ↔ Tenant lean methodology
- Overall (STATE)
- 87 Strongly Landlord-Friendly
- State Texas
- 87 Strongly Landlord-Friendly · R+5
- County
- — inherits STATE
- City
- — inherits STATE
ZIP-level market 77417
- Home prices YoY
- 1.2%
- Active inventory
- 232
- Price-to-rent
- 7.3×
Monthly cashflow live
- Estimated rent
- $2,804 medium interval (Pro) →
- Mortgage (P&I)
- −$1,285
- Tax from tax record
- −$218 /mo · $2,614/yr
- Insurance
- −$102
- HOA
- −$0
- Vacancy / Maint / Mgmt
- −$589
- Net cashflow
- $610
Break-even live
Sensitivity live
| Price | -10% $749 | -5% $680 | +0% $610 | +5% $541 | +10% $472 |
|---|---|---|---|---|---|
| Rent | -10% $389 | -5% $500 | +0% $610 | +5% $721 | +10% $832 |
| Rate | -1.0pp $734 | -0.5pp $673 | base $610 | +0.5pp $547 | +1.0pp $482 |
UW: 25.0% down · 7.5% · 30yr · 1.5% tax · 5.0% vac · 8.0% maint · 8.0% mgmt
Financing live
Cash to close
- Down payment
- $61,250
- Closing costs
- $7,350
- Reserves months
- —
- Total cash needed
- —
Loan-product check · same deal, 3 products live
Conventional
25% down · 7.5% · 30yr
- Down + closing
- —
- Monthly P&I
- —
- Monthly cashflow
- —
- DSCR
- —
- Eligible?
- —
Personal DTI + credit; lowest rate.
DSCR
20% down · 8.5% · 30yr
- Down + closing
- —
- Monthly P&I
- —
- Monthly cashflow
- —
- DSCR
- —
- Eligible?
- —
No personal income docs; deal must DSCR.
Hard money
10% down · 12.0% · 12mo
- Down + closing
- —
- Monthly P&I
- —
- Monthly cashflow
- —
- DSCR
- —
- Eligible?
- —
Short-term bridge; refi at stabilization.
Rent comps 2 comps
| Address | Beds | Baths | Sqft | Rent | $/sqft | DOM | Units | Dist |
|---|---|---|---|---|---|---|---|---|
| 402 N 4th St Beasley, TX | 3.0 | 2.5 | 1700 | $3,750 | $2.21 | 0d | 1 | 0.33mi |
| 119 S 8th St Beasley, TX | 3.0 | 2.0 | 1680 | $1,680 | $1.00 | 25d | 1 | 0.40mi |
Listing history 12 events
-
2026-06-21days on market $245,000 Active 19 DOM
-
2026-06-18days on market $245,000 Active 16 DOM
-
2026-06-17days on market $245,000 Active 15 DOM
-
2026-06-16days on market $245,000 Active 14 DOM
-
2026-06-15days on market $245,000 Active 13 DOM
-
2026-06-13days on market $245,000 Active 11 DOM
-
2026-06-09days on market $245,000 Active 7 DOM
-
2026-06-08days on market $245,000 Active 6 DOM
-
2026-06-07days on market $245,000 Active 5 DOM
-
2026-06-04days on market $245,000 Active 2 DOM
-
2026-06-02remarks 485-char remark
-
2026-06-02$245,000 Active 1 DOM
ⓘ Source: listings_history table (triggers on properties + properties_extension) + one-shot
backfill from property_details.listing_events for pre-trigger history.
Tax reassessment forecast TX · Resets to sale price
- Current annual tax
- $2,614 · $218/mo
- Projected year-2 tax
- $4,484 · $374/mo
- Expected delta
- +$1,869/yr (+$156/mo · 71.5%)
ⓘ Screening estimate from a state-policy table — verify with the county assessor before closing.
Climate risk First Street
- Flood 6/10 Major FEMA zone X (unshaded) · 74% chance over 30 yrs
- Wildfire 3/10 Moderate
- Heat 9/10 Extreme 7 d/yr ≥110°F today · 22 d/yr by 30 yrs out
- Wind 9/10 Extreme 99% chance of damaging wind over 30 yrs
- Air quality 2/10 Low 1 unhealthy d/yr today · 1 by 30 yrs out
Nearby sold comps map
Loading sold comps map…
Walkable amenities ~0.75 mi
Loading nearby amenities…
Taxation est. · year 1
- Rental income
- $33,646
- − Mortgage interest
- −$13,724
- − Property taxes
- −$2,614
- − Insurance
- −$1,225
- − Repairs & maintenance
- −$2,692
- − Management
- −$2,692
- − Depreciation
- −$7,127
- Taxable income
- $3,573
- Est. tax owed @ 24.0%
- −$857
- After-tax cash flow
- $6,466/yr
For passive investors: Depreciation is non-cash, so a rental often shows a tax loss while cash-flowing — sheltering income. Rental losses are passive: they offset passive income freely, and up to $25,000/yr can offset ordinary (W-2) income if you actively participate and your MAGI is under $100k (phasing out to $0 by $150k); unused losses carry forward. On sale, claimed depreciation is recaptured at up to 25%, and gains may owe capital-gains tax (a 1031 exchange can defer both). Figures are a year-1 estimate at your 24.0% rate — not tax advice; consult a CPA.
Schools (NCES district)
- District
- Lamar CISD
- NCES district ID
- 4826580
- Math proficiency
- 50% ▼ -12.00%
- Reading proficiency
- 53% ▼ -4.00%
- Median HH income
- $75,213
- Composite
- 46.43/100
- National rank
- #2452
- State rank
- #116 of 826 in TX
Livability — Beasley
- Score
- 57/100
- State rank
- #1273
- US rank
- #22130
Category grades
Schools grade is shown separately in the Schools card above.
Census & demographics
- Census place
- Beasley, TX
- Population (ZIP)
- 3,232
Population outlook (Fort Bend County) Hauer SSP2
- Today (2025)
- 1,004,526 people
- By 2030
- 1,153,104 · +14.8%
- By 2040
- 1,453,718 · +44.7%
- By 2050
- 1,753,781 · +74.6%
- By 2075
- 2,455,772 · +144.5%
- By 2100
- 2,930,528 · +191.7%
Race, ethnicity, and origin ACS 2023
- Neighborhood character
- Predominantly Hispanic (67%)
- Race & ethnicity
- Hispanic / Latino 67% Two or more races 49% White 22% Black 8%
- Hispanic origin (detail)
- Mexican 54%
- Common ancestry
- Italian 2% Romanian 1%
- Foreign-born
- 3% · Canada
- Languages at home
- 76% English-only · Spanish 24%
Political lean MEDSL · Fort Bend
- 2024 margin
- Toss-up / Even · D 49.5% · R 47.9% · Other 2.6%
- 2008→2024 swing
- +4.0pp toward D · 2008: -2.4pp · 2024: 1.6pp
- All cycles
- 2024: D+1.6 2020: D+10.6 2016: D+6.6 2012: R+6.8 2008: R+2.4
Not yet ingested
- Civics
- —
Market trends
- HPI YoY
- ▲ 4.15%
- Current HPI
- 337.8236
- Rent YoY
- —
- Metro
- —
- State GDP YoY
- ▲ 3.95%
- F500 in state
- 110
Industry mix (Fortune 500 HQ in TX)
| Industry | F500 HQs | Revenue |
|---|---|---|
| Energy | 16 | $1,198B |
|
||
| Technology | 5 | $198B |
|
||
| Engineering / Construction | 4 | $72B |
|
||
| Energy Services | 3 | $60B |
|
||
| Utilities | 3 | $41B |
|
||
| Healthcare | 2 | $330B |
|
||
Price history
+329.8% since first listed6 events — show timeline
- 2026-06-02 Listed $245,000 HARMLS
- 2023-05-26 Sold (Public Records) — Public Records
- 2022-01-21 Sold (MLS) — HARMLS
- 2022-01-05 Pending — HARMLS
- 2021-12-07 Listed $57,000 HARMLS
- 2021-07-19 Sold (Public Records) — Public Records
Property tax history
+17.0%/yrLatest (2025): $2,614 · +169.1% YoY. Source: county tax records.
Cash-flow waterfall
monthlySold comps — $/sqft
last 12 mo · ≤1 miLoading sold comps…