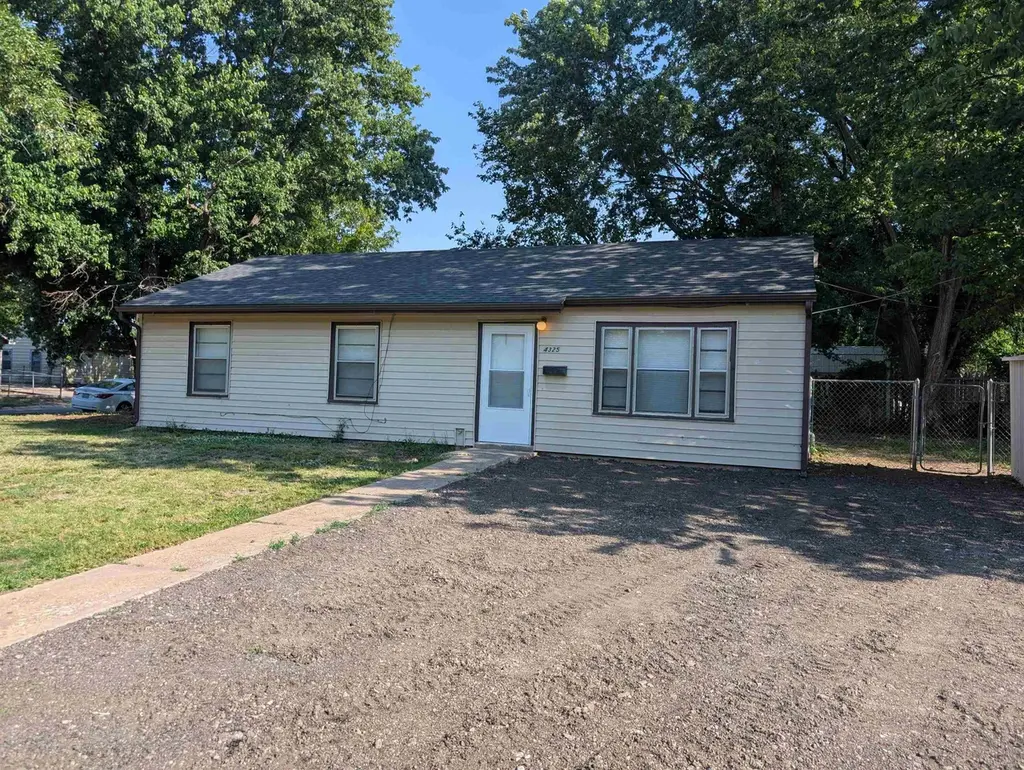
4325 S Dover · Oaklawn-Sunview, KS
Flood risk 1/10 · Minimal
- FEMA flood zone
- X (unshaded)
- Chance of flooding over 30 yrs
- 0.0%
- Est. flood insurance / yr
- $507 – $1,088
Fire risk 5/10 · Moderate
- Est. fire insurance / yr
- $1,154 – $2,142
Heat risk 5/10 · Moderate
- Hot days now (above 105°F)
- 7 days/yr
- Hot days in 30 yrs
- 16 days/yr
Wind risk 2/10 · Minimal
- Chance of severe wind over 30 yrs
- —
Air-quality risk 2/10 · Minimal
- Unhealthy air days now
- 1 days/yr
- Unhealthy air days in 30 yrs
- 1 days/yr
Risk factors via First Street. Map © Google.
Why this score? — see what drove the B- grade
The composite is a weighted blend of 9 inputs, each scored 0–100. Each bar is that input's sub-score; the figure is the points it added to the 100-point composite (weight × sub-score).
- Cash flow +30.0/30.0
- DSCR +10.0/10.0
- ARV discount +7.5/15.0
- 1% rule +7.2/10.0
- Rent growth +3.8/5.0
- Schools +2.9/10.0
- Livability +2.5/5.0
- Condition / age +2.5/5.0
- Appreciation +0.0/10.0
$105,000
🖨 Deal sheet (PDF) 📄 Offer letter ✓ Due diligence
Key facts
- Open floor plan
- Newer flooring
- Fenced in backyard
Tags
Property features AI
Exterior
- Utilities: Natural gas available; Public utilities
- Home design: Single-family onsite-built home
- Construction: Crawl space foundation; Composition roofing
- Exterior features: One-level layout; Crawl space foundation; Composition roof
Interior
- Bathrooms: 1 full bathroom
- Heating & cooling: Forced air heating (natural gas); Wall/window air conditioning unit(s)
- Interior features: Main-floor laundry; No basement
- Laundry & utility: Laundry located on the main floor
Neighborhood map
What this means for you Summary
Snapshot
- This is a 4-bed/1.0-bath single-family listed at $105k.
Deal economics
- At list price, monthly cash flow is $390 ($5k/yr) — positive.
- The deal already cash-flows at list — no discount required.
- Meets the 1% rule at list price ($1k rent vs $105k).
Location & tenants
- Location reads: area grade B — affects rentability + tenant quality, not the cash-flow math above.
- Derby (suburban): math 29% / reading 36% proficiency, ranked #66 of 169 in KS (top 39%) — families likely to look elsewhere, expect single-tenant / working-renter base with shorter leases.
- Zoned schools: Derby Hills Elem (math 32% / reading 37%, grade F, #388 of 684 statewide, top 61%, 384 students, 43% FRL); Derby Middle Sch (math 21% / reading 34%, grade F, #91 of 219 statewide, top 42%, 929 students, 46% FRL); Derby High School (math 17% / reading 21%, grade F, #230 of 327 statewide, top 71%, 2,172 students, 43% FRL).
- Market conditions: Rents rising fast (+5.2%/yr); 18 active listings in the ZIP; 5 comparable units currently listed for rent nearby; rentals at typical pace (median 25d on market — plan ~3-4 weeks tenant-placement turnaround); 2,613 units permitted in Sedgwick County in 2024 (258 in 5+ unit buildings).
- This rent runs 31% of the median local income ($49k/yr) — at the standard rent-burdened threshold; future hikes will face affordability resistance.
Forward outlook
- Local home prices are declining (-3.0%/yr); year-one equity from $726 of loan paydown is wiped out by about $3k of value loss. Plan a longer hold.
- Sedgwick County population projected at +5% by 2050 — modest demand growth; plan on rents tracking national, not racing it.
- At projected returns (-3.0% appreciation + 5.2% rent growth), your $29k cash investment doubles in ~7 years — after that, you're playing with house money.
Negotiation context
- Only 11 days on market — expect competitive offers; lowballing is unlikely to land.
- 2 sale attempts since 15y ago with the ask held roughly flat each time — persistent listings suggest the price (not the market) is what's stuck; bring a comps-based counter.
Risks & watch-outs
- Watch-outs: built in 1953 — expect roof / HVAC / electrical / plumbing capex.
- Climate carrying-cost: moderate wildfire risk; extreme-heat days projected 7→16/yr by 2055 (HVAC capex compounding) — expect insurance premiums to compound above CPI over the hold.
Questions for the listing agent
- Built in 1953 — when were the roof, HVAC, electrical panel, plumbing, and water heater last replaced?
- Is there a deadline driving the sale (1031 exchange, divorce, estate, relocation)? That informs how much negotiation room exists.
- What's the average days-on-market for RENTAL listings here right now (not sales)? A rising rental-DOM trend means longer vacancies and softer asking-rent achievability than the comps imply.
- What's the recent tenant-quality profile in this submarket — average credit score on applications, eviction rate, late-payment / NSF rate, and stable-employment percentage? A property-management company in the area should have these aggregated.
- How much new for-sale + rental construction is in the pipeline within 1–3 miles? Heavy new supply typically softens prices + rents 12–24 months out; constrained supply supports both.
Investment metrics
- 1% rule
- 1.22% ✓
- Cap rate
- 10.75%
- Cash-on-cash
- 15.94%
- DSCR
- 1.71
- GRM
- 6.8
CMA / ARV
No comps found within radius.
Projected returns pro-forma
-3.0% appreciation · 5.18% rent growth · sell at horizon
- IRR
- 9.0%
- Equity multiple
- 1.36×
- Total profit
- $10,672
- Equity at exit
- $15,656
- IRR
- 19.8%
- Equity multiple
- 2.82×
- Total profit
- $53,428
- Equity at exit
- $9,078
Cash invested: $29,400 (down + closing). Projections, not guarantees.
Landlord ↔ Tenant lean methodology
- Overall (STATE)
- 83 Strongly Landlord-Friendly
- State Kansas
- 83 Strongly Landlord-Friendly · R+10
- County
- — inherits STATE
- City
- — inherits STATE
ZIP-level market 67216
- Home prices YoY
- -19.5%
- Rents YoY
- 5.2%
- Active inventory
- 18
- Price-to-rent
- 6.8×
Monthly cashflow live
- Estimated rent
- $1,279 high interval (Pro) →
- Mortgage (P&I)
- −$551
- Tax from tax record
- −$26 /mo · $310/yr
- Insurance
- −$44
- HOA
- −$0
- Vacancy / Maint / Mgmt
- −$269
- Net cashflow
- $390
Break-even live
Sensitivity live
| Price | -10% $450 | -5% $420 | +0% $390 | +5% $361 | +10% $331 |
|---|---|---|---|---|---|
| Rent | -10% $289 | -5% $340 | +0% $390 | +5% $441 | +10% $491 |
| Rate | -1.0pp $443 | -0.5pp $417 | base $390 | +0.5pp $363 | +1.0pp $336 |
UW: 25.0% down · 7.5% · 30yr · 1.5% tax · 5.0% vac · 8.0% maint · 8.0% mgmt
Financing live
Cash to close
- Down payment
- $26,250
- Closing costs
- $3,150
- Reserves months
- —
- Total cash needed
- —
Loan-product check · same deal, 3 products live
Conventional
25% down · 7.5% · 30yr
- Down + closing
- —
- Monthly P&I
- —
- Monthly cashflow
- —
- DSCR
- —
- Eligible?
- —
Personal DTI + credit; lowest rate.
DSCR
20% down · 8.5% · 30yr
- Down + closing
- —
- Monthly P&I
- —
- Monthly cashflow
- —
- DSCR
- —
- Eligible?
- —
No personal income docs; deal must DSCR.
Hard money
10% down · 12.0% · 12mo
- Down + closing
- —
- Monthly P&I
- —
- Monthly cashflow
- —
- DSCR
- —
- Eligible?
- —
Short-term bridge; refi at stabilization.
Rent comps 5 comps
| Address | Beds | Baths | Sqft | Rent | $/sqft | DOM | Units | Dist |
|---|---|---|---|---|---|---|---|---|
| 4324 S Dover St Wichita, KS | 4.0 | 1.0 | 1008 | $1,145 | $1.14 | 22d | 1 | 0.00mi |
| 4269 S Greenhaven St Wichita, KS | 4.0 | 1.0 | 1101 | $1,050 | $0.95 | 25d | 1 | 0.09mi |
| 4269 S Cumberland St Wichita, KS | 4.0 | 1.0 | 1008 | $1,350 | $1.34 | 25d | 1 | 0.18mi |
| 2201 E Macarthur Rd Wichita, KS | 3.0 | 2.0 | 1424 | $1,012 | $0.71 | 15d | 1 | 0.79mi |
| 4853 S Madison Ave Wichita, KS | 3.0 | 1.0 | 1161 | $1,195 | $1.03 | 25d | 1 | 0.86mi |
Listing history 4 events
-
2026-05-16$110,000 Active
-
2011-09-12soldstatus
-
2011-08-02soldstatus
-
2011-07-13$15,000
ⓘ Source: listings_history table (triggers on properties + properties_extension) + one-shot
backfill from property_details.listing_events for pre-trigger history.
Tax reassessment forecast KS · Resets to sale price
- Current annual tax
- $310 · $26/mo
- Projected year-2 tax
- $1,480 · $123/mo
- Expected delta
- +$1,171/yr (+$98/mo · 377.6%)
ⓘ Screening estimate from a state-policy table — verify with the county assessor before closing.
Climate risk First Street
- Flood 1/10 Low FEMA zone X (unshaded) · 0% chance over 30 yrs
- Wildfire 5/10 Major
- Heat 5/10 Major 7 d/yr ≥105°F today · 16 d/yr by 30 yrs out
- Wind 2/10 Low
- Air quality 2/10 Low 1 unhealthy d/yr today · 1 by 30 yrs out
Nearby sold comps map
Loading sold comps map…
Walkable amenities ~0.75 mi
Loading nearby amenities…
Taxation est. · year 1
- Rental income
- $15,351
- − Mortgage interest
- −$5,882
- − Property taxes
- −$310
- − Insurance
- −$525
- − Repairs & maintenance
- −$1,228
- − Management
- −$1,228
- − Depreciation
- −$3,055
- Taxable income
- $3,124
- Est. tax owed @ 24.0%
- −$750
- After-tax cash flow
- $3,935/yr
For passive investors: Depreciation is non-cash, so a rental often shows a tax loss while cash-flowing — sheltering income. Rental losses are passive: they offset passive income freely, and up to $25,000/yr can offset ordinary (W-2) income if you actively participate and your MAGI is under $100k (phasing out to $0 by $150k); unused losses carry forward. On sale, claimed depreciation is recaptured at up to 25%, and gains may owe capital-gains tax (a 1031 exchange can defer both). Figures are a year-1 estimate at your 24.0% rate — not tax advice; consult a CPA.
Schools (NCES district)
- District
- Derby
- NCES district ID
- 2005460
- Math proficiency
- 29% ▼ -3.00%
- Reading proficiency
- 36% ▲ 1.00%
- Median HH income
- $60,460
- Composite
- 29.25/100
- National rank
- #6564
- State rank
- #66 of 169 in KS
Livability — Oaklawn-Sunview
No livability data for this city. (Only ~50 U.S. cities are tracked.)
Census & demographics
- Census place
- Oaklawn-Sunview, KS
- County
- Sedgwick County · 432,957 people
- Metro
- Wichita, KS
- Population (ZIP)
- 23,254
- Household income
- $48,902
- Rent vs Own
- Severe rent burden
- 980.0
Population outlook (Sedgwick County) Hauer SSP2
- Today (2025)
- 537,014 people
- By 2030
- 546,984 · +1.9%
- By 2040
- 559,141 · +4.1%
- By 2050
- 562,027 · +4.7%
- By 2075
- 557,255 · +3.8%
- By 2100
- 513,383 · -4.4%
Race, ethnicity, and origin ACS 2023
- Neighborhood character
- Diverse neighborhood (Simpson 0.67)
- Race & ethnicity
- White 51% Hispanic / Latino 25% Two or more races 16% Asian 8% Black 5% Native American 1%
- Hispanic origin (detail)
- Mexican 19% Puerto Rican 3%
- Common ancestry
- Romanian 1% Slovak 1% Lithuanian 1%
- Foreign-born
- 12% · Canada, Vietnam
- Languages at home
- 78% English-only · Spanish 16% Other Asian/Pacific 3% Vietnamese 1%
Political lean MEDSL · Sedgwick
- 2024 margin
- R (+13.8) · D 42.3% · R 56.1% · Other 1.6%
- 2008→2024 swing
- -1.1pp toward R · 2008: -12.7pp · 2024: -13.8pp
- All cycles
- 2024: R+13.8 2020: R+12.6 2016: R+19.1 2012: R+19.7 2008: R+12.7
Not yet ingested
- Civics
- —
Market trends
- HPI YoY
- ▼ -53.94%
- Current HPI
- 223.3077
- Rent YoY
- ▲ 5.18%
- Metro
- Wichita, KS
- State GDP YoY
- —
- F500 in state
- 0
Price history
+633.3% since first listed4 events — show timeline
- 2026-05-16 Listed $110,000 SCKMLS as Distributed by MLS Grid
- 2011-09-12 Sold (Public Records) — Public Records
- 2011-08-02 Sold (Public Records) — Public Records
- 2011-07-13 Listed $15,000 SCKMLS as Distributed by MLS Grid
Property tax history
+1.5%/yrLatest (2025): $310 · +4.2% YoY. Source: county tax records.
Cash-flow waterfall
monthlySold comps — $/sqft
last 12 mo · ≤1 miLoading sold comps…