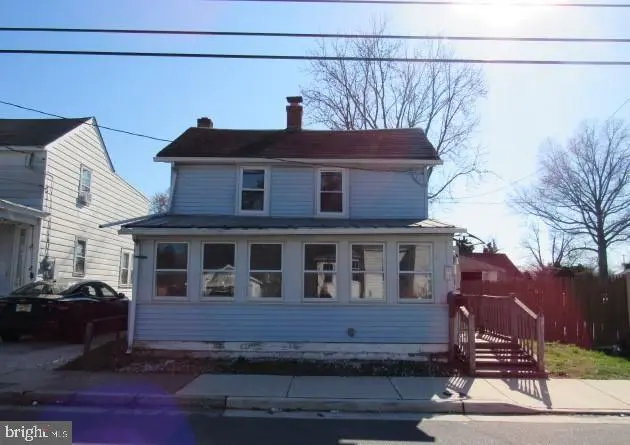
21 E Pittsfield St · Pennsville, NJ
Flood risk 8/10 · Major
- FEMA flood zone
- AE
- Chance of flooding over 30 yrs
- 0.96%
- Est. flood insurance / yr
- $1,737 – $8,500
Fire risk 1/10 · Minimal
- Est. fire insurance / yr
- $526 – $976
Heat risk 7/10 · Major
- Hot days now (above 102°F)
- 7 days/yr
- Hot days in 30 yrs
- 15 days/yr
Wind risk 6/10 · Moderate
- Chance of severe wind over 30 yrs
- 27.0%
Air-quality risk 3/10 · Minor
- Unhealthy air days now
- 3 days/yr
- Unhealthy air days in 30 yrs
- 5 days/yr
Risk factors via First Street. Map © Google.
Why this score? — see what drove the B- grade
The composite is a weighted blend of 9 inputs, each scored 0–100. Each bar is that input's sub-score; the figure is the points it added to the 100-point composite (weight × sub-score).
- Cash flow +30.0/30.0
- 1% rule +10.0/10.0
- DSCR +10.0/10.0
- ARV discount +7.5/15.0
- Livability +3.6/5.0
- Schools +2.6/10.0
- Rent growth +2.5/5.0
- Condition / age +2.5/5.0
- Appreciation +0.0/10.0
$120,000
🖨 Deal sheet 📄 Offer letter ✓ Due diligence
Listing remarks
Charming 2-story home with great potential! This 2-bedroom, 1-bath property offers a functional layout featuring a spacious living room, formal dining room, and a large kitchen with plenty of room for customization. Enjoy additional living space with an enclosed porch—perfect for relaxing or entertaining. The property also includes a detached 1-car garage for added convenience. With a little TLC, this home can truly shine !Year built 1853--possible lead based paint. Insured Escrow (IE) for FHA financing. This property is located in a FEMA Flood Zone. Eligible for FHA 203K. Buyer to verify all information. Sold in AS IS condition--there is no warranty as to condition of property. Equal
Key facts
- Formal dining room
- Large kitchen
- Enclosed porch
Tags
Property features AI
Finance
- Financial info: Ownership: Fee simple
Exterior
- Parking: On-street parking
- Utilities: Public water; Public sewer; Electric cooling fuel; Oil for heating and hot water
- Home design: Detached single-family; Above-grade finished area about 1,084 (estimated)
- Construction: Frame construction; Crawl space foundation; Above-grade and below-grade structures noted; Year built (source: assessor)
- Exterior features: Lot approximately 33 x 86 (estimated); No tidal water
Interior
- Kitchen: Kitchen (appliances not specified)
- Bedrooms: Two bedrooms on the upper level
- Bathrooms: One full bathroom on the main level; One full bathroom total
- Heating & cooling: Hot water heating (oil-fired); Central air conditioning (electric)
- Interior features: Estimated living area; No basement; Living room and dining room
- Laundry & utility: Hot water provided by oil
Neighborhood map
What this means for you Summary
Snapshot
- This is a 2-bed/1.0-bath single-family listed at $120k.
Deal economics
- At list price, monthly cash flow is $227 ($3k/yr) — positive.
- The deal already cash-flows at list — no discount required.
- Meets the 1% rule at list price ($2k rent vs $120k).
- Recommended offer: $116k (3.0% below list) — sets the bar for market timing.
- Cap rate 12.8% vs local median 3.6% in Pennsville — top-decile yield for the area; either an underpriced asset or a hidden risk that comps aren't pricing in. Stress-test before assuming the spread holds.
Location & tenants
- Location reads 72/100 on livability (#225 in NJ) — a middle-class / working-renter tenant base. Strengths: housing A+, health & safety A+, cost of living A-; Watch: schools C-, amenities F, commute F.
- Pennsville Public School District (suburban): math 12% / reading 45% proficiency, ranked #356 of 472 in NJ (top 75%) — low school quality limits family demand, transient renter base, plan for 1-2y turnover.
- Market conditions: 84 active listings in the ZIP; 2 comparable units currently listed for rent nearby; 95 units permitted in Salem County in 2024 (0 in 5+ unit buildings).
Forward outlook
- Local home prices are declining (-3.0%/yr); year-one equity from $830 of loan paydown is wiped out by about $4k of value loss. Plan a longer hold.
- Salem County population projected at -23% by 2050 — secular population decline; favor cash flow + early exit over multi-decade hold.
Negotiation context
- It's been on market 46 days — a 3% lower offer ($116k) is reasonable based on typical stale-listing flexibility.
- Current owner paid $12k; list at $120k implies a 900% gain — meaningful room to come down on a strong offer.
Risks & watch-outs
- Watch-outs: property tax is 4.1% of price; flood insurance adds $427/mo; built in 1853 — expect roof / HVAC / electrical / plumbing capex.
- Climate carrying-cost: in FEMA flood zone AE (mandatory federal flood insurance); major wind risk, 27% chance of damaging wind over 30y; extreme-heat days projected 7→15/yr by 2055 (HVAC capex compounding) — expect insurance premiums to compound above CPI over the hold.
Questions for the listing agent
- It's been on market 46 days. Have you received any prior offers? Is the seller open to a 3% concession, seller financing, or rate buy-down credit?
- Built in 1853 — when were the roof, HVAC, electrical panel, plumbing, and water heater last replaced?
- Property tax is high relative to price — has the assessment been appealed recently, and will the sale trigger a re-assessment?
- What's the actual annual flood-insurance premium (NFIP or private), and is the property in a SFHA with mandatory coverage?
- Is there a deadline driving the sale (1031 exchange, divorce, estate, relocation)? That informs how much negotiation room exists.
- What's the average days-on-market for RENTAL listings here right now (not sales)? A rising rental-DOM trend means longer vacancies and softer asking-rent achievability than the comps imply.
- What's the recent tenant-quality profile in this submarket — average credit score on applications, eviction rate, late-payment / NSF rate, and stable-employment percentage? A property-management company in the area should have these aggregated.
- How much new for-sale + rental construction is in the pipeline within 1–3 miles? Heavy new supply typically softens prices + rents 12–24 months out; constrained supply supports both.
Investment metrics
- 1% rule
- 1.83% ✓
- Cap rate
- 12.83%
- Cash-on-cash
- 23.34%
- DSCR
- 2.04
- GRM
- 4.5
CMA / ARV
- ARV (on-the-fly)
- $251,604
- Comps found
- 12
Show comp detail 12 sales within ~0.75 mi
| Address | Dist | Beds/Ba | Sqft | Sold | Price | $/sf | Match |
|---|---|---|---|---|---|---|---|
| 64 Sparks Ave | 0.44mi | 3/1.0 (+1) | 999 (-4%) | 2mo | $275,000 | $275 | 66 |
| 11 Amherst Dr | 0.57mi | 3/1.0 (+1) | 1,021 (-2%) | 2mo | $225,000 | $220 | 64 |
| 117 E Pittsfield St | 0.46mi | 2/1.0 | 1,131 (+8%) | 4mo | $252,500 | $223 | 62 |
| 29 Harding Ave | 0.45mi | 3/1.0 (+1) | 960 (-8%) | 0mo | $170,000 | $177 | 60 |
| 112 Highland Ave | 0.47mi | 3/1.0 (+1) | 970 (-7%) | 2mo | $250,000 | $258 | 60 |
| 41 Harding Ave | 0.47mi | 2/1.0 | 924 (-12%) | 0mo | $212,000 | $229 | 58 |
| 42 Lakeview Ave | 0.48mi | 3/2.0 (+1) | 1,095 (+5%) | 8mo | $230,000 | $210 | 54 |
| 32 Brandriff Ave | 0.54mi | 3/1.0 (+1) | 960 (-8%) | 5mo | $265,000 | $276 | 52 |
| 27 New Jersey Ave | 0.62mi | 3/1.0 (+1) | 1,120 (+7%) | 9mo | $270,000 | $241 | 46 |
| 10 Morningside Dr | 0.61mi | 3/1.0 (+1) | 960 (-8%) | 11mo | $250,000 | $260 | 44 |
| 126 Annapolis Rd | 0.61mi | 3/1.0 (+1) | 1,190 (+14%) | 1mo | $292,000 | $245 | 42 |
| 69 Union St | 0.49mi | 3/2.0 (+1) | 1,199 (+15%) | 10mo | $235,000 | $196 | 35 |
Match score weights: distance 35% · size 25% · config 20% · recency 20%. Top-matched comps best support the ARV.
Projected returns pro-forma
-3.0% appreciation · 3.0% rent growth · sell at horizon
- IRR
- -3.6%
- Equity multiple
- 0.87×
- Total profit
- $-4,528
- Equity at exit
- $17,892
- IRR
- 6.5%
- Equity multiple
- 1.49×
- Total profit
- $16,520
- Equity at exit
- $10,375
Cash invested: $33,600 (down + closing). Projections, not guarantees.
Landlord ↔ Tenant lean methodology
- Overall (STATE)
- 21 Tenant-Leaning
- State New Jersey
- 21 Tenant-Leaning · D+6
- County
- — inherits STATE
- City
- — inherits STATE
ZIP-level market 08070
- Home prices YoY
- -23.7%
- Active inventory
- 84
- Price-to-rent
- 4.5×
Monthly cashflow live
- Estimated rent
- $2,200 medium interval (Pro) →
- Mortgage (P&I)
- −$629
- Tax from tax record
- −$405 /mo · $4,861/yr
- Insurance
- −$50
- Flood insurance flood zone
- −$427 /mo · $5,118/yr
- HOA
- −$0
- Vacancy / Maint / Mgmt
- −$462
- Net cashflow
- $227
Break-even live
UW: 25.0% down · 7.5% · 30yr · 1.5% tax · 5.0% vac · 8.0% maint · 8.0% mgmt
Financing live
Cash to close
- Down payment
- $30,000
- Closing costs
- $3,600
- Reserves months
- —
- Total cash needed
- —
Loan-product check · same deal, 3 products live
Conventional
25% down · 7.5% · 30yr
- Down + closing
- —
- Monthly P&I
- —
- Monthly cashflow
- —
- DSCR
- —
- Eligible?
- —
Personal DTI + credit; lowest rate.
DSCR
20% down · 8.5% · 30yr
- Down + closing
- —
- Monthly P&I
- —
- Monthly cashflow
- —
- DSCR
- —
- Eligible?
- —
No personal income docs; deal must DSCR.
Hard money
10% down · 12.0% · 12mo
- Down + closing
- —
- Monthly P&I
- —
- Monthly cashflow
- —
- DSCR
- —
- Eligible?
- —
Short-term bridge; refi at stabilization.
Rent comps 2 comps
| Address | Beds | Baths | Sqft | Rent | $/sqft | DOM | Units | Dist |
|---|---|---|---|---|---|---|---|---|
| 10 Jefferson Rd Pennsville, NJ | 2.0 | 1.0 | 816 | $2,200 | $2.70 | 1d | 1 | 1.22mi |
| 10 Jefferson Rd Pennsville, NJ | 2.0 | 1.0 | 816 | $2,200 | $2.70 | 10d | 1 | 1.22mi |
Listing history 3 events
-
2026-05-19status Pending
-
2026-04-03$120,000 Active
-
1984-08-24soldstatus $12,000
ⓘ Source: listings_history table (triggers on properties + properties_extension) + one-shot
backfill from property_details.listing_events for pre-trigger history.
Tax reassessment forecast NJ · Partial reset (capped growth)
- Current annual tax
- $4,861 · $405/mo
- Projected year-2 tax
- $4,861 · $405/mo
- Expected delta
- $0/yr ($0/mo · 0.0%)
ⓘ Screening estimate from a state-policy table — verify with the county assessor before closing.
Climate risk First Street
- Flood 8/10 Severe FEMA zone AE · 96% chance over 30 yrs
- Wildfire 1/10 Low
- Heat 7/10 Severe 7 d/yr ≥102°F today · 15 d/yr by 30 yrs out
- Wind 6/10 Major 27% chance of damaging wind over 30 yrs
- Air quality 3/10 Moderate 3 unhealthy d/yr today · 5 by 30 yrs out
Nearby sold comps map
Loading sold comps map…
Walkable amenities ~0.75 mi
Loading nearby amenities…
Taxation est. · year 1
- Rental income
- $26,400
- − Mortgage interest
- −$6,722
- − Property taxes
- −$4,861
- − Insurance
- −$5,718
- − Repairs & maintenance
- −$2,112
- − Management
- −$2,112
- − Depreciation
- −$3,491
- Taxable income
- $1,384
- Est. tax owed @ 24.0%
- −$332
- After-tax cash flow
- $2,393/yr
For passive investors: Depreciation is non-cash, so a rental often shows a tax loss while cash-flowing — sheltering income. Rental losses are passive: they offset passive income freely, and up to $25,000/yr can offset ordinary (W-2) income if you actively participate and your MAGI is under $100k (phasing out to $0 by $150k); unused losses carry forward. On sale, claimed depreciation is recaptured at up to 25%, and gains may owe capital-gains tax (a 1031 exchange can defer both). Figures are a year-1 estimate at your 24.0% rate — not tax advice; consult a CPA.
Schools (NCES district)
- District
- Pennsville Public School District
- NCES district ID
- 3409120
- Math proficiency
- 12% ▼ -26.00%
- Reading proficiency
- 45% ▬ 0.00%
- Median HH income
- $58,237
- Composite
- 25.61/100
- National rank
- #7411
- State rank
- #356 of 472 in NJ
Livability — Pennsville
- Score
- 72/100
- State rank
- #225
- US rank
- #6134
Category grades
Schools grade is shown separately in the Schools card above.
Census & demographics
- Census place
- Pennsville, NJ
- City population
- 12,766
- Population (ZIP)
- 12,477
Population outlook (Salem County) Hauer SSP2
- Today (2025)
- 59,905 people
- By 2030
- 57,351 · -4.3%
- By 2040
- 51,837 · -13.5%
- By 2050
- 46,356 · -22.6%
- By 2075
- 36,452 · -39.2%
- By 2100
- 28,907 · -51.7%
Race, ethnicity, and origin ACS 2023
- Neighborhood character
- Predominantly White (84%)
- Race & ethnicity
- White 84% Hispanic / Latino 7% Two or more races 5% Black 4%
- Hispanic origin (detail)
- Mexican 1% Puerto Rican 4%
- Common ancestry
- Romanian 6% Slovak 2% Lithuanian 1%
- Foreign-born
- 3% · Canada
- Languages at home
- 93% English-only · Other Indo-European 4% Spanish 2%
Political lean MEDSL · Salem
- 2024 margin
- R (+19.2) · D 39.6% · R 58.8% · Other 1.6%
- 2008→2024 swing
- -23.1pp toward R · 2008: 3.9pp · 2024: -19.2pp
- All cycles
- 2024: R+19.2 2020: R+12.8 2016: R+15.4 2012: D+0.8 2008: D+3.9
Not yet ingested
- Civics
- —
Market trends
- HPI YoY
- ▼ -85.34%
- Current HPI
- 275.2185
- Rent YoY
- —
- Metro
- —
- State GDP YoY
- ▲ 2.05%
- F500 in state
- 34
Industry mix (Fortune 500 HQ in NJ)
| Industry | F500 HQs | Revenue |
|---|---|---|
| Consumer Goods | 3 | $31B |
|
||
| Pharmaceuticals | 2 | $153B |
|
||
| Technology | 2 | $21B |
|
||
| Insurance | 2 | $20B |
|
||
| Healthcare | 2 | $19B |
|
||
| Financial Services | 1 | $70B |
|
||
Price history
+900.0% since first listed3 events — show timeline
- 2026-05-19 Pending — BRIGHT MLS
- 2026-04-03 Listed $120,000 BRIGHT MLS
- 1984-08-24 Sold (Public Records) $12,000 Public Records
Property tax history
+3.6%/yrLatest (2025): $4,861 · +2.1% YoY. Source: county tax records.
Cash-flow waterfall
monthlySold comps — $/sqft
last 12 mo · ≤1 miLoading sold comps…