4911 E Bevers St · Sierra Vista Southeast, AZ
Flood risk 1/10 · Minimal
- FEMA flood zone
- X (unshaded)
- Chance of flooding over 30 yrs
- 0.0%
- Est. flood insurance / yr
- $507 – $1,088
Fire risk 7/10 · Major
- Est. fire insurance / yr
- $610 – $1,132
Heat risk 5/10 · Moderate
- Hot days now (above 97°F)
- 7 days/yr
- Hot days in 30 yrs
- 20 days/yr
Wind risk 1/10 · Minimal
- Chance of severe wind over 30 yrs
- —
Air-quality risk 1/10 · Minimal
- Unhealthy air days now
- 0 days/yr
- Unhealthy air days in 30 yrs
- 0 days/yr
Risk factors via First Street. Map © Google.
Why this score? — see what drove the B- grade
The composite is a weighted blend of 9 inputs, each scored 0–100. Each bar is that input's sub-score; the figure is the points it added to the 100-point composite (weight × sub-score).
- Cash flow +28.3/30.0
- ARV discount +13.6/15.0
- DSCR +10.0/10.0
- 1% rule +6.8/10.0
- Livability +3.2/5.0
- Schools +2.9/10.0
- Rent growth +2.5/5.0
- Condition / age +2.5/5.0
- Appreciation +0.0/10.0
$150,000
🖨 Deal sheet (PDF) 📄 Offer letter ✓ Due diligence
Listing remarks MLS
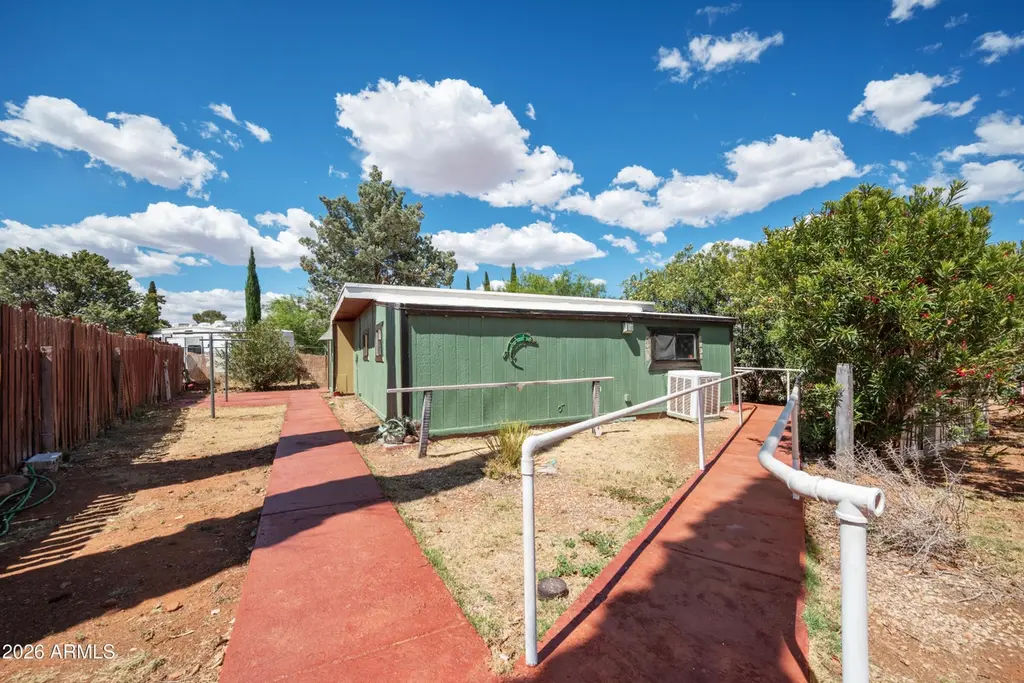
Adorable house located close to town on 0.219 acres with great mountain views, and on a paved road. This 2-bedroom 1-bath could become your new home. It has electricity and access to city water. It needs some TLC but is full of possibilities.
Key facts
- 9,541 sq ft lot
- Built 1987
- Listed 39 days
Property features AI
Finance
- Financial info: Annual tax information available
- HOA & community: No association fees
Exterior
- Utilities: 220V in kitchen (electric); Septic (septic in & connected); City water
- Home design: Single family residence; Fee simple ownership; Property condition: fixer
- Construction: Steel and wood frame construction; Painted exterior; Reflective coating roof; Building area source: assessor
- Exterior features: Chain link fencing; Natural desert front and back; County-maintained road access; Mountain view
Interior
- Kitchen: Refrigerator; Dishwasher; 220V outlet in kitchen
- Bedrooms: Up to 3 possible bedrooms
- Flooring: Tile; Concrete
- Bathrooms: 1 full bathroom
- Heating & cooling: Evaporative cooling; Heating details: see remarks
- Interior features: Eat-in kitchen; Laminate counters
- Laundry & utility: Septic connected (sewer); City water
Neighborhood map
What this means for you Summary
Snapshot
- This is a 2-bed/1.0-bath single-family listed at $150k.
Deal economics
- At list price, monthly cash flow is $479 ($6k/yr) — positive.
- The deal already cash-flows at list — no discount required.
- Meets the 1% rule at list price ($2k rent vs $150k).
- Recommended offer: $146k (3.0% below list) — sets the bar for market timing.
- Cap rate 10.1% vs local median 4.5% in Sierra Vista Southeast — top-decile yield for the area; either an underpriced asset or a hidden risk that comps aren't pricing in. Stress-test before assuming the spread holds.
Location & tenants
- Location reads 63/100 on livability (#113 in AZ) — a middle-class / working-renter tenant base. Strengths: cost of living A+, housing A+, employment B+; Watch: crime C-, amenities F, commute F.
- Sierra Vista Unified District (4175) (urban): math 27% / reading 39% proficiency, ranked #93 of 249 in AZ (top 37%) — families likely to look elsewhere, expect single-tenant / working-renter base with shorter leases.
- Zoned schools: Huachuca Mountain Elementary School (math 38% / reading 52%, grade D-, #334 of 1,109 statewide, top 30%, 416 students, 34% FRL); Joyce Clark Middle School (math 26% / reading 39%, grade F, #70 of 218 statewide, top 32%, 670 students, 46% FRL); Buena High School (math 19% / reading 29%, grade F, #202 of 381 statewide, top 54%, 1,836 students, 32% FRL) — zoned schools at 37% FRL track the district average.
- Market conditions: 103 active listings in the ZIP; 2 comparable units currently listed for rent nearby; solid renter incomes; 437 units permitted in Cochise County in 2024 (6 in 5+ unit buildings).
Forward outlook
- Local home prices are declining (-3.0%/yr); year-one equity from $1k of loan paydown is wiped out by about $4k of value loss. Plan a longer hold.
- Cochise County population projected at -30% by 2050 — secular population decline; favor cash flow + early exit over multi-decade hold.
- At projected returns (-3.0% appreciation + 3.0% rent growth), your $42k cash investment doubles in ~9 years — after that, you're playing with house money.
Negotiation context
- It's been on market 40 days — a 3% lower offer ($146k) is reasonable based on typical stale-listing flexibility.
- 3 sale attempts since 4y ago with the ask held roughly flat each time — persistent listings suggest the price (not the market) is what's stuck; bring a comps-based counter.
- Current owner paid $85k; list at $150k implies a 76% gain — meaningful room to come down on a strong offer.
Risks & watch-outs
- Climate carrying-cost: major wildfire risk; extreme-heat days projected 7→20/yr by 2055 (HVAC capex compounding) — expect insurance premiums to compound above CPI over the hold.
Questions for the listing agent
- It's been on market 40 days. Have you received any prior offers? Is the seller open to a 3% concession, seller financing, or rate buy-down credit?
- Is there a deadline driving the sale (1031 exchange, divorce, estate, relocation)? That informs how much negotiation room exists.
- Schools are D-rated, which usually means shorter tenancies and higher turnover. Who's the typical renter profile here, and what's been the actual vacancy rate?
- What's the average days-on-market for RENTAL listings here right now (not sales)? A rising rental-DOM trend means longer vacancies and softer asking-rent achievability than the comps imply.
- What's the recent tenant-quality profile in this submarket — average credit score on applications, eviction rate, late-payment / NSF rate, and stable-employment percentage? A property-management company in the area should have these aggregated.
- How much new for-sale + rental construction is in the pipeline within 1–3 miles? Heavy new supply typically softens prices + rents 12–24 months out; constrained supply supports both.
Investment metrics
- 1% rule
- 1.18% ✓
- Cap rate
- 10.13%
- Cash-on-cash
- 13.69%
- DSCR
- 1.61
- GRM
- 7.0
CMA / ARV
- ARV (median comp)
- $173,548
- List price
- $150,000
- Delta
- -13.57%
- Verdict
- UNDERPRICED
- Comps
- 7 within 1.0 mi
Projected returns pro-forma
-3.0% appreciation · 3.0% rent growth · sell at horizon
- IRR
- 3.8%
- Equity multiple
- 1.15×
- Total profit
- $6,175
- Equity at exit
- $22,365
- IRR
- 13.3%
- Equity multiple
- 2.06×
- Total profit
- $44,507
- Equity at exit
- $12,969
Cash invested: $42,000 (down + closing). Projections, not guarantees.
Landlord ↔ Tenant lean methodology
- Overall (STATE)
- 87 Strongly Landlord-Friendly
- State Arizona
- 87 Strongly Landlord-Friendly · R+3
- County
- — inherits STATE
- City
- — inherits STATE
ZIP-level market 85650
- Active inventory
- 103
- Price-to-rent
- 7.0×
Monthly cashflow live
- Estimated rent
- $1,774 medium interval (Pro) →
- Mortgage (P&I)
- −$787
- Tax from tax record
- −$73 /mo · $877/yr
- Insurance
- −$62
- HOA
- −$0
- Vacancy / Maint / Mgmt
- −$373
- Net cashflow
- $479
Break-even live
Sensitivity live
| Price | -10% $564 | -5% $522 | +0% $479 | +5% $437 | +10% $394 |
|---|---|---|---|---|---|
| Rent | -10% $339 | -5% $409 | +0% $479 | +5% $549 | +10% $619 |
| Rate | -1.0pp $555 | -0.5pp $517 | base $479 | +0.5pp $440 | +1.0pp $401 |
UW: 25.0% down · 7.5% · 30yr · 1.5% tax · 5.0% vac · 8.0% maint · 8.0% mgmt
Financing live
Cash to close
- Down payment
- $37,500
- Closing costs
- $4,500
- Reserves months
- —
- Total cash needed
- —
Loan-product check · same deal, 3 products live
Conventional
25% down · 7.5% · 30yr
- Down + closing
- —
- Monthly P&I
- —
- Monthly cashflow
- —
- DSCR
- —
- Eligible?
- —
Personal DTI + credit; lowest rate.
DSCR
20% down · 8.5% · 30yr
- Down + closing
- —
- Monthly P&I
- —
- Monthly cashflow
- —
- DSCR
- —
- Eligible?
- —
No personal income docs; deal must DSCR.
Hard money
10% down · 12.0% · 12mo
- Down + closing
- —
- Monthly P&I
- —
- Monthly cashflow
- —
- DSCR
- —
- Eligible?
- —
Short-term bridge; refi at stabilization.
Rent comps 2 comps
| Address | Beds | Baths | Sqft | Rent | $/sqft | DOM | Units | Dist |
|---|---|---|---|---|---|---|---|---|
| 4413 Redwood St Sierra Vista, AZ | 3.0 | 2.0 | 1358 | $1,700 | $1.25 | 45d | 1 | 1.26mi |
| 4488 Resort Dr Sierra Vista, AZ | 3.0 | 2.0 | 1401 | $1,700 | $1.21 | 45d | 1 | 1.30mi |
Listing history 29 events
-
2026-06-22days on market $150,000 Active 40 DOM
-
2026-06-21days on market $150,000 Active 39 DOM
-
2026-06-19days on market $150,000 Active 37 DOM
-
2026-06-18days on market $150,000 Active 36 DOM
-
2026-06-17days on market $150,000 Active 35 DOM
-
2026-06-16days on market $150,000 Active 34 DOM
-
2026-06-15days on market $150,000 Active 33 DOM
-
2026-06-14days on market $150,000 Active 31 DOM
-
2026-06-12days on market $150,000 Active 30 DOM
-
2026-06-09days on market $150,000 Active 27 DOM
-
2026-06-08days on market $150,000 Active 26 DOM
-
2026-06-07days on market $150,000 Active 25 DOM
-
2026-06-05days on market $150,000 Active 22 DOM
-
2026-06-03days on market $150,000 Active 21 DOM
-
2026-06-02days on market $150,000 Active 20 DOM
-
2026-06-01days on market $150,000 Active 19 DOM
-
2026-05-31days on market $150,000 Active 18 DOM
-
2026-05-30days on market $150,000 Active 17 DOM
-
2026-05-13$150,000 Active
-
2026-02-02historical
-
2026-01-04price $150,000
-
2025-10-11price $155,000
-
2025-08-12$159,000 Active
-
2022-06-20soldstatus $85,000 Closed
Show marketing remark (242 chars)
Adorable house located close to town on 0.219 acres with great mountain views, and on a paved road. This 2-bedroom 1-bath could become your new home. It has electricity and access to city water. It needs some TLC but is full of possibilities.
-
2022-06-17soldstatus $85,000
-
2022-06-08status Pending
Show marketing remark (242 chars)
Adorable house located close to town on 0.219 acres with great mountain views, and on a paved road. This 2-bedroom 1-bath could become your new home. It has electricity and access to city water. It needs some TLC but is full of possibilities.
-
2022-05-04$89,000 Active
Show marketing remark (242 chars)
Adorable house located close to town on 0.219 acres with great mountain views, and on a paved road. This 2-bedroom 1-bath could become your new home. It has electricity and access to city water. It needs some TLC but is full of possibilities.
-
2021-03-05soldstatus $67,900
-
2018-07-20soldstatus $133,100
ⓘ Source: listings_history table (triggers on properties + properties_extension) + one-shot
backfill from property_details.listing_events for pre-trigger history.
Tax reassessment forecast AZ · Resets to sale price
- Current annual tax
- $877 · $73/mo
- Projected year-2 tax
- $990 · $82/mo
- Expected delta
- +$113/yr (+$9/mo · 12.9%)
ⓘ Screening estimate from a state-policy table — verify with the county assessor before closing.
Climate risk First Street
- Flood 1/10 Low FEMA zone X (unshaded) · 0% chance over 30 yrs
- Wildfire 7/10 Severe
- Heat 5/10 Major 7 d/yr ≥97°F today · 20 d/yr by 30 yrs out
- Wind 1/10 Low
- Air quality 1/10 Low 0 unhealthy d/yr today · 0 by 30 yrs out
Nearby sold comps map
Loading sold comps map…
Walkable amenities ~0.75 mi
Loading nearby amenities…
Taxation est. · year 1
- Rental income
- $21,288
- − Mortgage interest
- −$8,402
- − Property taxes
- −$877
- − Insurance
- −$750
- − Repairs & maintenance
- −$1,703
- − Management
- −$1,703
- − Depreciation
- −$4,364
- Taxable income
- $3,489
- Est. tax owed @ 24.0%
- −$837
- After-tax cash flow
- $4,914/yr
For passive investors: Depreciation is non-cash, so a rental often shows a tax loss while cash-flowing — sheltering income. Rental losses are passive: they offset passive income freely, and up to $25,000/yr can offset ordinary (W-2) income if you actively participate and your MAGI is under $100k (phasing out to $0 by $150k); unused losses carry forward. On sale, claimed depreciation is recaptured at up to 25%, and gains may owe capital-gains tax (a 1031 exchange can defer both). Figures are a year-1 estimate at your 24.0% rate — not tax advice; consult a CPA.
Schools (NCES district)
- District
- Sierra Vista Unified District (4175)
- NCES district ID
- 0401460
- Math proficiency
- 27% ▼ -19.00%
- Reading proficiency
- 39% ▼ -10.00%
- Median HH income
- $55,463
- Composite
- 29.17/100
- National rank
- #6573
- State rank
- #93 of 249 in AZ
Livability — Sierra Vista Southeast
- Score
- 63/100
- State rank
- #113
- US rank
- #15230
Category grades
Schools grade is shown separately in the Schools card above.
Census & demographics
- Census place
- Sierra Vista Southeast, AZ
- County
- Cochise County · 49,069 people
- City population
- 14,154
- Metro
- Sierra Vista-Douglas, AZ
- Population (ZIP)
- 14,876
- Household income
- $91,654
- Rent vs Own
- Severe rent burden
- 180.0
Population outlook (Cochise County) Hauer SSP2
- Today (2025)
- 113,402 people
- By 2030
- 106,197 · -6.4%
- By 2040
- 92,166 · -18.7%
- By 2050
- 79,805 · -29.6%
- By 2075
- 56,831 · -49.9%
- By 2100
- 35,103 · -69.0%
Race, ethnicity, and origin ACS 2023
- Neighborhood character
- Diverse neighborhood (Simpson 0.56)
- Race & ethnicity
- White 62% Hispanic / Latino 22% Two or more races 19% Black 2% Asian 2% Pacific Islander 2% Native American 1%
- Hispanic origin (detail)
- Mexican 18% Puerto Rican 3%
- Common ancestry
- Italian 3% Slovak 2% Iranian 2%
- Foreign-born
- 6% · Canada, South Korea, China
- Languages at home
- 85% English-only · Spanish 12% German/W. Germanic 1% Korean 1%
Political lean MEDSL · Cochise
- 2024 margin
- Strong R (+23.1) · D 37.8% · R 61.0% · Other 1.2%
- 2008→2024 swing
- -2.5pp toward R · 2008: -20.7pp · 2024: -23.1pp
- All cycles
- 2024: R+23.1 2020: R+19.6 2016: R+22.6 2012: R+24.0 2008: R+20.7
Not yet ingested
- Civics
- —
Market trends
- HPI YoY
- ▼ -101.13%
- Current HPI
- 137.3428
- Rent YoY
- —
- Metro
- Sierra Vista-Douglas, AZ
- State GDP YoY
- ▲ 4.54%
- F500 in state
- 20
Industry mix (Fortune 500 HQ in AZ)
| Industry | F500 HQs | Revenue |
|---|---|---|
| Technology | 2 | $13B |
|
||
| Mining / Metals | 1 | $23B |
|
||
| Environmental Services | 1 | $16B |
|
||
| Metals / Steel | 1 | $14B |
|
||
| Technology Distribution | 1 | $9B |
|
||
| Homebuilding | 1 | $8B |
|
||
Price history
+12.7% since first listed11 events — show timeline
- 2026-05-13 Listed $150,000 ARMLS
- 2026-02-02 Listing Removed — ARMLS
- 2026-01-04 Price Changed $150,000 ARMLS
- 2025-10-11 Price Changed $155,000 ARMLS
- 2025-08-12 Listed $159,000 ARMLS
- 2022-06-20 Sold (MLS) $85,000 ARMLS
- 2022-06-17 Sold (Public Records) $85,000 Public Records
- 2022-06-08 Pending — ARMLS
- 2022-05-04 Listed $89,000 ARMLS
- 2021-03-05 Sold (Public Records) $67,900 Public Records
- 2018-07-20 Sold (Public Records) $133,100 Public Records
Property tax history
+2.0%/yrLatest (2025): $877 · +1.4% YoY. Source: county tax records.
Cash-flow waterfall
monthlySold comps — $/sqft
last 12 mo · ≤1 miLoading sold comps…