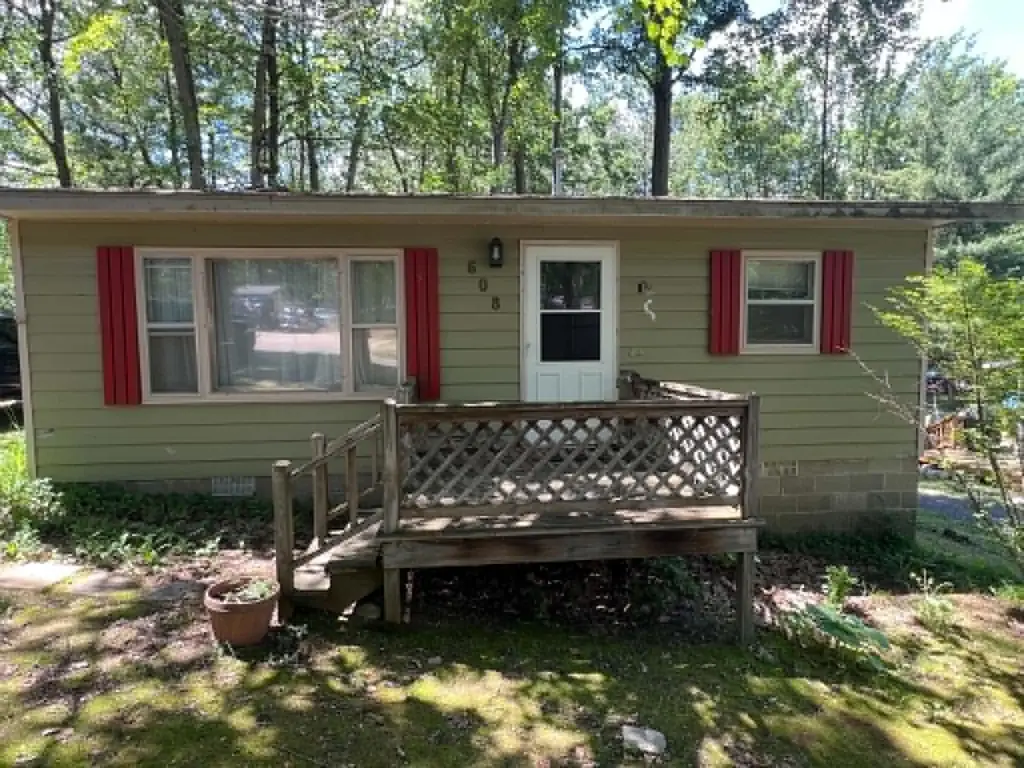
608 jill St · Harrison, MI
Flood risk 1/10 · Minimal
- FEMA flood zone
- X (unshaded)
- Chance of flooding over 30 yrs
- 0.0%
- Est. flood insurance / yr
- $473 – $860
Fire risk 2/10 · Minimal
- Est. fire insurance / yr
- $784 – $1,456
Heat risk 1/10 · Minimal
- Hot days now (above 94°F)
- 7 days/yr
- Hot days in 30 yrs
- 14 days/yr
Wind risk 1/10 · Minimal
- Chance of severe wind over 30 yrs
- —
Air-quality risk 2/10 · Minimal
- Unhealthy air days now
- 1 days/yr
- Unhealthy air days in 30 yrs
- 1 days/yr
Risk factors via First Street. Map © Google.
Why this score? — see what drove the B grade
The composite is a weighted blend of 9 inputs, each scored 0–100. Each bar is that input's sub-score; the figure is the points it added to the 100-point composite (weight × sub-score).
- Cash flow +29.9/30.0
- ARV discount +15.0/15.0
- DSCR +10.0/10.0
- 1% rule +7.7/10.0
- Livability +3.2/5.0
- Rent growth +2.5/5.0
- Condition / age +2.5/5.0
- Schools +1.8/10.0
- Appreciation +0.0/10.0
$64,900
🖨 Deal sheet (PDF) 📄 Offer letter ✓ Due diligence
Listing remarks
Welcome home to this charming 2-bedroom, 1-bath residence offering 660 square feet of comfortable living space in the heart of Northern Michigan. Whether you're searching for a year-round home, weekend getaway, or investment opportunity, this property is ideally located within walking distance of both Little Long Lake and Budd Lake. Enjoy all that Harrison has to offer in the area known for its famous motto, "20 Lakes in 20 Minutes. " Spend your days boating, fishing, swimming, or exploring the endless outdoor recreation opportunities nearby. Conveniently located close to town amenities while maintaining an up-north feel, this home offers the perfect balance of full-time living an
Key facts
- 0.44 acre lot
- Built 1960
- Listed 8 days
Tags
Property features AI
Exterior
- Utilities: Private well water; Public sanitary sewer; Natural gas
- Home design: Residential single-story home; Built in 1960; Crawl foundation
- Construction: Wood exterior construction
- Exterior features: Road frontage
Interior
- Kitchen: First-floor kitchen (approx. 10 x 5) with laminate flooring
- Bedrooms: Two first-floor bedrooms (each 9 x 10) with laminate flooring
- Flooring: Laminate flooring in bedrooms, kitchen, and living room
- Bathrooms: One full bathroom on the first floor (approx. 8 x 5)
- Heating & cooling: Wall heating; Natural gas fuel
- Interior features: Total of 4 rooms; Living room measuring 19 x 15
Neighborhood map
What this means for you Summary
Snapshot
- This is a 2-bed/1.0-bath single-family listed at $65k.
Deal economics
- At list price, monthly cash flow is $241 ($3k/yr) — positive.
- The deal already cash-flows at list — no discount required.
- Meets the 1% rule at list price ($823 rent vs $65k).
- Cap rate 10.7% vs local median 3.5% in Harrison — top-decile yield for the area; either an underpriced asset or a hidden risk that comps aren't pricing in. Stress-test before assuming the spread holds.
Location & tenants
- Location reads 65/100 on livability (#471 in MI) — a middle-class / working-renter tenant base. Strengths: cost of living A+, health & safety A, crime A-; Watch: schools D, amenities F, commute F.
- Harrison Community Schools (town): math 17% / reading 28% proficiency, ranked #457 of 540 in MI (top 85%) — low school quality limits family demand, transient renter base, plan for 1-2y turnover; 65% free/reduced lunch — lower-income household profile, screen leases tightly.
- Market conditions: 246 active listings in the ZIP; 77 units permitted in Clare County in 2024 (0 in 5+ unit buildings).
Forward outlook
- Local home prices are declining (-3.0%/yr); year-one equity from $449 of loan paydown is wiped out by about $2k of value loss. Plan a longer hold.
- Clare County population projected at -20% by 2050 — secular population decline; favor cash flow + early exit over multi-decade hold.
- At projected returns (-3.0% appreciation + 3.0% rent growth), your $18k cash investment doubles in ~8 years — after that, you're playing with house money.
Negotiation context
- Only 8 days on market — expect competitive offers; lowballing is unlikely to land.
- 2 sale attempts since 22y ago with the ask held roughly flat each time — persistent listings suggest the price (not the market) is what's stuck; bring a comps-based counter.
Questions for the listing agent
- Built in 1960 — when were the roof, HVAC, electrical panel, plumbing, and water heater last replaced?
- Is there a deadline driving the sale (1031 exchange, divorce, estate, relocation)? That informs how much negotiation room exists.
- Schools are D-rated, which usually means shorter tenancies and higher turnover. Who's the typical renter profile here, and what's been the actual vacancy rate?
- What's the average days-on-market for RENTAL listings here right now (not sales)? A rising rental-DOM trend means longer vacancies and softer asking-rent achievability than the comps imply.
- What's the recent tenant-quality profile in this submarket — average credit score on applications, eviction rate, late-payment / NSF rate, and stable-employment percentage? A property-management company in the area should have these aggregated.
- How much new for-sale + rental construction is in the pipeline within 1–3 miles? Heavy new supply typically softens prices + rents 12–24 months out; constrained supply supports both.
Investment metrics
- 1% rule
- 1.27% ✓
- Cap rate
- 10.74%
- Cash-on-cash
- 15.89%
- DSCR
- 1.71
- GRM
- 6.6
CMA / ARV
- ARV (on-the-fly)
- $105,600
- Comps found
- 5
Show comp detail 5 sales within ~0.75 mi
| Address | Dist | Beds/Ba | Sqft | Sold | Price | $/sf | Match |
|---|---|---|---|---|---|---|---|
| 880 Little Long Lake Rd | 0.19mi | 2/1.0 | 656 (-1%) | 11mo | $105,000 | $160 | 81 |
| 207 Mary Jo Rd | 0.40mi | 1/1.0 (-1) | 648 (-2%) | 2mo | $47,700 | $74 | 72 |
| 3266 Van Deusen Rd | 0.39mi | 2/1.0 | 704 (+7%) | 11mo | $225,000 | $320 | 61 |
| 243 Matilda | 0.38mi | 2/1.0 | 702 (+6%) | 16mo | $106,000 | $151 | 58 |
| 428 N Lake St | 0.38mi | 2/1.0 | 564 (-14%) | 3mo | $205,000 | $363 | 56 |
Match score weights: distance 35% · size 25% · config 20% · recency 20%. Top-matched comps best support the ARV.
Projected returns pro-forma
-3.0% appreciation · 3.0% rent growth · sell at horizon
- IRR
- 6.8%
- Equity multiple
- 1.26×
- Total profit
- $4,793
- Equity at exit
- $9,677
- IRR
- 16.1%
- Equity multiple
- 2.31×
- Total profit
- $23,855
- Equity at exit
- $5,611
Cash invested: $18,172 (down + closing). Projections, not guarantees.
Landlord ↔ Tenant lean methodology
- Overall (STATE)
- 62 Landlord-Friendly
- State Michigan
- 62 Landlord-Friendly · EVEN
- County
- — inherits STATE
- City
- — inherits STATE
ZIP-level market 48625
- Home prices YoY
- -25.5%
- Active inventory
- 246
- Price-to-rent
- 6.6×
Monthly cashflow live
- Estimated rent
- $823 medium interval (Pro) →
- Mortgage (P&I)
- −$340
- Tax from tax record
- −$42 /mo · $503/yr
- Insurance
- −$27
- HOA
- −$0
- Vacancy / Maint / Mgmt
- −$173
- Net cashflow
- $241
Break-even live
Sensitivity live
| Price | -10% $277 | -5% $259 | +0% $241 | +5% $222 | +10% $204 |
|---|---|---|---|---|---|
| Rent | -10% $176 | -5% $208 | +0% $241 | +5% $273 | +10% $306 |
| Rate | -1.0pp $273 | -0.5pp $257 | base $241 | +0.5pp $224 | +1.0pp $207 |
UW: 25.0% down · 7.5% · 30yr · 1.5% tax · 5.0% vac · 8.0% maint · 8.0% mgmt
Financing live
Cash to close
- Down payment
- $16,225
- Closing costs
- $1,947
- Reserves months
- —
- Total cash needed
- —
Loan-product check · same deal, 3 products live
Conventional
25% down · 7.5% · 30yr
- Down + closing
- —
- Monthly P&I
- —
- Monthly cashflow
- —
- DSCR
- —
- Eligible?
- —
Personal DTI + credit; lowest rate.
DSCR
20% down · 8.5% · 30yr
- Down + closing
- —
- Monthly P&I
- —
- Monthly cashflow
- —
- DSCR
- —
- Eligible?
- —
No personal income docs; deal must DSCR.
Hard money
10% down · 12.0% · 12mo
- Down + closing
- —
- Monthly P&I
- —
- Monthly cashflow
- —
- DSCR
- —
- Eligible?
- —
Short-term bridge; refi at stabilization.
Listing history 8 events
-
2026-06-21days on market $64,900 Active 8 DOM
-
2026-06-21days on market $64,900 Active 7 DOM
-
2026-06-18days on market $64,900 Active 5 DOM
-
2026-06-17days on market $64,900 Active 4 DOM
-
2026-06-16days on market $64,900 Active 3 DOM
-
2026-06-15days on market $64,900 Active 2 DOM
-
2026-06-14remarks 689-char remark
-
2026-06-14$64,900 Active 1 DOM
ⓘ Source: listings_history table (triggers on properties + properties_extension) + one-shot
backfill from property_details.listing_events for pre-trigger history.
Tax reassessment forecast MI · Partial reset (capped growth)
- Current annual tax
- $503 · $42/mo
- Projected year-2 tax
- $751 · $63/mo
- Expected delta
- +$248/yr (+$21/mo · 49.3%)
ⓘ Screening estimate from a state-policy table — verify with the county assessor before closing.
Climate risk First Street
- Flood 1/10 Low FEMA zone X (unshaded) · 0% chance over 30 yrs
- Wildfire 2/10 Low
- Heat 1/10 Low 7 d/yr ≥94°F today · 14 d/yr by 30 yrs out
- Wind 1/10 Low
- Air quality 2/10 Low 1 unhealthy d/yr today · 1 by 30 yrs out
Nearby sold comps map
Loading sold comps map…
Walkable amenities ~0.75 mi
Loading nearby amenities…
Taxation est. · year 1
- Rental income
- $9,872
- − Mortgage interest
- −$3,635
- − Property taxes
- −$503
- − Insurance
- −$324
- − Repairs & maintenance
- −$790
- − Management
- −$790
- − Depreciation
- −$1,888
- Taxable income
- $1,941
- Est. tax owed @ 24.0%
- −$466
- After-tax cash flow
- $2,421/yr
For passive investors: Depreciation is non-cash, so a rental often shows a tax loss while cash-flowing — sheltering income. Rental losses are passive: they offset passive income freely, and up to $25,000/yr can offset ordinary (W-2) income if you actively participate and your MAGI is under $100k (phasing out to $0 by $150k); unused losses carry forward. On sale, claimed depreciation is recaptured at up to 25%, and gains may owe capital-gains tax (a 1031 exchange can defer both). Figures are a year-1 estimate at your 24.0% rate — not tax advice; consult a CPA.
Schools (NCES district)
- District
- Harrison Community Schools
- NCES district ID
- 2617820
- Math proficiency
- 17% ▬ 0.00%
- Reading proficiency
- 28% ▼ -5.00%
- Median HH income
- $30,377
- Composite
- 18.07/100
- National rank
- #8977
- State rank
- #457 of 540 in MI
Livability — Harrison
- Score
- 65/100
- State rank
- #471
- US rank
- #13368
Category grades
Schools grade is shown separately in the Schools card above.
Census & demographics
- Census place
- Harrison, MI
- Population (ZIP)
- 12,939
Population outlook (Clare County) Hauer SSP2
- Today (2025)
- 29,283 people
- By 2030
- 28,199 · -3.7%
- By 2040
- 25,722 · -12.2%
- By 2050
- 23,372 · -20.2%
- By 2075
- 18,569 · -36.6%
- By 2100
- 14,320 · -51.1%
Race, ethnicity, and origin ACS 2023
- Neighborhood character
- Predominantly White (93%)
- Race & ethnicity
- White 93% Two or more races 4% Hispanic / Latino 3%
- Common ancestry
- Romanian 6% Lithuanian 4% Scotch-Irish 2%
- Foreign-born
- 0%
- Languages at home
- 99% English-only · Spanish 1% German/W. Germanic 1%
Political lean MEDSL · Clare
- 2024 margin
- Solid R (+37.6) · D 30.5% · R 68.1% · Other 1.4%
- 2008→2024 swing
- -42.4pp toward R · 2008: 4.8pp · 2024: -37.6pp
- All cycles
- 2024: R+37.6 2020: R+34.8 2016: R+31.8 2012: R+4.8 2008: D+4.8
Not yet ingested
- Civics
- —
Market trends
- HPI YoY
- ▼ -80.38%
- Current HPI
- 234.9586
- Rent YoY
- —
- Metro
- —
- State GDP YoY
- ▲ 1.37%
- F500 in state
- 28
Industry mix (Fortune 500 HQ in MI)
| Industry | F500 HQs | Revenue |
|---|---|---|
| Automotive Parts | 3 | $48B |
|
||
| Automotive | 2 | $372B |
|
||
| Chemicals | 1 | $45B |
|
||
| Automotive Retail | 1 | $29B |
|
||
| Healthcare / Medical Devices | 1 | $23B |
|
||
| Automotive Technology | 1 | $20B |
|
||
Price history
+12.1% since first listed3 events — show timeline
- 2026-06-13 Listed $64,900 MiRealSource-MiMLS
- 2004-10-12 Listing Removed — MiRealSource-MiMLS
- 2004-05-12 Listed $57,900 MiRealSource-MiMLS
Property tax history
-7.1%/yrLatest (2025): $503 · -50.5% YoY. Source: county tax records.
Cash-flow waterfall
monthlySold comps — $/sqft
last 12 mo · ≤1 miLoading sold comps…