15180 Glenfiel Ave · Horizon City, TX
Flood risk No data
- FEMA flood zone
- —
- Chance of flooding over 30 yrs
- —
- Est. flood insurance / yr
- —
Fire risk No data
- Est. fire insurance / yr
- —
Heat risk No data
- Hot days now (above threshold)
- —
- Hot days in 30 yrs
- —
Wind risk No data
- Chance of severe wind over 30 yrs
- —
Air-quality risk No data
- Unhealthy air days now
- —
- Unhealthy air days in 30 yrs
- —
Risk factors via First Street. Map © Google.
Why this score? — see what drove the C grade
The composite is a weighted blend of 9 inputs, each scored 0–100. Each bar is that input's sub-score; the figure is the points it added to the 100-point composite (weight × sub-score).
- Cash flow +24.8/30.0
- DSCR +8.0/10.0
- ARV discount +7.5/15.0
- 1% rule +6.4/10.0
- Livability +3.3/5.0
- Rent growth +3.2/5.0
- Condition / age +2.2/5.0
- Schools +1.5/10.0
- Appreciation +0.0/10.0
$195,000
🖨 Deal sheet (PDF) 📄 Offer letter ✓ Due diligence
Listing remarks
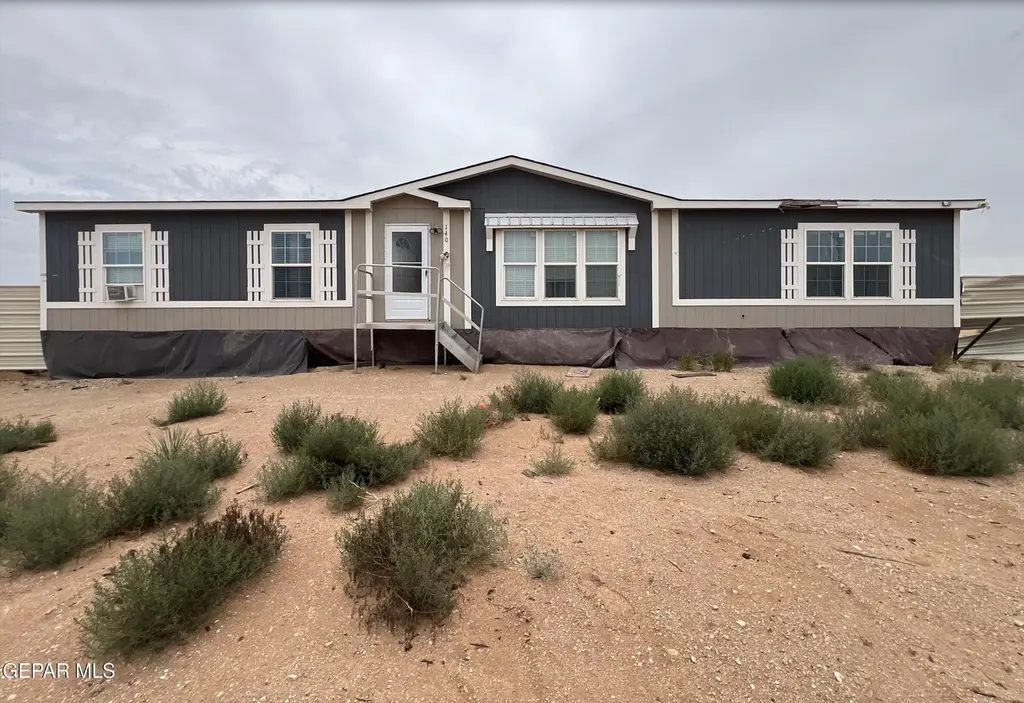
Affordable Opportunity! Spacious double-wide mobile home situated on a generous 0.43-acre lot, offering plenty of space and potential for the right buyer. The home is not on a permanent foundation, making it an excellent option for those seeking an affordable property, investment opportunity, or future land development. Priced to sell and full of possibilities--don't miss this chance to own property on nearly half an acre at an exceptional value.
Key facts
- 0.43 acre lot
- Built 2023
- Listed 15 days
Property features AI
Exterior
- Utilities: Septic tank
- Home design: Manufactured home
- Construction: Wood siding exterior; Shingle, pitched roof; Approximately 2,000 total building area
- Exterior features: See remarks
Interior
- Kitchen: Dishwasher; Microwave; Refrigerator
- Flooring: Laminate flooring; Carpet flooring
- Bathrooms: 2 full bathrooms
- Heating & cooling: Has heating; No central cooling
- Interior features: See remarks; Blinds on windows
Neighborhood map
What this means for you Summary
Snapshot
- This is a 4-bed/2.0-bath manufactured listed at $195k. Condition is rated fair.
Deal economics
- At list price, monthly cash flow is $413 ($5k/yr) — positive.
- The deal already cash-flows at list — no discount required.
- Meets the 1% rule at list price ($2k rent vs $195k).
- Recommended offer: $192k (1.5% below list) — sets the bar for market timing.
Location & tenants
- Location reads 66/100 on livability (#619 in TX) — a middle-class / working-renter tenant base. Strengths: crime A+, cost of living A+, housing A+; Watch: employment D, amenities F, commute F.
- Clint ISD (suburban): math 14% / reading 22% proficiency, ranked #792 of 826 in TX (top 96%) — low school quality limits family demand, transient renter base, plan for 1-2y turnover.
- Zoned schools: Desert Hills El (math 23% / reading 24%, grade F, #3,247 of 4,322 statewide, top 76%, 907 students, 78% FRL); Horizon Middle (math 16% / reading 20%, grade F, #1,491 of 1,662 statewide, top 91%, 670 students, 84% FRL); Horizon H S (math 14% / reading 26%, grade F, #1,397 of 1,632 statewide, top 87%, 1,677 students, 85% FRL) — zoned schools average 82% FRL vs 59% district-wide (23 pts higher); higher-poverty schools than district average — tighter screening recommended.
- Market conditions: Rents rising (+2.9%/yr); 2098 active listings in the ZIP; 2 comparable units currently listed for rent nearby; solid renter incomes; 2,196 units permitted in El Paso County in 2024 (143 in 5+ unit buildings).
- This rent runs 35% of the median local income ($77k/yr) — at the standard rent-burdened threshold; future hikes will face affordability resistance.
Forward outlook
- Local home prices are declining (-3.0%/yr); year-one equity from $1k of loan paydown is wiped out by about $6k of value loss. Plan a longer hold.
- El Paso County population projected at +10% by 2050 — modest demand growth; plan on rents tracking national, not racing it.
Negotiation context
- It's been on market 15 days — a 2% lower offer ($192k) is reasonable based on typical stale-listing flexibility.
Questions for the listing agent
- Have any recent inspections been done? Can we get a copy of the seller's disclosures and any deferred-maintenance estimates?
- Is there a deadline driving the sale (1031 exchange, divorce, estate, relocation)? That informs how much negotiation room exists.
- Schools are D-rated, which usually means shorter tenancies and higher turnover. Who's the typical renter profile here, and what's been the actual vacancy rate?
- What's the average days-on-market for RENTAL listings here right now (not sales)? A rising rental-DOM trend means longer vacancies and softer asking-rent achievability than the comps imply.
- What's the recent tenant-quality profile in this submarket — average credit score on applications, eviction rate, late-payment / NSF rate, and stable-employment percentage? A property-management company in the area should have these aggregated.
- How much new for-sale + rental construction is in the pipeline within 1–3 miles? Heavy new supply typically softens prices + rents 12–24 months out; constrained supply supports both.
Investment metrics
- 1% rule
- 1.14% ✓
- Cap rate
- 8.84%
- Cash-on-cash
- 9.08%
- DSCR
- 1.40
- GRM
- 7.3
CMA / ARV
No comps found within radius.
Projected returns pro-forma
-3.0% appreciation · 2.93% rent growth · sell at horizon
- IRR
- -2.6%
- Equity multiple
- 0.90×
- Total profit
- $-5,399
- Equity at exit
- $29,075
- IRR
- 7.0%
- Equity multiple
- 1.53×
- Total profit
- $28,686
- Equity at exit
- $16,860
Cash invested: $54,600 (down + closing). Projections, not guarantees.
Landlord ↔ Tenant lean methodology
- Overall (STATE)
- 87 Strongly Landlord-Friendly
- State Texas
- 87 Strongly Landlord-Friendly · R+5
- County
- — inherits STATE
- City
- — inherits STATE
ZIP-level market 79928
- Home prices YoY
- -16.9%
- Rents YoY
- 2.9%
- Active inventory
- 2098
- Price-to-rent
- 7.3×
Monthly cashflow live
- Estimated rent
- $2,229 medium interval (Pro) →
- Mortgage (P&I)
- −$1,023
- Tax est. 1.5%
- −$244 /mo · $2,925/yr
- Insurance
- −$81
- HOA
- −$0
- Vacancy / Maint / Mgmt
- −$468
- Net cashflow
- $413
Break-even live
Sensitivity live
| Price | -10% $548 | -5% $481 | +0% $413 | +5% $346 | +10% $279 |
|---|---|---|---|---|---|
| Rent | -10% $237 | -5% $325 | +0% $413 | +5% $501 | +10% $589 |
| Rate | -1.0pp $511 | -0.5pp $463 | base $413 | +0.5pp $363 | +1.0pp $311 |
UW: 25.0% down · 7.5% · 30yr · 1.5% tax · 5.0% vac · 8.0% maint · 8.0% mgmt
Financing live
Cash to close
- Down payment
- $48,750
- Closing costs
- $5,850
- Reserves months
- —
- Total cash needed
- —
Loan-product check · same deal, 3 products live
Conventional
25% down · 7.5% · 30yr
- Down + closing
- —
- Monthly P&I
- —
- Monthly cashflow
- —
- DSCR
- —
- Eligible?
- —
Personal DTI + credit; lowest rate.
DSCR
20% down · 8.5% · 30yr
- Down + closing
- —
- Monthly P&I
- —
- Monthly cashflow
- —
- DSCR
- —
- Eligible?
- —
No personal income docs; deal must DSCR.
Hard money
10% down · 12.0% · 12mo
- Down + closing
- —
- Monthly P&I
- —
- Monthly cashflow
- —
- DSCR
- —
- Eligible?
- —
Short-term bridge; refi at stabilization.
Rent comps 2 comps
| Address | Beds | Baths | Sqft | Rent | $/sqft | DOM | Units | Dist |
|---|---|---|---|---|---|---|---|---|
| 14724 Mountain Breeze Ave El Paso, TX | 4.0 | 2.0 | 1635 | $1,800 | $1.10 | 4d | 1 | 1.29mi |
| 14749 Sand Gate Dr El Paso, TX | 4.0 | 2.0 | 1600 | $1,700 | $1.06 | 4d | 1 | 1.34mi |
Listing history 11 events
-
2026-06-22days on market $195,000 Active 15 DOM
-
2026-06-18days on market $195,000 Active 12 DOM
-
2026-06-17days on market $195,000 Active 11 DOM
-
2026-06-16days on market $195,000 Active 10 DOM
-
2026-06-15days on market $195,000 Active 9 DOM
-
2026-06-13days on market $195,000 Active 7 DOM
-
2026-06-10days on market $195,000 Active 4 DOM
-
2026-06-09days on market $195,000 Active 3 DOM
-
2026-06-08days on market $195,000 Active 2 DOM
-
2026-06-07remarks 450-char remark
-
2026-06-07$195,000 Active 1 DOM
ⓘ Source: listings_history table (triggers on properties + properties_extension) + one-shot
backfill from property_details.listing_events for pre-trigger history.
Nearby sold comps map
Loading sold comps map…
Walkable amenities ~0.75 mi
Loading nearby amenities…
Taxation est. · year 1
- Rental income
- $26,748
- − Mortgage interest
- −$10,923
- − Property taxes
- −$2,925
- − Insurance
- −$975
- − Repairs & maintenance
- −$2,140
- − Management
- −$2,140
- − Depreciation
- −$5,673
- Taxable income
- $1,972
- Est. tax owed @ 24.0%
- −$473
- After-tax cash flow
- $4,486/yr
For passive investors: Depreciation is non-cash, so a rental often shows a tax loss while cash-flowing — sheltering income. Rental losses are passive: they offset passive income freely, and up to $25,000/yr can offset ordinary (W-2) income if you actively participate and your MAGI is under $100k (phasing out to $0 by $150k); unused losses carry forward. On sale, claimed depreciation is recaptured at up to 25%, and gains may owe capital-gains tax (a 1031 exchange can defer both). Figures are a year-1 estimate at your 24.0% rate — not tax advice; consult a CPA.
Condition & rehab AI · 13 photos
A well-maintained mobile home with good kitchen and bathroom features, but could benefit from exterior painting and landscaping to enhance its curb appeal and rental value.
Repairs flagged
- Minor Exterior siding — Weathered appearance suggests minor wear and tear.
- Minor Landscaping — Sparse vegetation indicates potential for landscaping improvements.
Value-add opportunities
- Resale Painting the exterior siding — Fresh paint can significantly improve curb appeal and home value.
- Rental Landscaping — A well-maintained yard can attract more renters and increase rental value.
Renovation cost estimate screening
| Repair item | Severity | Est. cost |
|---|---|---|
| Exterior siding · Weathered appearance suggests minor wear and tear. | Minor | $500–3,000 |
| Landscaping · Sparse vegetation indicates potential for landscaping improvements. | Minor | $500–3,000 |
| Total estimated repair cost · 2 items | $1,000–6,000 |
Value-add ROI direction
- Resale Painting the exterior siding — Fresh paint can significantly improve curb appeal and home value. ↑
- Rental Landscaping — A well-maintained yard can attract more renters and increase rental value. ↑
ⓘ Cost ranges are severity-bucket heuristics (US national rule-of-thumb). Get contractor quotes + a written scope before underwriting a rehab budget.
Schools (NCES district)
- District
- Clint ISD
- NCES district ID
- 4814430
- Math proficiency
- 14% ▼ -32.00%
- Reading proficiency
- 22% ▼ -15.00%
- Median HH income
- $37,490
- Composite
- 15.03/100
- National rank
- #9356
- State rank
- #792 of 826 in TX
Livability — Horizon City
- Score
- 66/100
- State rank
- #619
- US rank
- #11815
Category grades
Schools grade is shown separately in the Schools card above.
Census & demographics
- County
- El Paso County · 761,266 people
- City population
- 86,599
- Metro
- El Paso, TX
- Population (ZIP)
- 86,599
- Household income
- $76,643
- Rent vs Own
- Severe rent burden
- 838.0
Population outlook (El Paso County) Hauer SSP2
- Today (2025)
- 897,899 people
- By 2030
- 922,694 · +2.8%
- By 2040
- 960,492 · +7.0%
- By 2050
- 982,919 · +9.5%
- By 2075
- 997,266 · +11.1%
- By 2100
- 900,630 · +0.3%
Race, ethnicity, and origin ACS 2023
- Neighborhood character
- Predominantly Hispanic (89%)
- Race & ethnicity
- Hispanic / Latino 89% Two or more races 39% White 7% Black 2% Native American 2%
- Hispanic origin (detail)
- Mexican 84%
- Foreign-born
- 23% · Canada
- Languages at home
- 25% English-only · Spanish 74% Other Asian/Pacific 1%
Political lean MEDSL · El Paso
- 2024 margin
- D (+15.1) · D 57.0% · R 41.8% · Other 1.2%
- 2008→2024 swing
- -17.4pp toward R · 2008: 32.5pp · 2024: 15.1pp
- All cycles
- 2024: D+15.1 2020: D+35.1 2016: D+43.2 2012: D+32.6 2008: D+32.5
Not yet ingested
- Civics
- —
Market trends
- HPI YoY
- ▼ -40.72%
- Current HPI
- 200.6454
- Rent YoY
- ▲ 2.93%
- Metro
- El Paso, TX
- State GDP YoY
- ▲ 3.95%
- F500 in state
- 110
Industry mix (Fortune 500 HQ in TX)
| Industry | F500 HQs | Revenue |
|---|---|---|
| Energy | 16 | $1,198B |
|
||
| Technology | 5 | $198B |
|
||
| Engineering / Construction | 4 | $72B |
|
||
| Energy Services | 3 | $60B |
|
||
| Utilities | 3 | $41B |
|
||
| Healthcare | 2 | $330B |
|
||
Price history
1 event — show timeline
- 2026-06-06 Listed $195,000 GEPARMLS
Cash-flow waterfall
monthlySold comps — $/sqft
last 12 mo · ≤1 miLoading sold comps…