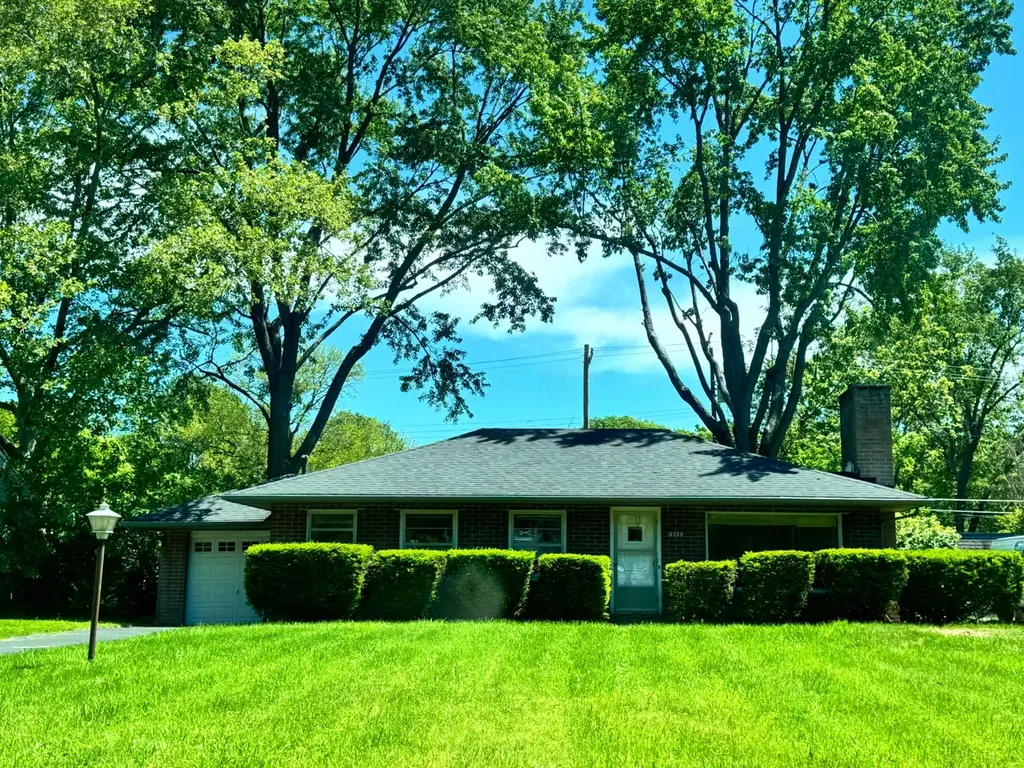
3250 Ainwick Rd · Upper Arlington, OH
Flood risk 1/10 · Minimal
- FEMA flood zone
- X (unshaded)
- Chance of flooding over 30 yrs
- 0.0%
- Est. flood insurance / yr
- $473 – $860
Fire risk 1/10 · Minimal
- Est. fire insurance / yr
- $713 – $1,323
Heat risk 3/10 · Minor
- Hot days now (above 100°F)
- 7 days/yr
- Hot days in 30 yrs
- 18 days/yr
Wind risk 2/10 · Minimal
- Chance of severe wind over 30 yrs
- 1.0%
Air-quality risk 3/10 · Minor
- Unhealthy air days now
- 1 days/yr
- Unhealthy air days in 30 yrs
- 4 days/yr
Risk factors via First Street. Map © Google.
Why this score? — see what drove the C grade
The composite is a weighted blend of 9 inputs, each scored 0–100. Each bar is that input's sub-score; the figure is the points it added to the 100-point composite (weight × sub-score).
- Cash flow +16.0/30.0
- ARV discount +15.0/15.0
- Schools +7.1/10.0
- 1% rule +5.7/10.0
- DSCR +4.9/10.0
- Livability +4.5/5.0
- Rent growth +3.4/5.0
- Condition / age +2.5/5.0
- Appreciation +0.0/10.0
$229,900
🖨 Deal sheet (PDF) 📄 Offer letter ✓ Due diligence
Listing remarks
Attention investors, rehabbers and renovators! Prime opportunity in the highly desirable Upper Arlington City School District. This home is full of potential and ready for your updates and improvements. Excellent location, strong upside, and priced aggressively. Property to be sold strictly AS-IS. Subject to Court and/or Attorney Approval. Please see A2A remarks.
Key facts
- 0.23 acre lot
- Garage
- Built 1952
Property features AI
Finance
- Other: Third-party approval may be required; Standard listing conditions
Exterior
- Parking: Attached garage with 1 garage space
- Utilities: Public water; Public sewer
- Home design: Single family residence; One story; No common walls; Built in 1952
- Construction: Block foundation
- Exterior features: Lot approximately 0.23 acres
Interior
- Bedrooms: 2 main-level bedrooms
- Flooring: Wood flooring
- Bathrooms: 1 full bathroom
- Heating & cooling: Central air conditioning
- Interior features: Full basement; Living area approximately 1002
Neighborhood map
What this means for you Summary
Snapshot
- This is a 2-bed/1.0-bath single-family listed at $230k.
Deal economics
- At list price, monthly cash flow is $113 ($1k/yr) — positive.
- The deal already cash-flows at list — no discount required.
- Meets the 1% rule at list price ($2k rent vs $230k).
- Cap rate 6.9% vs local median 1.6% in Upper Arlington — top-decile yield for the area; either an underpriced asset or a hidden risk that comps aren't pricing in. Stress-test before assuming the spread holds.
Location & tenants
- Location reads 89/100 on livability (#14 in OH, #130 nationally) — a professional / high-income tenant draw. Strengths: crime A+, commute A+, employment A+; Watch: amenities D-, cost of living F.
- Upper Arlington City (suburban): math 77% / reading 81% proficiency, ranked #36 of 656 in OH (top 6%) — strong family-tenant draw, lease renewals of 3-5y typical; only 7% free/reduced lunch — higher-income household profile.
- Zoned schools: Tremont Elementary School (math 74% / reading 78%, grade A, #253 of 1,584 statewide, top 16%, 686 students, 6% FRL); Jones Middle School (math 76% / reading 77%, grade A, #72 of 654 statewide, top 11%, 726 students, 3% FRL); Upper Arlington High School (math 70% / reading 83%, grade A-, #61 of 781 statewide, top 8%, 1,867 students, 4% FRL) — zoned schools at 4% FRL track the district average.
- Market conditions: Rents rising (+3.5%/yr); 61 active listings in the ZIP; 11 comparable units currently listed for rent nearby; rentals at typical pace (median 26d on market — plan ~3-4 weeks tenant-placement turnaround); 45% of comp listings sitting > 30 days — soft ceiling on asking rent; high-income renter base; 8,139 units permitted in Franklin County in 2024 (5,940 in 5+ unit buildings).
Forward outlook
- Local home prices are declining (-3.0%/yr); year-one equity from $2k of loan paydown is wiped out by about $7k of value loss. Plan a longer hold.
- Franklin County population projected at +34% by 2050 — long-run rental-demand tailwind backs the buy-and-hold thesis.
Negotiation context
- Only 5 days on market — expect competitive offers; lowballing is unlikely to land.
Risks & watch-outs
- Watch-outs: property tax is 2.7% of price; built in 1952 — expect roof / HVAC / electrical / plumbing capex.
Questions for the listing agent
- Built in 1952 — when were the roof, HVAC, electrical panel, plumbing, and water heater last replaced?
- Property tax is high relative to price — has the assessment been appealed recently, and will the sale trigger a re-assessment?
- Is there a deadline driving the sale (1031 exchange, divorce, estate, relocation)? That informs how much negotiation room exists.
- Schools are A-rated — typically a magnet for longer-tenancy family renters. What's the average tenant stay here, and is there a school-zone premium baked into asking?
- What's the average days-on-market for RENTAL listings here right now (not sales)? A rising rental-DOM trend means longer vacancies and softer asking-rent achievability than the comps imply.
- What's the recent tenant-quality profile in this submarket — average credit score on applications, eviction rate, late-payment / NSF rate, and stable-employment percentage? A property-management company in the area should have these aggregated.
- How much new for-sale + rental construction is in the pipeline within 1–3 miles? Heavy new supply typically softens prices + rents 12–24 months out; constrained supply supports both.
Investment metrics
- 1% rule
- 1.07% ✓
- Cap rate
- 6.88%
- Cash-on-cash
- 2.10%
- DSCR
- 1.09
- GRM
- 7.8
CMA / ARV
- ARV (median comp)
- $428,515
- List price
- $229,900
- Delta
- -46.35%
- Verdict
- UNDERPRICED
- Comps
- 20 within 1.0 mi
Show comp detail 12 sales within ~0.75 mi
| Address | Dist | Beds/Ba | Sqft | Sold | Price | $/sf | Match |
|---|---|---|---|---|---|---|---|
| 2063 Langham Rd | 0.14mi | 2/1.0 | 1,124 (+12%) | 0mo | $340,000 | $302 | 73 |
| 2047 Langham Rd | 0.16mi | 2/1.5 | 1,117 (+12%) | 6mo | $455,000 | $407 | 66 |
| 2135 Wesleyan Dr | 0.13mi | 3/2.0 (+1) | 1,126 (+12%) | 6mo | $385,000 | $342 | 59 |
| 2213 Bristol Rd | 0.43mi | 3/1.5 (+1) | 1,044 (+4%) | 9mo | $395,000 | $378 | 59 |
| 2443 Shrewsbury Rd | 0.59mi | 2/1.0 | 925 (-8%) | 2mo | $383,500 | $415 | 58 |
| 2513 Woodstock Rd | 0.62mi | 3/1.0 (+1) | 958 (-4%) | 1mo | $372,350 | $389 | 58 |
| 2480 Shrewsbury Rd | 0.65mi | 3/1.5 (+1) | 978 (-2%) | 2mo | $420,000 | $429 | 56 |
| 2534 Shrewsbury Rd | 0.73mi | 3/1.0 (+1) | 1,000 (-0%) | 7mo | $335,000 | $335 | 55 |
| 2272 Fishinger Rd | 0.62mi | 2/1.0 | 1,080 (+8%) | 4mo | $425,000 | $394 | 55 |
| 2269 Cranford Rd | 0.43mi | 3/1.0 (+1) | 1,084 (+8%) | 10mo | $400,000 | $369 | 53 |
| 2606 Swansea Rd | 0.73mi | 3/2.0 (+1) | 1,044 (+4%) | 0mo | $385,000 | $369 | 50 |
| 2459 Edgevale Rd | 0.73mi | 3/1.0 (+1) | 1,114 (+11%) | 2mo | $380,000 | $341 | 41 |
Match score weights: distance 35% · size 25% · config 20% · recency 20%. Top-matched comps best support the ARV.
Projected returns pro-forma
-3.0% appreciation · 3.5% rent growth · sell at horizon
- IRR
- -12.2%
- Equity multiple
- 0.55×
- Total profit
- $-28,651
- Equity at exit
- $34,279
- IRR
- -2.2%
- Equity multiple
- 0.85×
- Total profit
- $-9,826
- Equity at exit
- $19,878
Cash invested: $64,372 (down + closing). Projections, not guarantees.
Landlord ↔ Tenant lean methodology
- Overall (STATE)
- 73 Landlord-Friendly
- State Ohio
- 73 Landlord-Friendly · R+6
- County
- — inherits STATE
- City
- — inherits STATE
ZIP-level market 43221
- Rents YoY
- 3.5%
- Active inventory
- 61
- Price-to-rent
- 7.8×
Monthly cashflow live
- Estimated rent
- $2,452 high interval (Pro) →
- Mortgage (P&I)
- −$1,206
- Tax from tax record
- −$523 /mo · $6,272/yr
- Insurance
- −$96
- HOA
- −$0
- Vacancy / Maint / Mgmt
- −$515
- Net cashflow
- $113
Break-even live
Sensitivity live
| Price | -10% $243 | -5% $178 | +0% $113 | +5% $48 | +10% $-17 |
|---|---|---|---|---|---|
| Rent | -10% $-81 | -5% $16 | +0% $113 | +5% $210 | +10% $306 |
| Rate | -1.0pp $229 | -0.5pp $171 | base $113 | +0.5pp $53 | +1.0pp $-7 |
UW: 25.0% down · 7.5% · 30yr · 1.5% tax · 5.0% vac · 8.0% maint · 8.0% mgmt
Financing live
Cash to close
- Down payment
- $57,475
- Closing costs
- $6,897
- Reserves months
- —
- Total cash needed
- —
Loan-product check · same deal, 3 products live
Conventional
25% down · 7.5% · 30yr
- Down + closing
- —
- Monthly P&I
- —
- Monthly cashflow
- —
- DSCR
- —
- Eligible?
- —
Personal DTI + credit; lowest rate.
DSCR
20% down · 8.5% · 30yr
- Down + closing
- —
- Monthly P&I
- —
- Monthly cashflow
- —
- DSCR
- —
- Eligible?
- —
No personal income docs; deal must DSCR.
Hard money
10% down · 12.0% · 12mo
- Down + closing
- —
- Monthly P&I
- —
- Monthly cashflow
- —
- DSCR
- —
- Eligible?
- —
Short-term bridge; refi at stabilization.
Rent comps 11 comps
| Address | Beds | Baths | Sqft | Rent | $/sqft | DOM | Units | Dist |
|---|---|---|---|---|---|---|---|---|
| 2088 Zollinger Rd Columbus, OH | 3.0 | 1.0 | 1093 | $2,450 | $2.24 | 25d | 1 | 0.19mi |
| 3181 Northwest Blvd Columbus, OH | 1.0–2.0 | 1.0–2.5 | 995 | $3,031 | $3.04 | 0d | 46 | 0.63mi |
| 2635 Woodstock Rd Columbus, OH | 3.0 | 1.0 | 1236 | $2,300 | $1.86 | 45d | 1 | 0.81mi |
| 2636 Nottingham Rd Columbus, OH | 3.0 | 1.5 | 1224 | $2,130 | $1.74 | 45d | 1 | 0.85mi |
| 2799 Brandon Rd Columbus, OH | 3.0 | 2.5 | 1460 | $3,925 | $2.69 | 45d | 1 | 0.89mi |
| 2924 Mount Holyoke Rd Upper Arlington, OH | 3.0 | 2.0 | 1200 | $2,000 | $1.67 | 5d | 1 | 0.97mi |
| 2861 Wellesley Dr Columbus, OH | 3.0 | 2.5 | 1490 | $3,250 | $2.18 | 0d | 1 | 1.03mi |
| 2746 Shrewsbury Rd Columbus, OH | 3.0 | 1.5 | 1451 | $2,900 | $2.00 | 5d | 1 | 1.03mi |
| 1544 Northam Rd Columbus, OH | 3.0 | 2.0 | 1450 | $3,800 | $2.62 | 0d | 1 | 1.18mi |
| 2565 Riverside Dr Unit 2599-3D Columbus, OH | 2.0 | 1.0 | 896 | $1,215 | $1.36 | 45d | 1 | 1.30mi |
| 2565 Riverside Dr Unit 2599-4H Columbus, OH | 2.0 | 1.0 | 896 | $1,330 | $1.48 | 45d | 1 | 1.30mi |
Listing history 2 events
-
2026-05-18status Pending 365-char remark
-
2026-05-13$229,900 Active 365-char remark
ⓘ Source: listings_history table (triggers on properties + properties_extension) + one-shot
backfill from property_details.listing_events for pre-trigger history.
Tax reassessment forecast OH · Partial reset (capped growth)
- Current annual tax
- $6,272 · $523/mo
- Projected year-2 tax
- $6,272 · $523/mo
- Expected delta
- $0/yr ($0/mo · 0.0%)
ⓘ Screening estimate from a state-policy table — verify with the county assessor before closing.
Climate risk First Street
- Flood 1/10 Low FEMA zone X (unshaded) · 0% chance over 30 yrs
- Wildfire 1/10 Low
- Heat 3/10 Moderate 7 d/yr ≥100°F today · 18 d/yr by 30 yrs out
- Wind 2/10 Low 100% chance of damaging wind over 30 yrs
- Air quality 3/10 Moderate 1 unhealthy d/yr today · 4 by 30 yrs out
Nearby sold comps map
Loading sold comps map…
Walkable amenities ~0.75 mi
Loading nearby amenities…
Taxation est. · year 1
- Rental income
- $29,420
- − Mortgage interest
- −$12,878
- − Property taxes
- −$6,272
- − Insurance
- −$1,150
- − Repairs & maintenance
- −$2,354
- − Management
- −$2,354
- − Depreciation
- −$6,688
- Taxable loss
- −$2,275
- Est. tax savings @ 24.0%
- +$546
- After-tax cash flow
- $1,899/yr
For passive investors: Depreciation is non-cash, so a rental often shows a tax loss while cash-flowing — sheltering income. Rental losses are passive: they offset passive income freely, and up to $25,000/yr can offset ordinary (W-2) income if you actively participate and your MAGI is under $100k (phasing out to $0 by $150k); unused losses carry forward. On sale, claimed depreciation is recaptured at up to 25%, and gains may owe capital-gains tax (a 1031 exchange can defer both). Figures are a year-1 estimate at your 24.0% rate — not tax advice; consult a CPA.
Schools (NCES district)
- District
- Upper Arlington City
- NCES district ID
- 3904493
- Math proficiency
- 77% ▼ -9.00%
- Reading proficiency
- 81% ▼ -5.00%
- Median HH income
- $98,411
- Composite
- 71.45/100
- National rank
- #225
- State rank
- #36 of 656 in OH
Livability — Upper Arlington
- Score
- 89/100
- State rank
- #14
- US rank
- #130
Category grades
Schools grade is shown separately in the Schools card above.
Census & demographics
- Census place
- Upper Arlington, OH
- County
- Franklin County · 1,351,780 people
- City population
- 64,085
- Metro
- Columbus, OH
- Population (ZIP)
- 35,293
- Household income
- $118,768
- Rent vs Own
- Severe rent burden
- 450.0
Population outlook (Franklin County) Hauer SSP2
- Today (2025)
- 1,456,139 people
- By 2030
- 1,556,890 · +6.9%
- By 2040
- 1,757,349 · +20.7%
- By 2050
- 1,950,539 · +34.0%
- By 2075
- 2,376,171 · +63.2%
- By 2100
- 2,636,796 · +81.1%
Race, ethnicity, and origin ACS 2023
- Neighborhood character
- Predominantly White (83%)
- Race & ethnicity
- White 83% Asian 6% Two or more races 6% Hispanic / Latino 3% Black 3%
- Common ancestry
- Slovak 4% Italian 3% Romanian 3%
- Foreign-born
- 8% · China, Canada
- Languages at home
- 92% English-only · Other Indo-European 2% Chinese 2% Spanish 1%
Political lean MEDSL · Franklin
- 2024 margin
- Strong D (+28.4) · D 63.7% · R 35.3% · Other 1.0%
- 2008→2024 swing
- +7.7pp toward D · 2008: 20.7pp · 2024: 28.4pp
- All cycles
- 2024: D+28.4 2020: D+31.4 2016: D+25.9 2012: D+21.7 2008: D+20.7
Not yet ingested
- Civics
- —
Market trends
- HPI YoY
- ▼ -445.67%
- Current HPI
- 271.8826
- Rent YoY
- ▲ 3.50%
- Metro
- Columbus, OH
- State GDP YoY
- ▲ 1.98%
- F500 in state
- 48
Industry mix (Fortune 500 HQ in OH)
| Industry | F500 HQs | Revenue |
|---|---|---|
| Insurance | 3 | $145B |
|
||
| Industrial Machinery | 3 | $49B |
|
||
| Financial Services | 3 | $24B |
|
||
| Consumer Goods | 2 | $93B |
|
||
| Aerospace / Defense | 2 | $47B |
|
||
| Utilities | 2 | $33B |
|
||
Price history
2 events — show timeline
- 2026-05-18 Pending — CBRMLS
- 2026-05-13 Listed $229,900 CBRMLS
Property tax history
+5.5%/yrLatest (2024): $6,272 · +4.2% YoY. Source: county tax records.
Cash-flow waterfall
monthlySold comps — $/sqft
last 12 mo · ≤1 miLoading sold comps…