2318 Plume Dr · Tyler, TX
Flood risk 1/10 · Minimal
- FEMA flood zone
- X (unshaded)
- Chance of flooding over 30 yrs
- 0.0%
- Est. flood insurance / yr
- $507 – $1,088
Fire risk 1/10 · Minimal
- Est. fire insurance / yr
- $1,222 – $2,270
Heat risk 7/10 · Major
- Hot days now (above 109°F)
- 7 days/yr
- Hot days in 30 yrs
- 27 days/yr
Wind risk 6/10 · Moderate
- Chance of severe wind over 30 yrs
- 60.0%
Air-quality risk 2/10 · Minimal
- Unhealthy air days now
- 0 days/yr
- Unhealthy air days in 30 yrs
- 1 days/yr
Risk factors via First Street. Map © Google.
Why this score? — see what drove the B- grade
The composite is a weighted blend of 9 inputs, each scored 0–100. Each bar is that input's sub-score; the figure is the points it added to the 100-point composite (weight × sub-score).
- Cash flow +24.8/30.0
- ARV discount +15.0/15.0
- DSCR +8.0/10.0
- 1% rule +6.7/10.0
- Livability +3.8/5.0
- Schools +3.3/10.0
- Condition / age +2.5/5.0
- Rent growth +2.0/5.0
- Appreciation +0.0/10.0
$125,000
🖨 Deal sheet 📄 Offer letter ✓ Due diligence
Listing remarks MLS
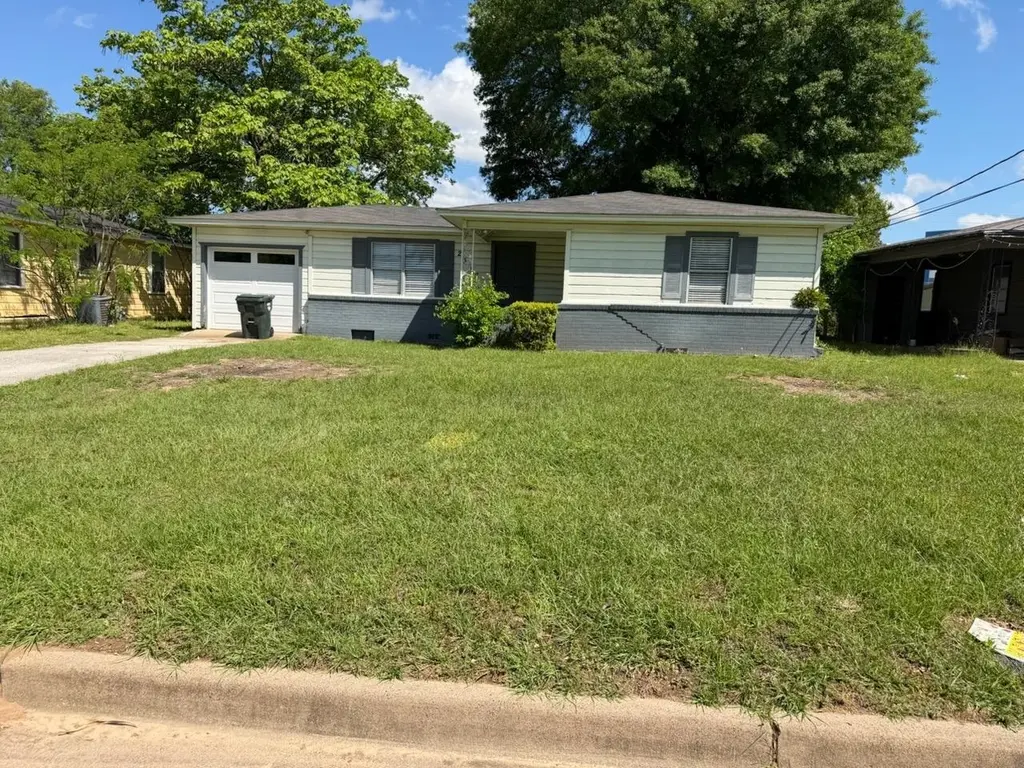
Charming and efficient, this 2-bedroom, 1-bath home in Tyler, TX offers 1,072 square feet of comfortable living space on a manageable 0.165-acre lot. Perfect for first-time buyers, downsizers, or investors, this property combines functionality with a cozy feel. Inside, you’ll find a welcoming layout with a spacious living area that flows easily into the kitchen and dining space, creating an ideal setup for everyday living or entertaining. The bedrooms are well-sized with ample natural light, while the bathroom is conveniently located for accessibility. Outside, the lot provides just enough space for outdoor enjoyment without overwhelming maintenance—ideal for relaxing evenings, pets, or a small garden. Located in a convenient area of Tyler, you’ll enjoy proximity to local shopping, dining, and schools while still having a quiet place to call home. Whether you’re looking to settle in or add to your portfolio, this property offers great potential and value in a growing East Texas market.
Key facts
- 7,187 sq ft lot
- Garage
- Built 1958
Neighborhood map
What this means for you Summary
Snapshot
- This is a 2-bed/1.0-bath single-family listed at $125k.
Deal economics
- At list price, monthly cash flow is $263 ($3k/yr) — positive.
- The deal already cash-flows at list — no discount required.
- Meets the 1% rule at list price ($1k rent vs $125k).
- Recommended offer: $118k (6.0% below list) — sets the bar for market timing.
- Cap rate 8.8% vs local median 3.6% in Tyler — top-decile yield for the area; either an underpriced asset or a hidden risk that comps aren't pricing in. Stress-test before assuming the spread holds.
Location & tenants
- Location reads 75/100 on livability (#147 in TX, #4,181 nationally) — a middle-class / working-renter tenant base. Strengths: cost of living A+, housing A+, health & safety A+; Watch: employment C-, schools D+, crime D+.
- Tyler ISD (urban): math 39% / reading 38% proficiency, ranked #449 of 826 in TX (top 54%) — families likely to look elsewhere, expect single-tenant / working-renter base with shorter leases; 66% free/reduced lunch — lower-income household profile, screen leases tightly.
- Market conditions: Rents soft (-1.9%/yr); 649 active listings in the ZIP; 21 comparable units currently listed for rent nearby; rentals leasing fast (median 13d on market — plan ~1-2 weeks tenant-placement turnaround); solid renter incomes; 595 units permitted in Smith County in 2024 (45 in 5+ unit buildings).
Forward outlook
- Local home prices are declining (-3.0%/yr); year-one equity from $864 of loan paydown is wiped out by about $4k of value loss. Plan a longer hold.
- Smith County population projected at +24% by 2050 — long-run rental-demand tailwind backs the buy-and-hold thesis.
Negotiation context
- It's been on market 77 days — a 6% lower offer ($118k) is reasonable based on typical stale-listing flexibility.
- 4 sale attempts; this cycle's ask has dropped $10k (7%) from the opening price — seller is motivated, your offer sets the floor, not the list.
Risks & watch-outs
- Watch-outs: built in 1958 — expect roof / HVAC / electrical / plumbing capex.
- Climate carrying-cost: major wind risk, 60% chance of damaging wind over 30y; extreme-heat days projected 7→27/yr by 2055 (HVAC capex compounding) — expect insurance premiums to compound above CPI over the hold.
Questions for the listing agent
- It's been on market 77 days. Have you received any prior offers? Is the seller open to a 6% concession, seller financing, or rate buy-down credit?
- Built in 1958 — when were the roof, HVAC, electrical panel, plumbing, and water heater last replaced?
- Why hasn't it sold? Are there any deal-killer items the seller is aware of (foundation, flood, title, zoning, code violations)?
- Is there a deadline driving the sale (1031 exchange, divorce, estate, relocation)? That informs how much negotiation room exists.
- Schools are D-rated, which usually means shorter tenancies and higher turnover. Who's the typical renter profile here, and what's been the actual vacancy rate?
- Crime grade is D in this area — have there been break-ins, vandalism, or insurance claims at this property in the last 3 years? What carrier currently insures it and at what premium?
- What's the average days-on-market for RENTAL listings here right now (not sales)? A rising rental-DOM trend means longer vacancies and softer asking-rent achievability than the comps imply.
- What's the recent tenant-quality profile in this submarket — average credit score on applications, eviction rate, late-payment / NSF rate, and stable-employment percentage? A property-management company in the area should have these aggregated.
- How much new for-sale + rental construction is in the pipeline within 1–3 miles? Heavy new supply typically softens prices + rents 12–24 months out; constrained supply supports both.
Investment metrics
- 1% rule
- 1.17% ✓
- Cap rate
- 8.82%
- Cash-on-cash
- 9.02%
- DSCR
- 1.40
- GRM
- 7.1
CMA / ARV
- ARV (median comp)
- $201,127
- List price
- $125,000
- Delta
- -37.85%
- Verdict
- UNDERPRICED
- Comps
- 4 within 1.0 mi
Projected returns pro-forma
-3.0% appreciation · 0.0% rent growth · sell at horizon
- IRR
- -6.2%
- Equity multiple
- 0.78×
- Total profit
- $-7,736
- Equity at exit
- $18,638
- IRR
- -0.7%
- Equity multiple
- 0.96×
- Total profit
- $-1,527
- Equity at exit
- $10,808
Cash invested: $35,000 (down + closing). Projections, not guarantees.
Landlord ↔ Tenant lean methodology
- Overall (STATE)
- 87 Strongly Landlord-Friendly
- State Texas
- 87 Strongly Landlord-Friendly · R+5
- County
- — inherits STATE
- City
- — inherits STATE
ZIP-level market 75703
- Rents YoY
- -1.9%
- Active inventory
- 649
- Price-to-rent
- 7.1×
Monthly cashflow live
- Estimated rent
- $1,459 high interval (Pro) →
- Mortgage (P&I)
- −$656
- Tax from tax record
- −$182 /mo · $2,179/yr
- Insurance
- −$52
- HOA
- −$0
- Vacancy / Maint / Mgmt
- −$306
- Net cashflow
- $263
Break-even live
UW: 25.0% down · 7.5% · 30yr · 1.5% tax · 5.0% vac · 8.0% maint · 8.0% mgmt
Financing live
Cash to close
- Down payment
- $31,250
- Closing costs
- $3,750
- Reserves months
- —
- Total cash needed
- —
Loan-product check · same deal, 3 products live
Conventional
25% down · 7.5% · 30yr
- Down + closing
- —
- Monthly P&I
- —
- Monthly cashflow
- —
- DSCR
- —
- Eligible?
- —
Personal DTI + credit; lowest rate.
DSCR
20% down · 8.5% · 30yr
- Down + closing
- —
- Monthly P&I
- —
- Monthly cashflow
- —
- DSCR
- —
- Eligible?
- —
No personal income docs; deal must DSCR.
Hard money
10% down · 12.0% · 12mo
- Down + closing
- —
- Monthly P&I
- —
- Monthly cashflow
- —
- DSCR
- —
- Eligible?
- —
Short-term bridge; refi at stabilization.
Rent comps 21 comps
| Address | Beds | Baths | Sqft | Rent | $/sqft | DOM | Units | Dist |
|---|---|---|---|---|---|---|---|---|
| 3038 Santa Elena Dr Tyler, TX | 3.0 | 2.0 | 1305 | $2,485 | $1.90 | 13d | 1 | 0.35mi |
| 3032 Santa Elena Dr Tyler, TX | 3.0 | 2.0 | 1473 | $2,485 | $1.69 | 43d | 1 | 0.37mi |
| 3304 Golden Rd Unit 1222 Tyler, TX | 2.0 | 2.0 | 811 | $1,274 | $1.57 | 43d | 1 | 0.38mi |
| 3304 Golden Rd Unit 1422 Tyler, TX | 2.0 | 2.0 | 811 | $1,274 | $1.57 | 20d | 1 | 0.38mi |
| 2725 Amy Ln Tyler, TX | 2.0 | 1.5 | 1146 | $1,520 | $1.33 | 13d | 1 | 0.42mi |
| 3113 Greg Ln Tyler, TX | 3.0 | 1.5 | 1157 | $1,300 | $1.12 | 13d | 1 | 0.46mi |
| 4400 Troup Hwy Tyler, TX | 1.0–2.0 | 1.0–2.0 | 744 | $1,224 | $1.64 | 13d | 10 | 0.50mi |
| 4418 Edinburgh Dr Tyler, TX | 3.0 | 2.0 | 1407 | $1,750 | $1.24 | 43d | 1 | 0.50mi |
| 4309 Aberdeen Dr Tyler, TX | 3.0 | 2.0 | 1219 | $1,475 | $1.21 | 43d | 1 | 0.51mi |
| 1909 Sybil Ln Tyler, TX | 1.0–3.0 | 1.0–2.0 | 1067 | $1,273 | $1.19 | 13d | 9 | 0.56mi |
| 4518 Edinburgh Dr Unit 4520 Edinburgh Tyler, TX | 3.0 | 2.0 | 1436 | $1,425 | $0.99 | 20d | 1 | 0.57mi |
| 4520 Edinburgh Dr Tyler, TX | 3.0 | 2.0 | 1436 | $1,425 | $0.99 | 20d | 1 | 0.57mi |
| 4400 Paluxy Dr Tyler, TX | 1.0–3.0 | 1.0–2.0 | 905 | $1,044 | $1.15 | 13d | 60 | 0.66mi |
| 4600 Paluxy Dr Tyler, TX | 2.0 | 1.0–2.0 | 585 | $1,006 | $1.72 | 13d | 15 | 0.76mi |
| 4920 Thistle Dr Tyler, TX | 3.0 | 1.0–2.0 | 775 | $1,207 | $1.56 | 13d | 8 | 1.01mi |
| 2525 Shiloh Rd Tyler, TX | 3.0–4.0 | 2.0 | 1360 | $1,379 | $1.01 | 13d | 1 | 1.21mi |
| 1717 Shiloh Rd Tyler, TX | 1.0–3.0 | 1.0–2.0 | 1000 | $1,190 | $1.19 | 13d | 10 | 1.23mi |
| 5058 Paluxy Dr Tyler, TX | 1.0–3.0 | 1.0–2.0 | 965 | $1,427 | $1.48 | 13d | 11 | 1.28mi |
| 2319 Hunter St Tyler, TX | 3.0 | 1.0 | 1200 | $1,225 | $1.02 | 43d | 1 | 1.37mi |
| 826 Wilma St Tyler, TX | 3.0 | 2.0 | 1210 | $1,800 | $1.49 | 13d | 1 | 1.40mi |
| 3629 McDonald Rd Tyler, TX | 2.0 | 2.0 | 1287 | $1,325 | $1.03 | 20d | 1 | 1.48mi |
Listing history 25 events
-
2026-06-19days on market $125,000 Active 77 DOM
-
2026-06-18days on market $125,000 Active 76 DOM
-
2026-06-17days on market $125,000 Active 75 DOM
-
2026-06-16days on market $125,000 Active 74 DOM
-
2026-06-15days on market $125,000 Active 73 DOM
-
2026-06-14days on market $125,000 Active 71 DOM
-
2026-06-13days on market $125,000 Active 70 DOM
-
2026-06-10days on market $125,000 Active 68 DOM
-
2026-06-09days on market $125,000 Active 67 DOM
-
2026-06-08days on market $125,000 Active 66 DOM
-
2026-06-07days on market $125,000 Active 65 DOM
-
2026-06-05days on market $125,000 Active 62 DOM
-
2026-06-02days on market $125,000 Active 60 DOM
-
2026-06-01days on market $125,000 Active 59 DOM
-
2026-05-31days on market $125,000 Active 58 DOM
-
2026-05-30days on market $125,000 Active 57 DOM
-
2026-05-15price $125,000 1024-char remark
Show marketing remark (1024 chars)
Charming and efficient, this 2-bedroom, 1-bath home in Tyler, TX offers 1,072 square feet of comfortable living space on a manageable 0.165-acre lot. Perfect for first-time buyers, downsizers, or investors, this property combines functionality with a cozy feel. Inside, you’ll find a welcoming layout with a spacious living area that flows easily into the kitchen and dining space, creating an ideal setup for everyday living or entertaining. The bedrooms are well-sized with ample natural light, while the bathroom is conveniently located for accessibility. Outside, the lot provides just enough space for outdoor enjoyment without overwhelming maintenance—ideal for relaxing evenings, pets, or a small garden. Located in a convenient area of Tyler, you’ll enjoy proximity to local shopping, dining, and schools while still having a quiet place to call home. Whether you’re looking to settle in or add to your portfolio, this property offers great potential and value in a growing East Texas market.
-
2026-05-06price $124,500
-
2026-05-06status Active
-
2026-04-30status Pending
-
2026-04-03$135,000 Active 1024-char remark
Show marketing remark (1024 chars)
Charming and efficient, this 2-bedroom, 1-bath home in Tyler, TX offers 1,072 square feet of comfortable living space on a manageable 0.165-acre lot. Perfect for first-time buyers, downsizers, or investors, this property combines functionality with a cozy feel. Inside, you’ll find a welcoming layout with a spacious living area that flows easily into the kitchen and dining space, creating an ideal setup for everyday living or entertaining. The bedrooms are well-sized with ample natural light, while the bathroom is conveniently located for accessibility. Outside, the lot provides just enough space for outdoor enjoyment without overwhelming maintenance—ideal for relaxing evenings, pets, or a small garden. Located in a convenient area of Tyler, you’ll enjoy proximity to local shopping, dining, and schools while still having a quiet place to call home. Whether you’re looking to settle in or add to your portfolio, this property offers great potential and value in a growing East Texas market.
-
2026-04-02status Active
-
2026-03-30historical
-
2026-03-27$135,000
-
2003-11-17soldstatus
ⓘ Source: listings_history table (triggers on properties + properties_extension) + one-shot
backfill from property_details.listing_events for pre-trigger history.
Tax reassessment forecast TX · Resets to sale price
- Current annual tax
- $2,179 · $182/mo
- Projected year-2 tax
- $2,288 · $191/mo
- Expected delta
- +$109/yr (+$9/mo · 5.0%)
ⓘ Screening estimate from a state-policy table — verify with the county assessor before closing.
Climate risk First Street
- Flood 1/10 Low FEMA zone X (unshaded) · 0% chance over 30 yrs
- Wildfire 1/10 Low
- Heat 7/10 Severe 7 d/yr ≥109°F today · 27 d/yr by 30 yrs out
- Wind 6/10 Major 60% chance of damaging wind over 30 yrs
- Air quality 2/10 Low 0 unhealthy d/yr today · 1 by 30 yrs out
Nearby sold comps map
Loading sold comps map…
Walkable amenities ~0.75 mi
Loading nearby amenities…
Taxation est. · year 1
- Rental income
- $17,502
- − Mortgage interest
- −$7,002
- − Property taxes
- −$2,179
- − Insurance
- −$625
- − Repairs & maintenance
- −$1,400
- − Management
- −$1,400
- − Depreciation
- −$3,636
- Taxable income
- $1,260
- Est. tax owed @ 24.0%
- −$302
- After-tax cash flow
- $2,855/yr
For passive investors: Depreciation is non-cash, so a rental often shows a tax loss while cash-flowing — sheltering income. Rental losses are passive: they offset passive income freely, and up to $25,000/yr can offset ordinary (W-2) income if you actively participate and your MAGI is under $100k (phasing out to $0 by $150k); unused losses carry forward. On sale, claimed depreciation is recaptured at up to 25%, and gains may owe capital-gains tax (a 1031 exchange can defer both). Figures are a year-1 estimate at your 24.0% rate — not tax advice; consult a CPA.
Schools (NCES district)
- District
- Tyler ISD
- NCES district ID
- 4843470
- Math proficiency
- 39% ▼ -4.00%
- Reading proficiency
- 38% ▼ -1.00%
- Median HH income
- $44,090
- Composite
- 32.69/100
- National rank
- #5650
- State rank
- #449 of 826 in TX
Livability — Tyler
- Score
- 75/100
- State rank
- #147
- US rank
- #4181
Category grades
Schools grade is shown separately in the Schools card above.
Census & demographics
- Census place
- Tyler, TX
- County
- Smith County · 180,570 people
- City population
- 127,842
- Metro
- Tyler, TX
- Population (ZIP)
- 46,039
- Household income
- $79,194
- Rent vs Own
- Severe rent burden
- 1585.0
Population outlook (Smith County) Hauer SSP2
- Today (2025)
- 248,890 people
- By 2030
- 261,665 · +5.1%
- By 2040
- 286,114 · +15.0%
- By 2050
- 308,006 · +23.8%
- By 2075
- 354,171 · +42.3%
- By 2100
- 372,828 · +49.8%
Race, ethnicity, and origin ACS 2023
- Neighborhood character
- Predominantly White (66%)
- Race & ethnicity
- White 66% Black 17% Hispanic / Latino 10% Two or more races 7% Asian 4%
- Hispanic origin (detail)
- Mexican 8%
- Common ancestry
- Slovak 3% Italian 2% Lithuanian 2%
- Foreign-born
- 7% · Canada, China, Vietnam
- Languages at home
- 89% English-only · Spanish 6% Other Indo-European 1% Tagalog/Filipino 1%
Political lean MEDSL · Smith
- 2024 margin
- Solid R (+45.1) · D 27.0% · R 72.1%
- 2008→2024 swing
- -5.6pp toward R · 2008: -39.5pp · 2024: -45.1pp
- All cycles
- 2024: R+45.1 2020: R+39.4 2016: R+43.9 2012: R+46.9 2008: R+39.5
Not yet ingested
- Civics
- —
Market trends
- HPI YoY
- ▼ -218.79%
- Current HPI
- 182.3842
- Rent YoY
- ▼ -1.95%
- Metro
- Tyler, TX
- State GDP YoY
- ▲ 3.95%
- F500 in state
- 110
Industry mix (Fortune 500 HQ in TX)
| Industry | F500 HQs | Revenue |
|---|---|---|
| Energy | 16 | $1,198B |
|
||
| Technology | 5 | $198B |
|
||
| Engineering / Construction | 4 | $72B |
|
||
| Energy Services | 3 | $60B |
|
||
| Utilities | 3 | $41B |
|
||
| Healthcare | 2 | $330B |
|
||
Price history
-7.4% since first listed9 events — show timeline
- 2026-05-15 Price Changed $125,000 LAAR
- 2026-05-06 Price Changed $124,500 GTAR
- 2026-05-06 Relisted — GTAR
- 2026-04-30 Pending — GTAR
- 2026-04-03 Listed $135,000 LAAR
- 2026-04-02 Relisted — GTAR
- 2026-03-30 Delisted — GTAR
- 2026-03-27 Listed $135,000 GTAR
- 2003-11-17 Sold (Public Records) — Public Records
Property tax history
+6.4%/yrLatest (2024): $2,179 · +17.1% YoY. Source: county tax records.
Cash-flow waterfall
monthlySold comps — $/sqft
last 12 mo · ≤1 miLoading sold comps…