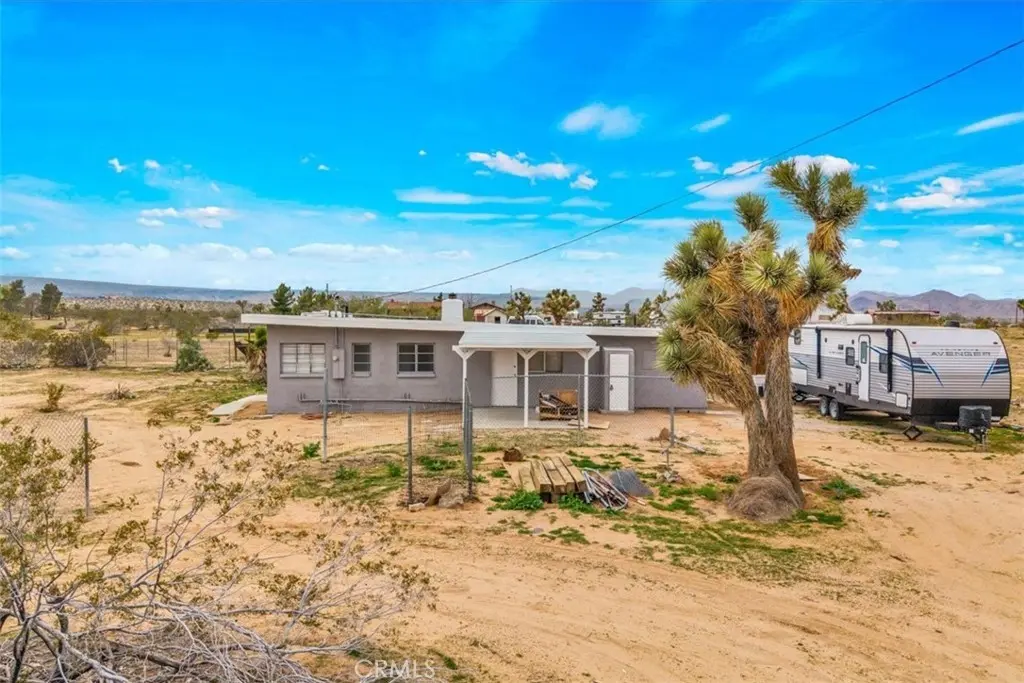
57726 Starlight Mesa Rd · Homestead Valley, CA
Flood risk 1/10 · Minimal
- FEMA flood zone
- D
- Chance of flooding over 30 yrs
- 0.0%
- Est. flood insurance / yr
- $544 – $1,084
Fire risk 4/10 · Minor
- Est. fire insurance / yr
- $659 – $1,223
Heat risk 7/10 · Major
- Hot days now (above 98°F)
- 7 days/yr
- Hot days in 30 yrs
- 22 days/yr
Wind risk 1/10 · Minimal
- Chance of severe wind over 30 yrs
- —
Air-quality risk 6/10 · Moderate
- Unhealthy air days now
- 9 days/yr
- Unhealthy air days in 30 yrs
- 12 days/yr
Risk factors via First Street. Map © Google.
Why this score? — see what drove the F grade
The composite is a weighted blend of 9 inputs, each scored 0–100. Each bar is that input's sub-score; the figure is the points it added to the 100-point composite (weight × sub-score).
- ARV discount +14.8/15.0
- Cash flow +7.0/30.0
- Rent growth +3.5/5.0
- Livability +2.5/5.0
- Condition / age +2.5/5.0
- Schools +2.2/10.0
- DSCR +1.2/10.0
- 1% rule +1.1/10.0
- Appreciation +0.0/10.0
$255,000
🖨 Deal sheet (PDF) 📄 Offer letter ✓ Due diligence
Listing remarks MLS
Back on the market at no fault to the seller!! Cash offers only! If you're looking for a diamond in the rough or a fun project, look no further. Prime vacation rental area with great views! Amazing 2 acre property located in the peaceful Mojave desert minutes away from the Joshua Tree, Pioneertown and much more. This house consists of 1 bedroom and 1 bathroom plus some unpermitted alterations to add extra square footage. Sold in AS IS condition. Buyer is responsible for verifying the accuracy of all information disclosed in this listing, plus confirm square footage, permits, lot boundaries and others with the County of San Bernardino.
Key facts
- Large windows
- Quartz countertops
- Wood-beamed ceilings
Tags
Property features AI
Finance
- Other: Single-unit property; No ADU; No common walls
- HOA & community: Rural community with nearby hiking, BLM/National Forest access, preserve/public land and park
Exterior
- Utilities: Electricity connected (standard); Water connected (district/public); Septic tank sewer
- Home design: Single-story house; Front entry
- Construction: Year built per public records
- Exterior features: House; No pool; Secluded setting; Park nearby; Lot over 40,000 sqft
Interior
- Kitchen: Refrigerator; Electric range
- Bedrooms: 1 bedroom on the main level
- Bathrooms: 2 full bathrooms
- Heating & cooling: Central furnace heating; Central and evaporative cooling
- Interior features: One-level home with front entry; Living room with fireplace; Main level includes 1 bedroom and 1 bathroom; Has views
- Laundry & utility: Laundry available (see remarks for details)
Neighborhood map
What this means for you Summary
Snapshot
- This is a 1-bed/1.0-bath single-family listed at $255k.
Deal economics
- At list price, monthly cash flow is $-377 ($-5k/yr) — negative.
- To cash-flow at today's rent, offer at most $188k (26.2% below list).
- To meet the 1% rule (rent ≥ 1% of price), the offer needs to be $155k (39.3% below list).
- Recommended offer: $155k (39.3% below list) — sets the bar for 1% rule.
- Cap rate 4.5% vs local median 3.7% in Homestead Valley — meaningfully above typical; check what's discounted (condition, days-on-market, listing class) to confirm the premium yield is real.
Location & tenants
- Location reads 49/100 on livability (#1,167 in CA) — a working-class tenant base; expect higher turnover. Strengths: housing A+; Watch: amenities F, commute F, employment F.
- Morongo Unified (town): math 15% / reading 38% proficiency, ranked #395 of 517 in CA (top 76%) — low school quality limits family demand, transient renter base, plan for 1-2y turnover.
- Zoned schools: Yucca Mesa Elementary (math 24% / reading 24%, grade F, #973 of 1,571 statewide, top 73%, 402 students, 70% FRL); La Contenta Middle (math 11% / reading 27%, grade F, #426 of 498 statewide, top 86%, 650 students, 72% FRL); Yucca Valley High (math 15% / reading 49%, grade F, #674 of 1,170 statewide, top 59%, 1,264 students, 64% FRL).
- Market conditions: Rents rising fast (+4.1%/yr); 573 active listings in the ZIP; 5,458 units permitted in San Bernardino County in 2024 (1,500 in 5+ unit buildings).
- This rent runs 32% of the median local income ($58k/yr) — at the standard rent-burdened threshold; future hikes will face affordability resistance.
Forward outlook
- Local home prices are declining (-3.0%/yr); year-one equity from $2k of loan paydown is wiped out by about $8k of value loss. Plan a longer hold.
- San Bernardino County population projected at +15% by 2050 — modest demand growth; plan on rents tracking national, not racing it.
Negotiation context
- Only 9 days on market — expect competitive offers; lowballing is unlikely to land.
- 6 sale attempts since 12y ago with the ask held roughly flat each time — persistent listings suggest the price (not the market) is what's stuck; bring a comps-based counter.
- Current owner paid $136k; list at $255k implies a 88% gain — meaningful room to come down on a strong offer.
Risks & watch-outs
- Watch-outs: built in 1958 — expect roof / HVAC / electrical / plumbing capex.
- Climate carrying-cost: extreme-heat days projected 7→22/yr by 2055 (HVAC capex compounding) — expect insurance premiums to compound above CPI over the hold.
Questions for the listing agent
- What do current leases actually rent for vs. the listed asking? Can we see a recent rent roll and the last 12 months of T-12 income?
- Built in 1958 — when were the roof, HVAC, electrical panel, plumbing, and water heater last replaced?
- Is there a deadline driving the sale (1031 exchange, divorce, estate, relocation)? That informs how much negotiation room exists.
- Schools are F-rated, which usually means shorter tenancies and higher turnover. Who's the typical renter profile here, and what's been the actual vacancy rate?
- The area grade is low — what's the realistic commute time and amenity access for the typical tenant pool here? Any planned neighborhood developments (good or bad) we should know about?
- What's the average days-on-market for RENTAL listings here right now (not sales)? A rising rental-DOM trend means longer vacancies and softer asking-rent achievability than the comps imply.
- What's the recent tenant-quality profile in this submarket — average credit score on applications, eviction rate, late-payment / NSF rate, and stable-employment percentage? A property-management company in the area should have these aggregated.
- How much new for-sale + rental construction is in the pipeline within 1–3 miles? Heavy new supply typically softens prices + rents 12–24 months out; constrained supply supports both.
Investment metrics
- 1% rule
- 0.61% ✗
- Cap rate
- 4.52%
- Cash-on-cash
- -6.34%
- DSCR
- 0.72
- GRM
- 13.7
CMA / ARV
- ARV (on-the-fly)
- $304,512
- Comps found
- 3
Show comp detail 3 sales within ~0.75 mi
| Address | Dist | Beds/Ba | Sqft | Sold | Price | $/sf | Match |
|---|---|---|---|---|---|---|---|
| 57726 Starlight Mesa Rd | 0.00mi | 1/1.0 | 832 (0%) | 20mo | $136,000 | $163 | 83 |
| 1624-B Balsa Ave | 0.56mi | 2/1.0 (+1) | 804 (-3%) | 6mo | $371,000 | $461 | 58 |
| 1698 Hilton Ave | 0.51mi | 2/1.0 (+1) | 901 (+8%) | 7mo | $330,000 | $366 | 52 |
Match score weights: distance 35% · size 25% · config 20% · recency 20%. Top-matched comps best support the ARV.
Projected returns pro-forma
-3.0% appreciation · 4.12% rent growth · sell at horizon
- IRR
- -26.2%
- Equity multiple
- 0.11×
- Total profit
- $-63,676
- Equity at exit
- $38,021
- IRR
- -20.3%
- Equity multiple
- -0.11×
- Total profit
- $-79,311
- Equity at exit
- $22,048
Cash invested: $71,400 (down + closing). Projections, not guarantees.
Landlord ↔ Tenant lean methodology
- Overall (STATE)
- 18 Strongly Tenant-Friendly
- State California
- 18 Strongly Tenant-Friendly · D+13
- County
- — inherits STATE
- City
- — inherits STATE
ZIP-level market 92284
- Home prices YoY
- -33.1%
- Rents YoY
- 4.1%
- Active inventory
- 573
- Price-to-rent
- 13.7×
Monthly cashflow live
- Estimated rent
- $1,548 medium interval (Pro) →
- Mortgage (P&I)
- −$1,337
- Tax from tax record
- −$157 /mo · $1,881/yr
- Insurance
- −$106
- HOA
- −$0
- Vacancy / Maint / Mgmt
- −$325
- Net cashflow
- $-377
Break-even live
Sensitivity live
| Price | -10% $-233 | -5% $-305 | +0% $-377 | +5% $-450 | +10% $-522 |
|---|---|---|---|---|---|
| Rent | -10% $-500 | -5% $-439 | +0% $-377 | +5% $-316 | +10% $-255 |
| Rate | -1.0pp $-249 | -0.5pp $-313 | base $-377 | +0.5pp $-444 | +1.0pp $-511 |
UW: 25.0% down · 7.5% · 30yr · 1.5% tax · 5.0% vac · 8.0% maint · 8.0% mgmt
Financing live
Cash to close
- Down payment
- $63,750
- Closing costs
- $7,650
- Reserves months
- —
- Total cash needed
- —
Loan-product check · same deal, 3 products live
Conventional
25% down · 7.5% · 30yr
- Down + closing
- —
- Monthly P&I
- —
- Monthly cashflow
- —
- DSCR
- —
- Eligible?
- —
Personal DTI + credit; lowest rate.
DSCR
20% down · 8.5% · 30yr
- Down + closing
- —
- Monthly P&I
- —
- Monthly cashflow
- —
- DSCR
- —
- Eligible?
- —
No personal income docs; deal must DSCR.
Hard money
10% down · 12.0% · 12mo
- Down + closing
- —
- Monthly P&I
- —
- Monthly cashflow
- —
- DSCR
- —
- Eligible?
- —
Short-term bridge; refi at stabilization.
Listing history 7 events
-
2026-06-21days on market $255,000 Active 9 DOM
-
2026-06-18days on market $255,000 Active 6 DOM
-
2026-06-17days on market $255,000 Active 5 DOM
-
2026-06-16days on market $255,000 Active 4 DOM
-
2026-06-15days on market $255,000 Active 3 DOM
-
2026-06-13remarks 699-char remark
-
2026-06-13$255,000 Active 1 DOM
ⓘ Source: listings_history table (triggers on properties + properties_extension) + one-shot
backfill from property_details.listing_events for pre-trigger history.
Tax reassessment forecast CA · Resets to sale price
- Current annual tax
- $1,881 · $157/mo
- Projected year-2 tax
- $1,938 · $162/mo
- Expected delta
- +$57/yr (+$5/mo · 3.0%)
ⓘ Screening estimate from a state-policy table — verify with the county assessor before closing.
Climate risk First Street
- Flood 1/10 Low FEMA zone D · 0% chance over 30 yrs
- Wildfire 4/10 Moderate
- Heat 7/10 Severe 7 d/yr ≥98°F today · 22 d/yr by 30 yrs out
- Wind 1/10 Low
- Air quality 6/10 Major 9 unhealthy d/yr today · 12 by 30 yrs out
Nearby sold comps map
Loading sold comps map…
Walkable amenities ~0.75 mi
Loading nearby amenities…
Taxation est. · year 1
- Rental income
- $18,573
- − Mortgage interest
- −$14,284
- − Property taxes
- −$1,881
- − Insurance
- −$1,275
- − Repairs & maintenance
- −$1,486
- − Management
- −$1,486
- − Depreciation
- −$7,418
- Taxable loss
- −$9,256
- Est. tax savings @ 24.0%
- +$2,222
- After-tax cash flow
- $-2,308/yr
For passive investors: Depreciation is non-cash, so a rental often shows a tax loss while cash-flowing — sheltering income. Rental losses are passive: they offset passive income freely, and up to $25,000/yr can offset ordinary (W-2) income if you actively participate and your MAGI is under $100k (phasing out to $0 by $150k); unused losses carry forward. On sale, claimed depreciation is recaptured at up to 25%, and gains may owe capital-gains tax (a 1031 exchange can defer both). Figures are a year-1 estimate at your 24.0% rate — not tax advice; consult a CPA.
Schools (NCES district)
- District
- Morongo Unified
- NCES district ID
- 0625860
- Math proficiency
- 15% ▼ -12.00%
- Reading proficiency
- 38% ▼ -3.00%
- Median HH income
- $39,399
- Composite
- 22.19/100
- National rank
- #8156
- State rank
- #395 of 517 in CA
Livability — Homestead Valley
- Score
- 49/100
- State rank
- #1167
- US rank
- #25885
Category grades
Schools grade is shown separately in the Schools card above.
Census & demographics
- Census place
- Homestead Valley, CA
- County
- San Bernardino County · 2,030,291 people
- Metro
- Riverside-San Bernardino-Ontario, CA
- Population (ZIP)
- 25,415
- Household income
- $58,373
- Rent vs Own
- Severe rent burden
- 1132.0
Population outlook (San Bernardino County) Hauer SSP2
- Today (2025)
- 2,300,329 people
- By 2030
- 2,378,907 · +3.4%
- By 2040
- 2,523,137 · +9.7%
- By 2050
- 2,642,388 · +14.9%
- By 2075
- 2,880,769 · +25.2%
- By 2100
- 2,909,436 · +26.5%
Race, ethnicity, and origin ACS 2023
- Neighborhood character
- Diverse neighborhood (Simpson 0.55)
- Race & ethnicity
- White 62% Hispanic / Latino 25% Two or more races 18% Black 2% Native American 2% Asian 2% Pacific Islander 1%
- Hispanic origin (detail)
- Mexican 20%
- Common ancestry
- Italian 4% Romanian 2% Slovak 2%
- Foreign-born
- 9% · Canada
- Languages at home
- 82% English-only · Spanish 14% Other Indo-European 1% Other Asian/Pacific 1%
Political lean MEDSL · San Bernardino
- 2024 margin
- Toss-up / Even · D 47.5% · R 49.7% · Other 2.8%
- 2008→2024 swing
- -8.5pp toward R · 2008: 6.3pp · 2024: -2.1pp
- All cycles
- 2024: R+2.1 2020: D+10.7 2016: D+9.8 2012: D+5.4 2008: D+6.3
Not yet ingested
- Civics
- —
Market trends
- HPI YoY
- ▼ -241.13%
- Current HPI
- 486.7185
- Rent YoY
- ▲ 4.12%
- Metro
- Riverside-San Bernardino-Ontario, CA
- State GDP YoY
- ▲ 3.21%
- F500 in state
- 116
Industry mix (Fortune 500 HQ in CA)
| Industry | F500 HQs | Revenue |
|---|---|---|
| Technology | 27 | $1,492B |
|
||
| Financial Services | 3 | $174B |
|
||
| Retail | 3 | $44B |
|
||
| Insurance | 3 | $26B |
|
||
| Media / Entertainment | 2 | $115B |
|
||
| Pharmaceuticals / Biotech | 2 | $62B |
|
||
Price history
-89.9% since first listed18 events — show timeline
- 2026-06-12 Rental Removed $2,000 CRMLS
- 2026-06-12 Listed $255,000 CRMLS
- 2026-04-04 Listed for Rent $2,000 CRMLS
- 2026-04-03 Listing Removed — CRMLS
- 2026-03-01 Price Changed $285,000 CRMLS
- 2025-12-29 Listed $299,000 CRMLS
- 2024-10-09 Pending — CRMLS
- 2024-10-09 Sold (Public Records) $136,000 Public Records
- 2024-10-09 Sold (MLS) $136,000 CRMLS
- 2024-08-22 Contingent — CRMLS
- 2024-08-10 Relisted — CRMLS
- 2024-07-16 Contingent — CRMLS
- 2024-07-05 Listed $129,000 CRMLS
- 2024-07-03 Coming Soon $129,000 CRMLS
- 2014-04-14 Pending — GPSMLS
- 2014-04-14 Sold (MLS) $23,000 GPSMLS
- 2014-03-31 Pending — GPSMLS
- 2014-03-13 Listed $19,900 GPSMLS
Property tax history
+8.0%/yrLatest (2025): $1,881 · -22.0% YoY. Source: county tax records.
Cash-flow waterfall
monthlySold comps — $/sqft
last 12 mo · ≤1 miLoading sold comps…