 Triplex
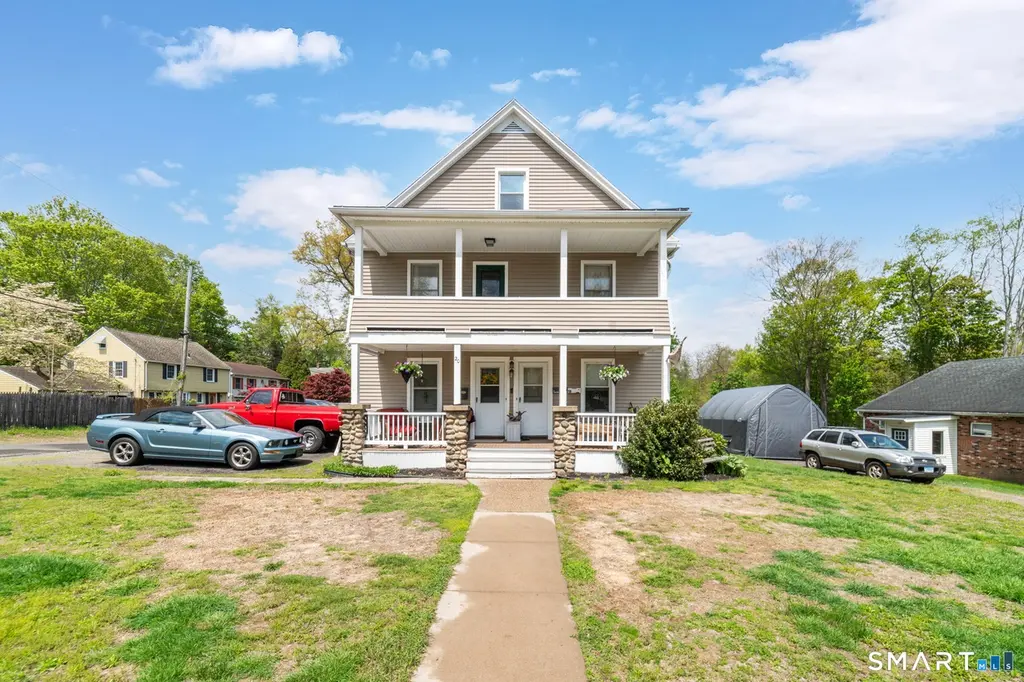
18 Maple St · Terryville, CT
Flood risk 1/10 · Minimal
- FEMA flood zone
- —
- Chance of flooding over 30 yrs
- 0.0%
- Est. flood insurance / yr
- —
Fire risk 1/10 · Minimal
- Est. fire insurance / yr
- $829 – $1,539
Heat risk 4/10 · Minor
- Hot days now (above 94°F)
- 7 days/yr
- Hot days in 30 yrs
- 16 days/yr
Wind risk 6/10 · Moderate
- Chance of severe wind over 30 yrs
- 27.0%
Air-quality risk 2/10 · Minimal
- Unhealthy air days now
- 1 days/yr
- Unhealthy air days in 30 yrs
- 1 days/yr
Risk factors via First Street. Map © Google.
Why this score? — see what drove the C+ grade
The composite is a weighted blend of 9 inputs, each scored 0–100. Each bar is that input's sub-score; the figure is the points it added to the 100-point composite (weight × sub-score).
- Cash flow +26.2/30.0
- DSCR +8.9/10.0
- 1% rule +7.0/10.0
- ARV discount +6.7/15.0
- Schools +4.5/10.0
- Livability +3.6/5.0
- Rent growth +2.5/5.0
- Condition / age +2.5/5.0
- Appreciation +0.0/10.0
$395,000
🖨 Deal sheet 📄 Offer letter ✓ Due diligence
Multi-family units
County records classify this as Multi-Family (2-4 Unit). Listing-text estimate: 3 units. confirmed
Listing remarks
Excellent investment or owner-occupant opportunity in the heart of Terryville! This spacious 3-family property offers approximately 2,926 square feet of living space on a generous . 40-acre lot with plenty of parking. The first and second floor units each offer 2 bedrooms, while the third-floor unit features 1 bedroom, creating flexible living arrangements and strong rental income potential. The first and second floors are heated with oil, and the third floor utilizes gas heat. Each unit has separate utilities and separate meters, making management convenient for investors and owners alike. Full of classic New England charm, this property location provides easy access to downtown amenities,
Key facts
- Separate utilities
- 3-family property
- 0.4 acre lot
Tags
Property features AI
Exterior
- Utilities: Public water connected; Public sewer connected; Fuel tank located in basement
- Home design: Multi-family 3-family property
- Construction: Stone construction; Concrete foundation; Asphalt shingle roof
- Exterior features: Level lot; Vinyl siding
Interior
- Bedrooms: 5 bedrooms
- Bathrooms: 3 full bathrooms
- Heating & cooling: Baseboard heating; Steam heating; Hot water from natural gas; Oil heating (additional fuel option)
- Interior features: Full basement
- Laundry & utility: Basement laundry hook-ups
Neighborhood map
What this means for you Summary
Snapshot
- This is a 2×2bd/1.0ba + 1×1bd/1.0ba units multifamily listed at $395k.
Deal economics
- At list price, monthly cash flow is $1k ($12k/yr) — positive. Per door: $338/mo.
- The deal already cash-flows at list — no discount required.
- Meets the 1% rule at list price ($5k rent vs $395k).
Location & tenants
- Location reads 72/100 on livability (#84 in CT) — a middle-class / working-renter tenant base. Strengths: housing A+, health & safety A+, crime A; Watch: amenities F, commute F.
- Plymouth School District (suburban): math 42% / reading 58% proficiency, ranked #78 of 153 in CT (top 51%) — acceptable for families but not a draw, mixed tenant base, ~2y average lease.
- Zoned schools: Terryville High School (math 44% / reading 64%, grade C-, #63 of 194 statewide, top 39%, 367 students, 43% FRL) — zoned schools average 43% FRL vs 22% district-wide (20 pts higher); higher-poverty schools than district average — tighter screening recommended.
- Market conditions: 55 active listings in the ZIP; 502 units permitted in Naugatuck Valley Planning Region in 2024 (171 in 5+ unit buildings).
Forward outlook
- Local home prices are declining (-3.0%/yr); year-one equity from $3k of loan paydown is wiped out by about $12k of value loss. Plan a longer hold.
- At projected returns (-3.0% appreciation + 3.0% rent growth), your $111k cash investment doubles in ~10 years — after that, you're playing with house money.
Negotiation context
- Only 9 days on market — expect competitive offers; lowballing is unlikely to land.
- Current owner paid $95k; list at $395k implies a 316% gain — meaningful room to come down on a strong offer.
Risks & watch-outs
- Watch-outs: built in 1900 — expect roof / HVAC / electrical / plumbing capex.
- Climate carrying-cost: major wind risk, 27% chance of damaging wind over 30y — expect insurance premiums to compound above CPI over the hold.
Questions for the listing agent
- Can we see the unit-by-unit rent roll, current vacancy, and any below-market leases? What's the average tenancy length?
- What capital expenditures (roof, boiler, parking lot, exteriors) have been made in the last 5 years, and what's planned in the next 2?
- Built in 1900 — when were the roof, HVAC, electrical panel, plumbing, and water heater last replaced?
- Is there a deadline driving the sale (1031 exchange, divorce, estate, relocation)? That informs how much negotiation room exists.
- What's the average days-on-market for RENTAL listings here right now (not sales)? A rising rental-DOM trend means longer vacancies and softer asking-rent achievability than the comps imply.
- What's the recent tenant-quality profile in this submarket — average credit score on applications, eviction rate, late-payment / NSF rate, and stable-employment percentage? A property-management company in the area should have these aggregated.
- How much new apartment / multifamily construction is in the pipeline within 1–3 miles? Heavy new supply (>2% of stock underway) typically softens rents 12–24 months out; light construction supports rent growth.
Investment metrics
- 1% rule
- 1.20% ✓
- Cap rate
- 9.37%
- Cash-on-cash
- 11.00%
- DSCR
- 1.49
- GRM
- 7.0
CMA / ARV
- ARV (median comp)
- $387,831
- List price
- $395,000
- Delta
- 1.85%
- Verdict
- FAIR
- Comps
- 20 within 1.0 mi
Show comp detail 1 sale within ~0.75 mi
| Address | Dist | Beds/Ba | Sqft | Sold | Price | $/sf | Match |
|---|---|---|---|---|---|---|---|
| 218 Main St | 0.28mi | 4/4.0 (-1) | 2,690 (-8%) | 3mo | $360,000 | $134 | 62 |
Match score weights: distance 35% · size 25% · config 20% · recency 20%. Top-matched comps best support the ARV.
Projected returns pro-forma
-3.0% appreciation · 3.0% rent growth · sell at horizon
- IRR
- 0.1%
- Equity multiple
- 1.01×
- Total profit
- $621
- Equity at exit
- $58,896
- IRR
- 9.8%
- Equity multiple
- 1.76×
- Total profit
- $83,937
- Equity at exit
- $34,152
Cash invested: $110,600 (down + closing). Projections, not guarantees.
Landlord ↔ Tenant lean methodology
- Overall (STATE)
- 27 Tenant-Leaning
- State Connecticut
- 27 Tenant-Leaning · D+7
- County
- — inherits STATE
- City
- — inherits STATE
ZIP-level market 06786
- Home prices YoY
- -23.7%
- Active inventory
- 55
- Price-to-rent
- 20.0×
Monthly cashflow live
- Estimated rent
- $4,724 high interval (Pro) →
- Mortgage (P&I)
- −$2,071
- Tax from tax record
- −$482 /mo · $5,787/yr
- Insurance
- −$165
- HOA
- −$0
- Vacancy / Maint / Mgmt
- −$992
- Net cashflow
- $1,014
Break-even live
3-unit breakdown (identical units grouped — click to expand)
| Units | Beds | Baths | Est. rent |
|---|---|---|---|
| 2× units | 2 | 1 | $3,298 |
| #1 | 2 | 1 | $1,649 |
| #2 | 2 | 1 | $1,649 |
| 1× unit | 1 | 1 | $1,426 |
| Total (3 units) | $4,724 | ||
UW: 25.0% down · 7.5% · 30yr · 1.5% tax · 5.0% vac · 8.0% maint · 8.0% mgmt
Financing live
Cash to close
- Down payment
- $98,750
- Closing costs
- $11,850
- Reserves months
- —
- Total cash needed
- —
Loan-product check · same deal, 3 products live
Conventional
25% down · 7.5% · 30yr
- Down + closing
- —
- Monthly P&I
- —
- Monthly cashflow
- —
- DSCR
- —
- Eligible?
- —
Personal DTI + credit; lowest rate.
DSCR
20% down · 8.5% · 30yr
- Down + closing
- —
- Monthly P&I
- —
- Monthly cashflow
- —
- DSCR
- —
- Eligible?
- —
No personal income docs; deal must DSCR.
Hard money
10% down · 12.0% · 12mo
- Down + closing
- —
- Monthly P&I
- —
- Monthly cashflow
- —
- DSCR
- —
- Eligible?
- —
Short-term bridge; refi at stabilization.
Listing history 2 events
-
2026-05-11$395,000 Active 908-char remark
-
2000-02-22soldstatus $95,000
ⓘ Source: listings_history table (triggers on properties + properties_extension) + one-shot
backfill from property_details.listing_events for pre-trigger history.
Tax reassessment forecast CT · Partial reset (capped growth)
- Current annual tax
- $5,787 · $482/mo
- Projected year-2 tax
- $7,120 · $593/mo
- Expected delta
- +$1,333/yr (+$111/mo · 23.0%)
ⓘ Screening estimate from a state-policy table — verify with the county assessor before closing.
Climate risk First Street
- Flood 1/10 Low 0% chance over 30 yrs
- Wildfire 1/10 Low
- Heat 4/10 Moderate 7 d/yr ≥94°F today · 16 d/yr by 30 yrs out
- Wind 6/10 Major 27% chance of damaging wind over 30 yrs
- Air quality 2/10 Low 1 unhealthy d/yr today · 1 by 30 yrs out
Nearby sold comps map
Loading sold comps map…
Walkable amenities ~0.75 mi
Loading nearby amenities…
Taxation est. · year 1
- Rental income
- $56,688
- − Mortgage interest
- −$22,126
- − Property taxes
- −$5,787
- − Insurance
- −$1,975
- − Repairs & maintenance
- −$4,535
- − Management
- −$4,535
- − Depreciation
- −$11,491
- Taxable income
- $6,239
- Est. tax owed @ 24.0%
- −$1,497
- After-tax cash flow
- $10,667/yr
For passive investors: Depreciation is non-cash, so a rental often shows a tax loss while cash-flowing — sheltering income. Rental losses are passive: they offset passive income freely, and up to $25,000/yr can offset ordinary (W-2) income if you actively participate and your MAGI is under $100k (phasing out to $0 by $150k); unused losses carry forward. On sale, claimed depreciation is recaptured at up to 25%, and gains may owe capital-gains tax (a 1031 exchange can defer both). Figures are a year-1 estimate at your 24.0% rate — not tax advice; consult a CPA.
Schools (NCES district)
- District
- Plymouth School District
- NCES district ID
- 0903330
- Math proficiency
- 42% ▼ -10.00%
- Reading proficiency
- 58% ▼ -2.00%
- Median HH income
- $71,517
- Composite
- 44.78/100
- National rank
- #2743
- State rank
- #78 of 153 in CT
Livability — Terryville
- Score
- 72/100
- State rank
- #84
- US rank
- #6301
Category grades
Schools grade is shown separately in the Schools card above.
Census & demographics
- Census place
- Terryville, CT
- City population
- 9,617
- Population (ZIP)
- 9,617
Population outlook (Naugatuck Valley County) Hauer SSP2
- By 2040
- 496,846
Race, ethnicity, and origin ACS 2023
- Neighborhood character
- Predominantly White (86%)
- Race & ethnicity
- White 86% Hispanic / Latino 8% Two or more races 7%
- Hispanic origin (detail)
- Puerto Rican 4% Dominican 1%
- Common ancestry
- Romanian 13% Lithuanian 11% Russian 4%
- Foreign-born
- 3% · Canada, Jamaica
- Languages at home
- 92% English-only · Spanish 5% Other Indo-European 1% French/Haitian/Cajun 1%
Political lean MEDSL · Naugatuck Valley
- 2024 margin
- Lean R (+7.4) · D 45.6% · R 53.0% · Other 1.4%
- All cycles
- 2024: R+7.4
Not yet ingested
- Civics
- —
Market trends
- HPI YoY
- ▼ -62.57%
- Current HPI
- 201.83
- Rent YoY
- —
- Metro
- —
- State GDP YoY
- ▲ 1.06%
- F500 in state
- 38
Industry mix (Fortune 500 HQ in CT)
| Industry | F500 HQs | Revenue |
|---|---|---|
| Industrial Machinery | 4 | $38B |
|
||
| Insurance | 3 | $71B |
|
||
| Financial Services | 2 | $25B |
|
||
| Transportation / Logistics | 2 | $18B |
|
||
| Healthcare | 1 | $247B |
|
||
| Telecommunications | 1 | $55B |
|
||
Price history
+315.8% since first listed3 events — show timeline
- 2026-05-20 Pending — Smart MLS
- 2026-05-11 Listed $395,000 Smart MLS
- 2000-02-22 Sold (Public Records) $95,000 Public Records
Property tax history
+4.4%/yrLatest (2023): $5,787 · +3.8% YoY. Source: county tax records.
Cash-flow waterfall
monthlySold comps — $/sqft
last 12 mo · ≤1 miLoading sold comps…