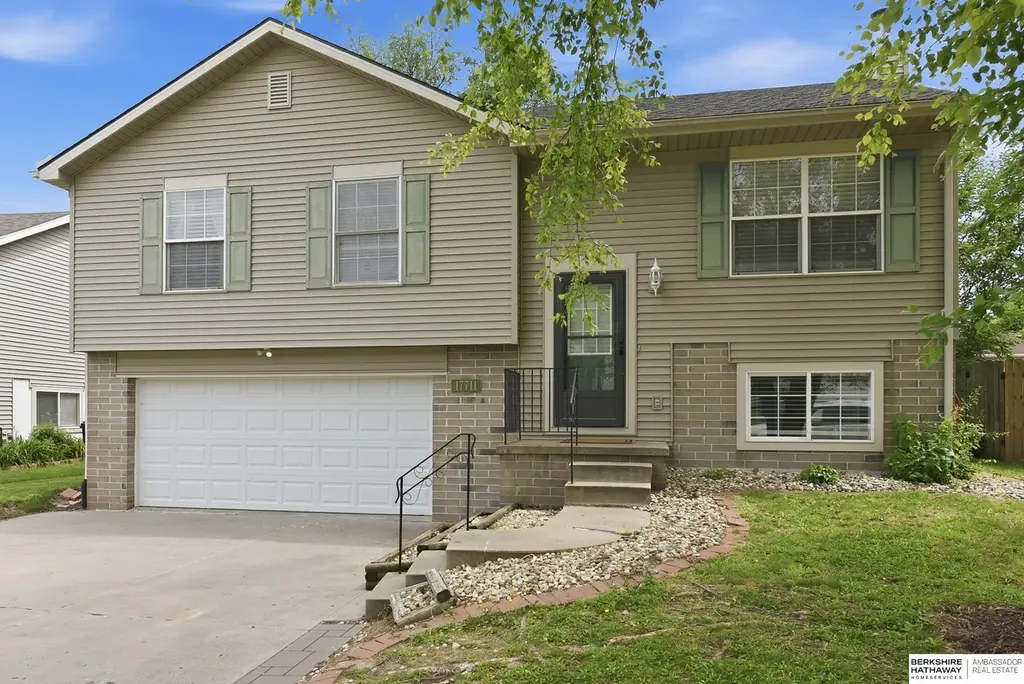
17711 Josephine St · Omaha, NE
Flood risk 1/10 · Minimal
- FEMA flood zone
- X (unshaded)
- Chance of flooding over 30 yrs
- 0.0%
- Est. flood insurance / yr
- $473 – $860
Fire risk 1/10 · Minimal
- Est. fire insurance / yr
- $1,161 – $2,155
Heat risk 3/10 · Minor
- Hot days now (above 103°F)
- 7 days/yr
- Hot days in 30 yrs
- 16 days/yr
Wind risk 2/10 · Minimal
- Chance of severe wind over 30 yrs
- —
Air-quality risk 1/10 · Minimal
- Unhealthy air days now
- 0 days/yr
- Unhealthy air days in 30 yrs
- 0 days/yr
Risk factors via First Street. Map © Google.
Why this score? — see what drove the D grade
The composite is a weighted blend of 9 inputs, each scored 0–100. Each bar is that input's sub-score; the figure is the points it added to the 100-point composite (weight × sub-score).
- Cash flow +11.2/30.0
- ARV discount +7.4/15.0
- Schools +5.3/10.0
- Livability +4.2/5.0
- Rent growth +3.5/5.0
- DSCR +3.3/10.0
- 1% rule +3.2/10.0
- Condition / age +2.5/5.0
- Appreciation +0.0/10.0
$265,000
🖨 Deal sheet (PDF) 📄 Offer letter ✓ Due diligence
Listing remarks MLS
Sharp split entry in Hickory Ridge! Come check out the updates throughout. Kitchen features lot of cabinets, pantry and all appliances are included. Fully fenced backyard includes playground set that stays. Washer and dryer stay. Schedule your private tour today!
Key facts
- Close to schools
- Close to dining
- Close to amenities
Tags
Property features AI
Exterior
- Parking: Attached 2-car garage; 2 covered parking spaces
- Utilities: Electricity available; Natural gas available; Water available; Sewer available (other)
- Home design: Split entry home; Single-family residence; Not new (existing condition)
- Construction: Vinyl siding; Composition roof; Block foundation; Built in 1999
- Exterior features: Deck; Wood full privacy fence; City lot with curb and gutter, curb cut and public sidewalk; Lot up to 1/4 acre (approximately 0.136 acre)
Interior
- Kitchen: Pantry; Range; Dishwasher; Disposal; Microwave; Engineered wood flooring in kitchen
- Bedrooms: Primary bedroom on main floor with ceiling fan, walk-in closet, engineered wood flooring (approx. 11' x 14'); Second bedroom on main floor with ceiling fan and engineered wood flooring (approx. 10' x 10.5'); Third bedroom on main floor with ceiling fan and engineered wood flooring (approx. 9.5' x 11')
- Flooring: Engineered wood; Carpet
- Bathrooms: One full bathroom on the main level
- Heating & cooling: Natural gas forced air heating; Central air conditioning
- Interior features: Daylight, finished basement; No fireplaces; Pantry
- Laundry & utility: Electricity and natural gas available
Neighborhood map
What this means for you Summary
Snapshot
- This is a 3-bed/2.0-bath single-family listed at $265k.
Deal economics
- At list price, monthly cash flow is $-100 ($-1k/yr) — negative.
- To cash-flow at today's rent, offer at most $247k (6.7% below list).
- To meet the 1% rule (rent ≥ 1% of price), the offer needs to be $218k (17.7% below list).
- Recommended offer: $218k (17.7% below list) — sets the bar for 1% rule.
- Cap rate 5.8% vs local median 3.6% in Omaha — top-decile yield for the area; either an underpriced asset or a hidden risk that comps aren't pricing in. Stress-test before assuming the spread holds.
Location & tenants
- Location reads 84/100 on livability (#7 in NE, #663 nationally) — a professional / high-income tenant draw. Strengths: amenities A+, commute A+, cost of living A+; Watch: crime F.
- Millard Public Schools (urban): math 58% / reading 60% proficiency, ranked #13 of 111 in NE (top 12%) — acceptable for families but not a draw, mixed tenant base, ~2y average lease; only 13% free/reduced lunch — higher-income household profile.
- Zoned schools: Wheeler Elementary School (math 70% / reading 68%, grade A-, #58 of 502 statewide, top 12%, 657 students, 18% FRL); Russell Middle School (math 63% / reading 63%, grade B+, #15 of 128 statewide, top 11%, 779 students, 16% FRL); Millard West High School (math 70% / reading 69%, grade B, #13 of 261 statewide, top 7%, 2,309 students, 14% FRL) — zoned schools at 16% FRL track the district average.
- Market conditions: Rents rising fast (+4.1%/yr); 255 active listings in the ZIP; 8 comparable units currently listed for rent nearby; rentals at typical pace (median 16d on market — plan ~3-4 weeks tenant-placement turnaround); high-income renter base; 1,612 units permitted in Sarpy County in 2024 (364 in 5+ unit buildings).
Forward outlook
- Local home prices are declining (-3.0%/yr); year-one equity from $2k of loan paydown is wiped out by about $8k of value loss. Plan a longer hold.
- Sarpy County population projected at +41% by 2050 — long-run rental-demand tailwind backs the buy-and-hold thesis.
Negotiation context
- Only 2 days on market — expect competitive offers; lowballing is unlikely to land.
- 5 sale attempts since 14y ago with the ask held roughly flat each time — persistent listings suggest the price (not the market) is what's stuck; bring a comps-based counter.
- Current owner paid $225k; 18% above their basis — modest negotiation headroom, anchor on the comps not their cost.
Questions for the listing agent
- What do current leases actually rent for vs. the listed asking? Can we see a recent rent roll and the last 12 months of T-12 income?
- Is there a deadline driving the sale (1031 exchange, divorce, estate, relocation)? That informs how much negotiation room exists.
- Crime grade is F in this area — have there been break-ins, vandalism, or insurance claims at this property in the last 3 years? What carrier currently insures it and at what premium?
- The area grade is low — what's the realistic commute time and amenity access for the typical tenant pool here? Any planned neighborhood developments (good or bad) we should know about?
- What's the average days-on-market for RENTAL listings here right now (not sales)? A rising rental-DOM trend means longer vacancies and softer asking-rent achievability than the comps imply.
- What's the recent tenant-quality profile in this submarket — average credit score on applications, eviction rate, late-payment / NSF rate, and stable-employment percentage? A property-management company in the area should have these aggregated.
- How much new for-sale + rental construction is in the pipeline within 1–3 miles? Heavy new supply typically softens prices + rents 12–24 months out; constrained supply supports both.
Investment metrics
- 1% rule
- 0.82% ✗
- Cap rate
- 5.84%
- Cash-on-cash
- -1.62%
- DSCR
- 0.93
- GRM
- 10.1
CMA / ARV
- ARV (on-the-fly)
- $264,600
- Comps found
- 12
Show comp detail 12 sales within ~0.75 mi
| Address | Dist | Beds/Ba | Sqft | Sold | Price | $/sf | Match |
|---|---|---|---|---|---|---|---|
| 7437 S 176th St | 0.17mi | 3/2.0 | 1,350 (0%) | 7mo | $255,000 | $189 | 86 |
| 7113 S 178 Ave | 0.18mi | 3/2.0 | 1,337 (-1%) | 4mo | $275,000 | $206 | 86 |
| 17512 Gertrude Cir | 0.23mi | 3/2.0 | 1,424 (+6%) | 1mo | $285,000 | $200 | 79 |
| 17769 Olive St | 0.10mi | 3/2.0 | 1,230 (-9%) | 4mo | $272,500 | $222 | 77 |
| 17733 Lillian St | 0.10mi | 3/2.0 | 1,488 (+10%) | 2mo | $275,000 | $185 | 76 |
| 7518 S 178 Cir | 0.22mi | 3/2.0 | 1,462 (+8%) | 4mo | $270,000 | $185 | 72 |
| 7212 S 176th St | 0.14mi | 3/2.0 | 1,507 (+12%) | 3mo | $295,000 | $196 | 71 |
| 7112 S 177 St | 0.10mi | 3/2.5 | 1,488 (+10%) | 6mo | $274,000 | $184 | 71 |
| 7520 S 180th Ave | 0.43mi | 3/2.5 | 1,476 (+9%) | 2mo | $305,000 | $207 | 60 |
| 17638 Emiline St | 0.22mi | 3/2.0 | 1,547 (+15%) | 7mo | $265,000 | $171 | 60 |
| 18060 Lillian St | 0.50mi | 3/2.0 | 1,480 (+10%) | 4mo | $290,000 | $196 | 57 |
| 17515 Greenleaf Dr | 0.69mi | 2/2.0 (-1) | 1,383 (+2%) | 3mo | $364,770 | $264 | 56 |
Match score weights: distance 35% · size 25% · config 20% · recency 20%. Top-matched comps best support the ARV.
Projected returns pro-forma
-3.0% appreciation · 4.12% rent growth · sell at horizon
- IRR
- -17.7%
- Equity multiple
- 0.37×
- Total profit
- $-46,821
- Equity at exit
- $39,512
- IRR
- -7.8%
- Equity multiple
- 0.48×
- Total profit
- $-38,459
- Equity at exit
- $22,912
Cash invested: $74,200 (down + closing). Projections, not guarantees.
Landlord ↔ Tenant lean methodology
- Overall (STATE)
- 83 Strongly Landlord-Friendly
- State Nebraska
- 83 Strongly Landlord-Friendly · R+13
- County
- — inherits STATE
- City
- — inherits STATE
ZIP-level market 68136
- Home prices YoY
- -5.2%
- Rents YoY
- 4.1%
- Active inventory
- 255
- Price-to-rent
- 10.1×
Monthly cashflow live
- Estimated rent
- $2,180 high interval (Pro) →
- Mortgage (P&I)
- −$1,390
- Tax from tax record
- −$323 /mo · $3,871/yr
- Insurance
- −$110
- HOA
- −$0
- Vacancy / Maint / Mgmt
- −$458
- Net cashflow
- $-100
Break-even live
Sensitivity live
| Price | -10% $50 | -5% $-25 | +0% $-100 | +5% $-175 | +10% $-250 |
|---|---|---|---|---|---|
| Rent | -10% $-273 | -5% $-186 | +0% $-100 | +5% $-14 | +10% $72 |
| Rate | -1.0pp $33 | -0.5pp $-33 | base $-100 | +0.5pp $-169 | +1.0pp $-239 |
UW: 25.0% down · 7.5% · 30yr · 1.5% tax · 5.0% vac · 8.0% maint · 8.0% mgmt
Financing live
Cash to close
- Down payment
- $66,250
- Closing costs
- $7,950
- Reserves months
- —
- Total cash needed
- —
Loan-product check · same deal, 3 products live
Conventional
25% down · 7.5% · 30yr
- Down + closing
- —
- Monthly P&I
- —
- Monthly cashflow
- —
- DSCR
- —
- Eligible?
- —
Personal DTI + credit; lowest rate.
DSCR
20% down · 8.5% · 30yr
- Down + closing
- —
- Monthly P&I
- —
- Monthly cashflow
- —
- DSCR
- —
- Eligible?
- —
No personal income docs; deal must DSCR.
Hard money
10% down · 12.0% · 12mo
- Down + closing
- —
- Monthly P&I
- —
- Monthly cashflow
- —
- DSCR
- —
- Eligible?
- —
Short-term bridge; refi at stabilization.
Rent comps 8 comps
| Address | Beds | Baths | Sqft | Rent | $/sqft | DOM | Units | Dist |
|---|---|---|---|---|---|---|---|---|
| 18002 Margo St Omaha, NE | 3.0 | 2.0 | 1643 | $2,200 | $1.34 | 45d | 1 | 0.35mi |
| 18192 Hayes Ct Unit 18192 Omaha, NE | 2.0 | 2.0 | 1059 | $1,950 | $1.84 | 16d | 1 | 0.59mi |
| 16556 Monroe St Omaha, NE | 3.0 | 3.0 | 1742 | $2,150 | $1.23 | 45d | 1 | 1.00mi |
| 18217 Cary St Omaha, NE | 3.0 | 1.0–2.0 | 1031 | $2,625 | $2.54 | 4d | 94 | 1.05mi |
| 5964 S 186th Ave Omaha, NE | 3.0 | 2.0 | 1370 | $2,100 | $1.53 | 16d | 1 | 1.08mi |
| 18906 Birch Ave Omaha, NE | 3.0 | 2.0 | 1621 | $2,300 | $1.42 | 12d | 1 | 1.14mi |
| 6121 S 190th Ter Omaha, NE | 3.0 | 2.0 | 1232 | $2,100 | $1.70 | 12d | 1 | 1.23mi |
| 19224 Olive Plz Gretna, NE | 2.0 | 2.0 | 1149 | $1,645 | $1.43 | 4d | 1 | 1.36mi |
Listing history 3 events
-
2026-06-07statusdays on market $265,000 Pending 2 DOM
-
2026-06-05remarks 515-char remark
-
2026-06-05$265,000 New 1 DOM
ⓘ Source: listings_history table (triggers on properties + properties_extension) + one-shot
backfill from property_details.listing_events for pre-trigger history.
Tax reassessment forecast NE · Resets to sale price
- Current annual tax
- $3,871 · $323/mo
- Projected year-2 tax
- $4,584 · $382/mo
- Expected delta
- +$714/yr (+$59/mo · 18.4%)
ⓘ Screening estimate from a state-policy table — verify with the county assessor before closing.
Climate risk First Street
- Flood 1/10 Low FEMA zone X (unshaded) · 0% chance over 30 yrs
- Wildfire 1/10 Low
- Heat 3/10 Moderate 7 d/yr ≥103°F today · 16 d/yr by 30 yrs out
- Wind 2/10 Low
- Air quality 1/10 Low 0 unhealthy d/yr today · 0 by 30 yrs out
Nearby sold comps map
Loading sold comps map…
Walkable amenities ~0.75 mi
Loading nearby amenities…
Taxation est. · year 1
- Rental income
- $26,162
- − Mortgage interest
- −$14,844
- − Property taxes
- −$3,871
- − Insurance
- −$1,325
- − Repairs & maintenance
- −$2,093
- − Management
- −$2,093
- − Depreciation
- −$7,709
- Taxable loss
- −$5,773
- Est. tax savings @ 24.0%
- +$1,386
- After-tax cash flow
- $181/yr
For passive investors: Depreciation is non-cash, so a rental often shows a tax loss while cash-flowing — sheltering income. Rental losses are passive: they offset passive income freely, and up to $25,000/yr can offset ordinary (W-2) income if you actively participate and your MAGI is under $100k (phasing out to $0 by $150k); unused losses carry forward. On sale, claimed depreciation is recaptured at up to 25%, and gains may owe capital-gains tax (a 1031 exchange can defer both). Figures are a year-1 estimate at your 24.0% rate — not tax advice; consult a CPA.
Schools (NCES district)
- District
- Millard Public Schools
- NCES district ID
- 3173740
- Math proficiency
- 58% ▼ -7.00%
- Reading proficiency
- 60% ▼ -6.00%
- Median HH income
- $81,146
- Composite
- 53.23/100
- National rank
- #1500
- State rank
- #13 of 111 in NE
Livability — Omaha
- Score
- 84/100
- State rank
- #7
- US rank
- #663
Category grades
Schools grade is shown separately in the Schools card above.
Census & demographics
- County
- Sarpy County · 161,202 people
- City population
- 552,986
- Metro
- Omaha-Council Bluffs, NE-IA
- Population (ZIP)
- 22,163
- Household income
- $133,472
- Rent vs Own
- Severe rent burden
- 166.0
Population outlook (Sarpy County) Hauer SSP2
- Today (2025)
- 211,769 people
- By 2030
- 229,365 · +8.3%
- By 2040
- 264,122 · +24.7%
- By 2050
- 298,087 · +40.8%
- By 2075
- 381,667 · +80.2%
- By 2100
- 448,180 · +111.6%
Race, ethnicity, and origin ACS 2023
- Neighborhood character
- Predominantly White (86%)
- Race & ethnicity
- White 86% Asian 6% Hispanic / Latino 5% Two or more races 3% Black 2%
- Common ancestry
- Romanian 5% Portuguese 2% Italian 2%
- Foreign-born
- 7% · Vietnam, Canada, China
- Languages at home
- 91% English-only · Vietnamese 3% Spanish 3% Other Asian/Pacific 2%
Political lean MEDSL · Sarpy
- 2024 margin
- R (+11.7) · D 43.5% · R 55.2% · Other 1.3%
- 2008→2024 swing
- +4.2pp toward D · 2008: -15.9pp · 2024: -11.7pp
- All cycles
- 2024: R+11.7 2020: R+11.2 2016: R+21.8 2012: R+23.6 2008: R+15.9
Not yet ingested
- Civics
- —
Market trends
- HPI YoY
- ▼ -12.33%
- Current HPI
- 226.8096
- Rent YoY
- ▲ 4.12%
- Metro
- Omaha-Council Bluffs, NE-IA
- State GDP YoY
- ▲ 0.68%
- F500 in state
- 2
Industry mix (Fortune 500 HQ in NE)
| Industry | F500 HQs | Revenue |
|---|---|---|
| Conglomerate | 1 | $371B |
|
||
Price history
+130.4% since first listed13 events — show timeline
- 2026-06-04 Listed $265,000 GPRMLS
- 2022-02-04 Sold (Public Records) $225,000 Public Records
- 2022-02-02 Sold (MLS) $225,000 CBOR
- 2022-02-02 Sold (MLS) $225,000 NNEMLS
- 2022-02-02 Sold (MLS) $225,000 GPRMLS
- 2022-01-04 Pending — GPRMLS
- 2021-12-13 Listed $225,000 CBOR
- 2021-12-13 Listed $225,000 NNEMLS
- 2021-12-08 Listed $225,000 GPRMLS
- 2012-04-05 Sold (Public Records) $122,000 Public Records
- 2012-03-23 Sold (MLS) $121,500 GPRMLS
- 2012-02-13 Listing Removed — GPRMLS
- 2012-01-16 Listed $115,000 GPRMLS
Property tax history
+2.2%/yrLatest (2025): $3,871 · +4.8% YoY. Source: county tax records.
Cash-flow waterfall
monthlySold comps — $/sqft
last 12 mo · ≤1 miLoading sold comps…