314 N Tamarron Dr #508 · Durango, CO
Flood risk 1/10 · Minimal
- FEMA flood zone
- X (unshaded)
- Chance of flooding over 30 yrs
- 0.0%
- Est. flood insurance / yr
- $507 – $1,088
Fire risk 4/10 · Minor
- Est. fire insurance / yr
- $939 – $1,743
Heat risk 1/10 · Minimal
- Hot days now (above 83°F)
- 10 days/yr
- Hot days in 30 yrs
- 25 days/yr
Wind risk 1/10 · Minimal
- Chance of severe wind over 30 yrs
- —
Air-quality risk 4/10 · Minor
- Unhealthy air days now
- 5 days/yr
- Unhealthy air days in 30 yrs
- 6 days/yr
Risk factors via First Street. Map © Google.
Why this score? — see what drove the D grade
The composite is a weighted blend of 9 inputs, each scored 0–100. Each bar is that input's sub-score; the figure is the points it added to the 100-point composite (weight × sub-score).
- Cash flow +13.7/30.0
- ARV discount +7.5/15.0
- DSCR +4.1/10.0
- Schools +3.4/10.0
- Livability +3.4/5.0
- Rent growth +3.2/5.0
- 1% rule +2.6/10.0
- Condition / age +2.5/5.0
- Appreciation +0.0/10.0
$209,000
🖨 Deal sheet 📄 Offer letter ✓ Due diligence
Listing remarks MLS
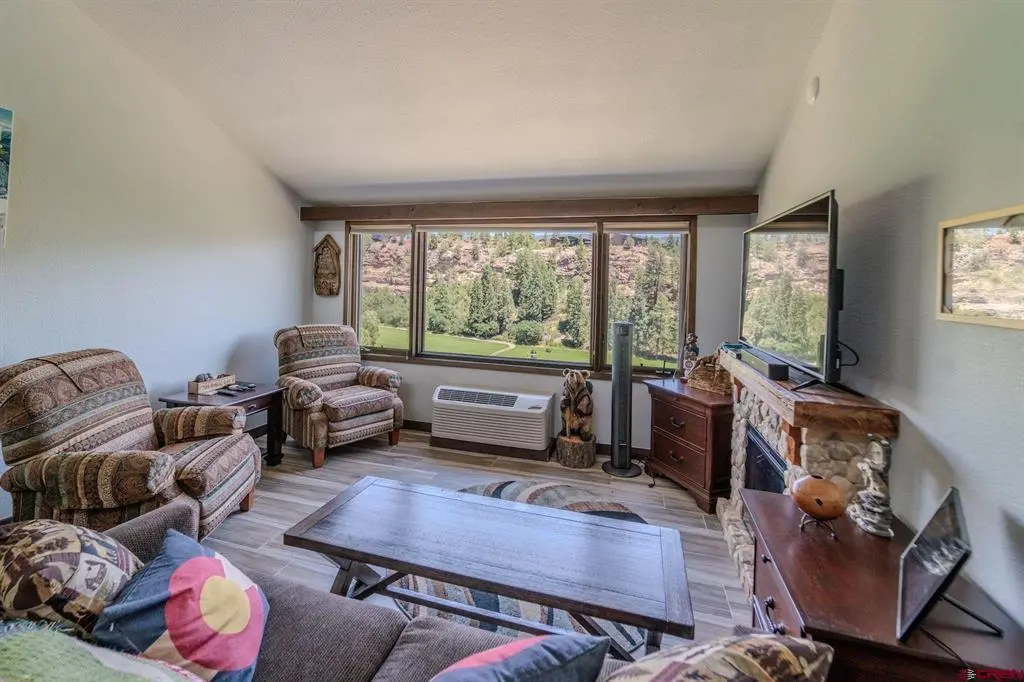
ABOUT THE UNIT: This is an exceptional east facing 5th top floor unit located in the Main Lodge at Tamarron. These don't become available very often. This top floor unit has a vaulted ceiling. Some folks have added lofts to these units allowing a basic studio to get the bed out of the living room. The view from here is amazing - it overlooks the golf course and mountain range from the highest vantage point. Fully furnished with housewares, and is in excellent condition. The hot water heater and the AC/heat unit were both installed 2014. It was remodeled in 2006. This is a must see! ABOUT TAMARRON: Tamarron is 379 unit condominium resort community located in the Colorado Rocky Mountains of Southwest Colorado, between Historic downtown Durango and Purgatory Ski Resort with easy access off HWY 550. A Winter Shuttle is available during ski season to Purgatory Ski Resort. Tamarron units may be placed in a short-term rental program of your choice or you can manage yourself. See Associated Docs for FAQ on Tamarron’s program. Tamarron’s front desk in the Main Lodge is open 24/7 for your convenience. ABOUT HOA FEES: TACO provides low priced, high quality Television, Telephone and Internet service to all Tamarron units. We enjoy preferred ricing through full participation by our unit owners. These services are NOT optional. Satellite Television service is provided by DirecTV and high speed fiber optic internet is provided by Cedar Networks. These services are billed monthly in addition to the above HOA assessments. Current rates are $30.02 per month per Household for satellite TV and $56.59 per month per Household for Internet and Telephone. ABOUT THE AMENITIES: Enjoy the convenience of the Mine Shaft Restaurant located in the new Valley Clubhouse along with a pro shop, banquet and meeting/conference facility. On August 4th, 2018, 2 new swimming pools (inside and outside) and a 4000 SqFt fitness center opened and can be used on a membership basis. The Woodhouse Spa offers massage therapy by appointment. ABOUT THE MEMBERSHIPS: Voluntary Social and Golf Memberships are available at very reasonable prices. Tamarron Owners have preferential pricing. Golf is available now. See Associated Docs for more details on memberships.
Key facts
- Expansive views
- Sizable loft
- Updated kitchen
Tags
Property features AI
Finance
- Financial info: Pets allowed by owner only
- HOA & community: Homeowners association (TACO); Community amenities include clubhouse, fitness center, golf, pool, spa, tennis courts, playground, park, laundry facilities
Exterior
- Parking: Shared driveway
- Security: Fire sprinkler system
- Utilities: Public water; Public sewer; Electricity available; High-speed internet available; Cellular phone reception; Phone service available
- Home design: Single-story property; Has a view; Used for residential/recreational single-family
- Construction: Built with metal siding, wood siding, and stone accents; Composition and metal roof
- Exterior features: Near and on golf course; Public paved road frontage; Community pool; Community spa; Clubhouse; Fitness center; Playground; Park; Tennis courts; Laundry facilities (community)
Interior
- Kitchen: Cooktop; Range; Microwave; Refrigerator; Granite counters
- Bedrooms: Primary bedroom on main level
- Flooring: Tile
- Bathrooms: 1 full bathroom
- Heating & cooling: Electric heating
- Interior features: Furnished; Granite counters; Vaulted ceilings; Living/dining room; Window treatments; Wood window frames
- Laundry & utility: Electric water heater
Neighborhood map
What this means for you Summary
Snapshot
- This is a 1-bed/1.0-bath condo listed at $209k.
Deal economics
- At list price, monthly cash flow is $16 ($193/yr) — positive.
- The deal already cash-flows at list — no discount required.
- To meet the 1% rule (rent ≥ 1% of price), the offer needs to be $159k (24.2% below list).
- Recommended offer: $159k (24.2% below list) — sets the bar for 1% rule.
- Cap rate 6.4% vs local median 1.1% in Durango — top-decile yield for the area; either an underpriced asset or a hidden risk that comps aren't pricing in. Stress-test before assuming the spread holds.
Location & tenants
- Location reads 68/100 on livability (#106 in CO) — a middle-class / working-renter tenant base. Strengths: amenities A-, schools B+, employment B+; Watch: commute F, cost of living F.
- Durango School District No. 9-R (town): math 27% / reading 49% proficiency, ranked #30 of 86 in CO (top 35%) — families likely to look elsewhere, expect single-tenant / working-renter base with shorter leases.
- Market conditions: Rents rising (+2.9%/yr); 580 active listings in the ZIP; solid renter incomes; 306 units permitted in La Plata County in 2024 (93 in 5+ unit buildings).
Forward outlook
- Local home prices are declining (-3.0%/yr); year-one equity from $1k of loan paydown is wiped out by about $6k of value loss. Plan a longer hold.
- La Plata County population projected at +25% by 2050 — long-run rental-demand tailwind backs the buy-and-hold thesis.
Negotiation context
- It's been on market 16 days — a 2% lower offer ($206k) is reasonable based on typical stale-listing flexibility.
- 4 sale attempts since 7y ago with the ask held roughly flat each time — persistent listings suggest the price (not the market) is what's stuck; bring a comps-based counter.
- Current owner paid $89k; list at $209k implies a 135% gain — meaningful room to come down on a strong offer.
Questions for the listing agent
- Built in 1974 — when were the roof, HVAC, electrical panel, plumbing, and water heater last replaced?
- Any open or pending special assessments — roof, HVAC, plumbing, elevator, façade? What's the per-unit balance and payoff schedule, and is the seller paying it off at close or rolling it to the buyer?
- Is there a deadline driving the sale (1031 exchange, divorce, estate, relocation)? That informs how much negotiation room exists.
- Schools are B-rated — typically a magnet for longer-tenancy family renters. What's the average tenant stay here, and is there a school-zone premium baked into asking?
- The area grade is low — what's the realistic commute time and amenity access for the typical tenant pool here? Any planned neighborhood developments (good or bad) we should know about?
- What's the average days-on-market for RENTAL listings here right now (not sales)? A rising rental-DOM trend means longer vacancies and softer asking-rent achievability than the comps imply.
- What's the recent tenant-quality profile in this submarket — average credit score on applications, eviction rate, late-payment / NSF rate, and stable-employment percentage? A property-management company in the area should have these aggregated.
- How much new apartment / multifamily construction is in the pipeline within 1–3 miles? Heavy new supply (>2% of stock underway) typically softens rents 12–24 months out; light construction supports rent growth.
Investment metrics
- 1% rule
- 0.76% ✗
- Cap rate
- 6.39%
- Cash-on-cash
- 0.33%
- DSCR
- 1.01
- GRM
- 11.0
CMA / ARV
No comps found within radius.
Projected returns pro-forma
-3.0% appreciation · 2.94% rent growth · sell at horizon
- IRR
- -15.9%
- Equity multiple
- 0.44×
- Total profit
- $-33,042
- Equity at exit
- $31,163
- IRR
- -7.7%
- Equity multiple
- 0.52×
- Total profit
- $-28,268
- Equity at exit
- $18,071
Cash invested: $58,520 (down + closing). Projections, not guarantees.
Landlord ↔ Tenant lean methodology
- Overall (STATE)
- 38 Tenant-Leaning
- State Colorado
- 38 Tenant-Leaning · D+4
- County
- — inherits STATE
- City
- — inherits STATE
ZIP-level market 81301
- Rents YoY
- 2.9%
- Active inventory
- 580
- Price-to-rent
- 11.0×
Monthly cashflow live
- Estimated rent
- $1,585 medium interval (Pro) →
- Mortgage (P&I)
- −$1,096
- Tax from tax record
- −$53 /mo · $636/yr
- Insurance
- −$87
- HOA
- −$0
- Vacancy / Maint / Mgmt
- −$333
- Net cashflow
- $16
Break-even live
UW: 25.0% down · 7.5% · 30yr · 1.5% tax · 5.0% vac · 8.0% maint · 8.0% mgmt
Financing live
Cash to close
- Down payment
- $52,250
- Closing costs
- $6,270
- Reserves months
- —
- Total cash needed
- —
Loan-product check · same deal, 3 products live
Conventional
25% down · 7.5% · 30yr
- Down + closing
- —
- Monthly P&I
- —
- Monthly cashflow
- —
- DSCR
- —
- Eligible?
- —
Personal DTI + credit; lowest rate.
DSCR
20% down · 8.5% · 30yr
- Down + closing
- —
- Monthly P&I
- —
- Monthly cashflow
- —
- DSCR
- —
- Eligible?
- —
No personal income docs; deal must DSCR.
Hard money
10% down · 12.0% · 12mo
- Down + closing
- —
- Monthly P&I
- —
- Monthly cashflow
- —
- DSCR
- —
- Eligible?
- —
Short-term bridge; refi at stabilization.
HOA detail condo
- Monthly dues
- $0 · $0/yr
- Likely covers
- waterinternetpoolgym
- Assessments
- None detected in remarks — confirm with the listing agent.
Listing history 12 events
-
2026-06-19days on market $209,000 Active 16 DOM
-
2026-06-18days on market $209,000 Active 15 DOM
-
2026-06-17days on market $209,000 Active 14 DOM
-
2026-06-16days on market $209,000 Active 13 DOM
-
2026-06-15days on market $209,000 Active 12 DOM
-
2026-06-14days on market $209,000 Active 10 DOM
-
2026-06-12days on market $209,000 Active 9 DOM
-
2026-06-09days on market $209,000 Active 6 DOM
-
2026-06-08days on market $209,000 Active 5 DOM
-
2026-06-07days on market $209,000 Active 4 DOM
-
2026-06-05remarks 699-char remark
-
2026-06-05$209,000 Active 1 DOM
ⓘ Source: listings_history table (triggers on properties + properties_extension) + one-shot
backfill from property_details.listing_events for pre-trigger history.
Tax reassessment forecast CO · Resets to sale price
- Current annual tax
- $636 · $53/mo
- Projected year-2 tax
- $1,150 · $96/mo
- Expected delta
- +$514/yr (+$43/mo · 80.8%)
ⓘ Screening estimate from a state-policy table — verify with the county assessor before closing.
Climate risk First Street
- Flood 1/10 Low FEMA zone X (unshaded) · 0% chance over 30 yrs
- Wildfire 4/10 Moderate
- Heat 1/10 Low 10 d/yr ≥83°F today · 25 d/yr by 30 yrs out
- Wind 1/10 Low
- Air quality 4/10 Moderate 5 unhealthy d/yr today · 6 by 30 yrs out
Nearby sold comps map
Loading sold comps map…
Walkable amenities ~0.75 mi
Loading nearby amenities…
Taxation est. · year 1
- Rental income
- $19,020
- − Mortgage interest
- −$11,707
- − Property taxes
- −$636
- − Insurance
- −$1,045
- − Repairs & maintenance
- −$1,522
- − Management
- −$1,522
- − Depreciation
- −$6,080
- Taxable loss
- −$3,491
- Est. tax savings @ 24.0%
- +$838
- After-tax cash flow
- $1,031/yr
For passive investors: Depreciation is non-cash, so a rental often shows a tax loss while cash-flowing — sheltering income. Rental losses are passive: they offset passive income freely, and up to $25,000/yr can offset ordinary (W-2) income if you actively participate and your MAGI is under $100k (phasing out to $0 by $150k); unused losses carry forward. On sale, claimed depreciation is recaptured at up to 25%, and gains may owe capital-gains tax (a 1031 exchange can defer both). Figures are a year-1 estimate at your 24.0% rate — not tax advice; consult a CPA.
Schools (NCES district)
- District
- Durango School District No. 9-R
- NCES district ID
- 0803480
- Math proficiency
- 27% ▼ -4.00%
- Reading proficiency
- 49% ▼ -1.00%
- Median HH income
- $58,711
- Composite
- 33.58/100
- National rank
- #5420
- State rank
- #30 of 86 in CO
Livability — Durango
- Score
- 68/100
- State rank
- #106
- US rank
- #9262
Category grades
Schools grade is shown separately in the Schools card above.
Census & demographics
- County
- La Plata County · 40,010 people
- City population
- 29,774
- Metro
- Durango, CO
- Population (ZIP)
- 29,774
- Household income
- $83,943
- Rent vs Own
- Severe rent burden
- 1194.0
Population outlook (La Plata County) Hauer SSP2
- Today (2025)
- 62,781 people
- By 2030
- 66,492 · +5.9%
- By 2040
- 72,944 · +16.2%
- By 2050
- 78,543 · +25.1%
- By 2075
- 89,403 · +42.4%
- By 2100
- 94,984 · +51.3%
Race, ethnicity, and origin ACS 2023
- Neighborhood character
- Predominantly White (81%)
- Race & ethnicity
- White 81% Hispanic / Latino 8% Two or more races 7% Native American 6%
- Hispanic origin (detail)
- Mexican 4%
- Common ancestry
- Slovak 4% Italian 3% Portuguese 2%
- Foreign-born
- 2% · Canada
- Languages at home
- 92% English-only · Spanish 5% German/W. Germanic 1%
Political lean MEDSL · La Plata
- 2024 margin
- D (+18.6) · D 58.0% · R 39.3% · Other 2.8%
- 2008→2024 swing
- +2.4pp toward D · 2008: 16.3pp · 2024: 18.6pp
- All cycles
- 2024: D+18.6 2020: D+17.7 2016: D+9.2 2012: D+8.8 2008: D+16.3
Not yet ingested
- Civics
- —
Market trends
- HPI YoY
- ▼ -651.69%
- Current HPI
- 223.832
- Rent YoY
- ▲ 2.94%
- Metro
- Durango, CO
- State GDP YoY
- ▲ 1.95%
- F500 in state
- 14
Industry mix (Fortune 500 HQ in CO)
| Industry | F500 HQs | Revenue |
|---|---|---|
| Technology Distribution | 1 | $31B |
|
||
| Food / Agriculture | 1 | $18B |
|
||
| Packaging | 1 | $14B |
|
||
| Healthcare | 1 | $13B |
|
||
| Energy | 1 | $10B |
|
||
| Technology | 1 | $4B |
|
||
Price history
+221.5% since first listed10 events — show timeline
- 2026-06-01 Listed $209,000 cren
- 2025-11-26 Listing Removed — cren
- 2025-08-11 Listed $239,000 cren
- 2020-05-29 Sold (Public Records) $89,000 Public Records
- 2020-05-29 Sold (MLS) $89,000 cren
- 2020-04-26 Listed $95,000 cren
- 2019-08-21 Sold (Public Records) $80,000 Public Records
- 2019-08-21 Sold (MLS) $80,000 cren
- 2019-06-13 Listed $83,000 cren
- 2005-04-15 Sold (Public Records) $65,000 Public Records
Property tax history
+18.4%/yrLatest (2025): $636 · +295.2% YoY. Source: county tax records.
Cash-flow waterfall
monthlySold comps — $/sqft
last 12 mo · ≤1 miLoading sold comps…