700 Denver Ave #14 · De Beque, CO
Flood risk 4/10 · Minor
- FEMA flood zone
- X (unshaded)
- Chance of flooding over 30 yrs
- 0.22%
- Est. flood insurance / yr
- $507 – $1,088
Fire risk 5/10 · Moderate
- Est. fire insurance / yr
- $939 – $1,743
Heat risk 4/10 · Minor
- Hot days now (above 94°F)
- 7 days/yr
- Hot days in 30 yrs
- 18 days/yr
Wind risk 1/10 · Minimal
- Chance of severe wind over 30 yrs
- —
Air-quality risk 1/10 · Minimal
- Unhealthy air days now
- 0 days/yr
- Unhealthy air days in 30 yrs
- 0 days/yr
Risk factors via First Street. Map © Google.
Why this score? — see what drove the B- grade
The composite is a weighted blend of 9 inputs, each scored 0–100. Each bar is that input's sub-score; the figure is the points it added to the 100-point composite (weight × sub-score).
- Cash flow +21.8/30.0
- 1% rule +10.0/10.0
- Appreciation +10.0/10.0
- ARV discount +7.5/15.0
- DSCR +7.0/10.0
- Schools +2.7/10.0
- Livability +2.7/5.0
- Rent growth +2.5/5.0
- Condition / age +2.5/5.0
$79,000
🖨 Deal sheet 📄 Offer letter ✓ Due diligence
Listing remarks
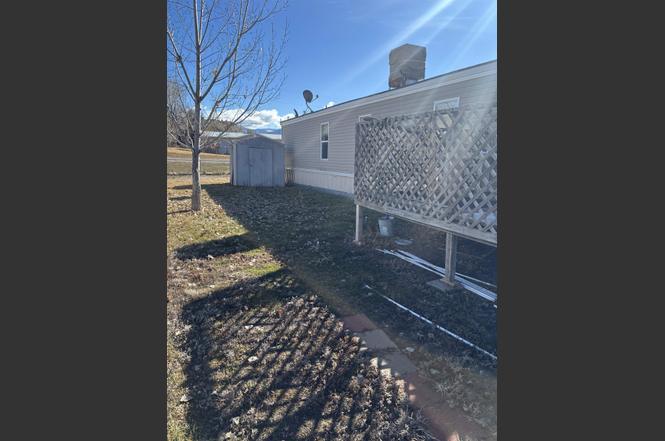
This home has 3 beds, 2 baths, 1216 SqFt. Features vaulted ceilings, open kitchen dining room, (measurements for kitchen and dining room are the same because it's combined) fenced in yard, shed, inexpensive lot rent. Buyer to verify all information
Key facts
- Shed
- Vaulted ceilings
- Fenced in yard
Tags
Property features AI
Finance
- Financial info: Land is leased
- HOA & community: Homeowners association present — $420 monthly
Exterior
- Utilities: Public water; Sewer available
- Home design: Residential mobile home (single wide); Faces east
- Construction: Wood siding; Asphalt/composition roof
- Exterior features: Deck; Chain link fencing; Cleared lot
Interior
- Kitchen: Dishwasher; Gas cooktop; Gas oven; Gas range; Microwave; Refrigerator
- Flooring: Laminate; Simulated wood
- Heating & cooling: Forced air heating; Ceiling fan(s); Evaporative cooling; Window unit(s)
- Interior features: Ceiling fans; Laminate countertops; Vaulted ceilings; Walk-in closets; Window coverings
Neighborhood map
What this means for you Summary
Snapshot
- This is a 3-bed/2.0-bath manufactured listed at $79k.
Deal economics
- At list price, monthly cash flow is $123 ($1k/yr) — positive.
- The deal already cash-flows at list — no discount required.
- Meets the 1% rule at list price ($1k rent vs $79k).
- Recommended offer: $70k (12.0% below list) — sets the bar for market timing.
Location & tenants
- Location reads 53/100 on livability (#365 in CO) — a working-class tenant base; expect higher turnover. Strengths: housing A+, cost of living A; Watch: schools F, crime F, amenities F.
- De Beque Joint District No. 49 Of The Counties Of Mesa And (rural): math 15% / reading 40% proficiency, ranked #119 of 176 in CO (top 68%) — low school quality limits family demand, transient renter base, plan for 1-2y turnover.
- Market conditions: 23 active listings in the ZIP; 1,014 units permitted in Mesa County in 2024 (240 in 5+ unit buildings).
Forward outlook
- In year one you build about $8k of equity ($546 loan paydown + $8k appreciation (10.0% local appreciation)).
- At projected returns (10.0% appreciation + 3.0% rent growth), your $22k cash investment doubles in ~3 years — after that, you're playing with house money.
- By year 5, paydown + projected appreciation supports a ~$39k cash-out refi (75% LTV) — recoverable capital for the next deal without selling this one.
Negotiation context
- It's been on market 220 days — a 12% lower offer ($70k) is reasonable based on typical stale-listing flexibility.
Risks & watch-outs
- Watch-outs: HOA is 30% of rent.
- Climate carrying-cost: moderate wildfire risk — expect insurance premiums to compound above CPI over the hold.
Questions for the listing agent
- It's been on market 220 days. Have you received any prior offers? Is the seller open to a 12% concession, seller financing, or rate buy-down credit?
- What does the HOA fee cover, when was the last increase, and are there any pending special assessments or reserve-fund shortfalls?
- Why hasn't it sold? Are there any deal-killer items the seller is aware of (foundation, flood, title, zoning, code violations)?
- Is there a deadline driving the sale (1031 exchange, divorce, estate, relocation)? That informs how much negotiation room exists.
- Schools are F-rated, which usually means shorter tenancies and higher turnover. Who's the typical renter profile here, and what's been the actual vacancy rate?
- Crime grade is F in this area — have there been break-ins, vandalism, or insurance claims at this property in the last 3 years? What carrier currently insures it and at what premium?
- What's the average days-on-market for RENTAL listings here right now (not sales)? A rising rental-DOM trend means longer vacancies and softer asking-rent achievability than the comps imply.
- What's the recent tenant-quality profile in this submarket — average credit score on applications, eviction rate, late-payment / NSF rate, and stable-employment percentage? A property-management company in the area should have these aggregated.
- How much new for-sale + rental construction is in the pipeline within 1–3 miles? Heavy new supply typically softens prices + rents 12–24 months out; constrained supply supports both.
Investment metrics
- 1% rule
- 1.74% ✓
- Cap rate
- 8.16%
- Cash-on-cash
- 6.66%
- DSCR
- 1.30
- GRM
- 4.8
CMA / ARV
No comps found within radius.
Projected returns pro-forma
10.0% appreciation · 3.0% rent growth · sell at horizon
- IRR
- 29.2%
- Equity multiple
- 3.31×
- Total profit
- $51,119
- Equity at exit
- $71,169
- IRR
- 25.5%
- Equity multiple
- 7.55×
- Total profit
- $144,946
- Equity at exit
- $153,480
Cash invested: $22,120 (down + closing). Projections, not guarantees.
Landlord ↔ Tenant lean methodology
- Overall (STATE)
- 38 Tenant-Leaning
- State Colorado
- 38 Tenant-Leaning · D+4
- County
- — inherits STATE
- City
- — inherits STATE
ZIP-level market 81630
- Home prices YoY
- 10.1%
- Active inventory
- 23
- Price-to-rent
- 4.8×
Monthly cashflow live
- Estimated rent
- $1,378 medium interval (Pro) →
- Mortgage (P&I)
- −$414
- Tax est. 1.5%
- −$99 /mo · $1,185/yr
- Insurance
- −$33
- HOA
- −$420
- Vacancy / Maint / Mgmt
- −$289
- Net cashflow
- $123
Break-even live
UW: 25.0% down · 7.5% · 30yr · 1.5% tax · 5.0% vac · 8.0% maint · 8.0% mgmt
Financing live
Cash to close
- Down payment
- $19,750
- Closing costs
- $2,370
- Reserves months
- —
- Total cash needed
- —
Loan-product check · same deal, 3 products live
Conventional
25% down · 7.5% · 30yr
- Down + closing
- —
- Monthly P&I
- —
- Monthly cashflow
- —
- DSCR
- —
- Eligible?
- —
Personal DTI + credit; lowest rate.
DSCR
20% down · 8.5% · 30yr
- Down + closing
- —
- Monthly P&I
- —
- Monthly cashflow
- —
- DSCR
- —
- Eligible?
- —
No personal income docs; deal must DSCR.
Hard money
10% down · 12.0% · 12mo
- Down + closing
- —
- Monthly P&I
- —
- Monthly cashflow
- —
- DSCR
- —
- Eligible?
- —
Short-term bridge; refi at stabilization.
HOA detail
- Monthly dues
- $420 · $5,040/yr
Listing history 21 events
-
2026-06-19days on market $79,000 Active 220 DOM
-
2026-06-18days on market $79,000 Active 219 DOM
-
2026-06-17days on market $79,000 Active 218 DOM
-
2026-06-16days on market $79,000 Active 217 DOM
-
2026-06-15days on market $79,000 Active 216 DOM
-
2026-06-13days on market $79,000 Active 214 DOM
-
2026-06-12days on market $79,000 Active 213 DOM
-
2026-06-09days on market $79,000 Active 210 DOM
-
2026-06-08days on market $79,000 Active 209 DOM
-
2026-06-07days on market $79,000 Active 208 DOM
-
2026-06-05days on market $79,000 Active 206 DOM
-
2026-06-04days on market $79,000 Active 204 DOM
-
2026-06-02days on market $79,000 Active 203 DOM
-
2026-06-01days on market $79,000 Active 202 DOM
-
2026-05-31days on market $79,000 Active 201 DOM
-
2026-05-31days on market $79,000 Active 200 DOM
-
2026-04-23price $79,000
-
2026-03-17price $85,000
-
2026-01-02price $99,000
-
2025-11-19price $110,000
-
2025-11-11$115,000 Active
ⓘ Source: listings_history table (triggers on properties + properties_extension) + one-shot
backfill from property_details.listing_events for pre-trigger history.
Climate risk First Street
- Flood 4/10 Moderate FEMA zone X (unshaded) · 22% chance over 30 yrs
- Wildfire 5/10 Major
- Heat 4/10 Moderate 7 d/yr ≥94°F today · 18 d/yr by 30 yrs out
- Wind 1/10 Low
- Air quality 1/10 Low 0 unhealthy d/yr today · 0 by 30 yrs out
Nearby sold comps map
Loading sold comps map…
Walkable amenities ~0.75 mi
Loading nearby amenities…
Taxation est. · year 1
- Rental income
- $16,536
- − Mortgage interest
- −$4,425
- − Property taxes
- −$1,185
- − Insurance
- −$395
- − Repairs & maintenance
- −$1,323
- − Management
- −$1,323
- − HOA
- −$5,040
- − Depreciation
- −$2,298
- Taxable income
- $547
- Est. tax owed @ 24.0%
- −$131
- After-tax cash flow
- $1,341/yr
For passive investors: Depreciation is non-cash, so a rental often shows a tax loss while cash-flowing — sheltering income. Rental losses are passive: they offset passive income freely, and up to $25,000/yr can offset ordinary (W-2) income if you actively participate and your MAGI is under $100k (phasing out to $0 by $150k); unused losses carry forward. On sale, claimed depreciation is recaptured at up to 25%, and gains may owe capital-gains tax (a 1031 exchange can defer both). Figures are a year-1 estimate at your 24.0% rate — not tax advice; consult a CPA.
Schools (NCES district)
- District
- De Beque Joint District No. 49 Of The Counties Of Mesa And
- NCES district ID
- 0803240
- Math proficiency
- 15% ▼ -5.00%
- Reading proficiency
- 40% ▲ 10.00%
- Median HH income
- $54,591
- Composite
- 27.46/100
- National rank
- #12381
- State rank
- #119 of 176 in CO
Livability — De Beque
- Score
- 53/100
- State rank
- #365
- US rank
- #24269
Category grades
Schools grade is shown separately in the Schools card above.
Census & demographics
- Census place
- De Beque, CO
- Population (ZIP)
- 1,052
Population outlook (Mesa County) Hauer SSP2
- Today (2025)
- 153,000 people
- By 2030
- 154,479 · +1.0%
- By 2040
- 155,257 · +1.5%
- By 2050
- 153,384 · +0.3%
- By 2075
- 144,735 · -5.4%
- By 2100
- 123,825 · -19.1%
Race, ethnicity, and origin ACS 2023
- Neighborhood character
- Predominantly White (79%)
- Race & ethnicity
- White 79% Two or more races 17% Hispanic / Latino 15%
- Hispanic origin (detail)
- Mexican 9%
- Common ancestry
- Lithuanian 5% Slovak 4% Romanian 4%
- Foreign-born
- 3% · Canada
- Languages at home
- 96% English-only · Spanish 3%
Political lean MEDSL · Mesa
- 2024 margin
- Strong R (+24.3) · D 36.6% · R 61.0% · Other 2.4%
- 2008→2024 swing
- +5.2pp toward D · 2008: -29.5pp · 2024: -24.3pp
- All cycles
- 2024: R+24.3 2020: R+28.0 2016: R+36.3 2012: R+32.8 2008: R+29.5
Not yet ingested
- Civics
- —
Market trends
- HPI YoY
- ▲ 28.53%
- Current HPI
- 311.6725
- Rent YoY
- —
- Metro
- —
- State GDP YoY
- ▲ 1.95%
- F500 in state
- 14
Industry mix (Fortune 500 HQ in CO)
| Industry | F500 HQs | Revenue |
|---|---|---|
| Technology Distribution | 1 | $31B |
|
||
| Food / Agriculture | 1 | $18B |
|
||
| Packaging | 1 | $14B |
|
||
| Healthcare | 1 | $13B |
|
||
| Energy | 1 | $10B |
|
||
| Technology | 1 | $4B |
|
||
Price history
-31.3% since first listed5 events — show timeline
- 2026-04-23 Price Changed $79,000 GJARA
- 2026-03-17 Price Changed $85,000 GJARA
- 2026-01-02 Price Changed $99,000 GJARA
- 2025-11-19 Price Changed $110,000 GJARA
- 2025-11-11 Listed $115,000 GJARA
Property tax history
-5.3%/yrLatest (2024): $40 · +3.9% YoY. Source: county tax records.
Cash-flow waterfall
monthlySold comps — $/sqft
last 12 mo · ≤1 miLoading sold comps…