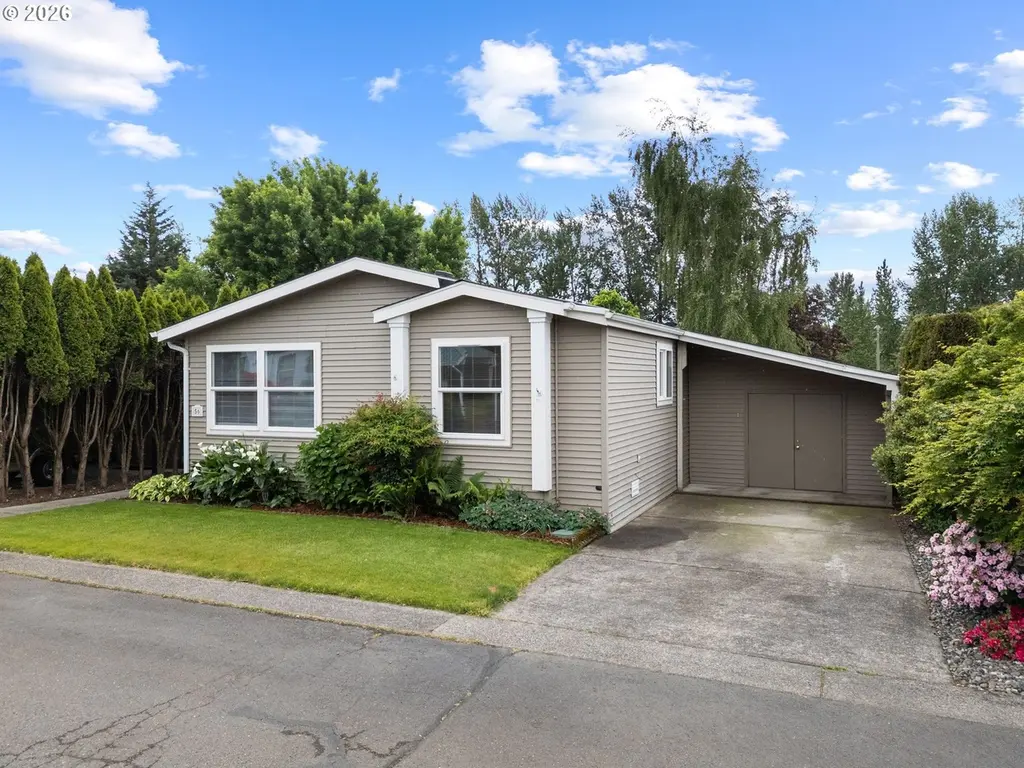
3777 Addy St #56 · Washougal, WA
Flood risk No data
- FEMA flood zone
- —
- Chance of flooding over 30 yrs
- —
- Est. flood insurance / yr
- —
Fire risk No data
- Est. fire insurance / yr
- —
Heat risk No data
- Hot days now (above threshold)
- —
- Hot days in 30 yrs
- —
Wind risk No data
- Chance of severe wind over 30 yrs
- —
Air-quality risk No data
- Unhealthy air days now
- —
- Unhealthy air days in 30 yrs
- —
Risk factors via First Street. Map © Google.
Why this score? — see what drove the A- grade
The composite is a weighted blend of 9 inputs, each scored 0–100. Each bar is that input's sub-score; the figure is the points it added to the 100-point composite (weight × sub-score).
- Cash flow +30.0/30.0
- ARV discount +15.0/15.0
- 1% rule +10.0/10.0
- DSCR +10.0/10.0
- Schools +5.3/10.0
- Livability +4.2/5.0
- Rent growth +3.4/5.0
- Condition / age +2.5/5.0
- Appreciation +0.0/10.0
$119,000
🖨 Deal sheet 📄 Offer letter ✓ Due diligence
Listing remarks MLS
Lovely well kept home that is vaulted throughout.High end Golden West home with lots of extras. Master has 2 walk-in closits.Skylights,designer colors,large pantry, wonderful front deck.Large enclosed carport for storage.Lots of flowers in backyard.Park is right accross the street.All windowcoverings stay.Sale excludes lilacs in back yard.Move in ready.Can close anytime.
Key facts
- Enclosed carport
- Small workshop
- Columbia river gorge
Tags
Property features AI
Finance
- Other: Unit dimensions: 52' x 28'; Manufacturer: Glden; Property condition: Resale
- Financial info: Lot rent $850 monthly
- HOA & community: Park name: North Shore Estates; Pet restrictions apply
Exterior
- Parking: Driveway; Attached garage
- Utilities: Electric fuel; Public water; Public sewer
- Home design: Manufactured home in park (residential); Single-story layout; No view
- Construction: Built in 1992; Skirting foundation; Composition roof
- Exterior features: Porch; Yard; Vinyl siding; Level lot; Paved road access
Interior
- Kitchen: Cooktop; Free‑standing range; Free‑standing refrigerator; Trash compactor; Electric hot water
- Bedrooms: Primary bedroom on main level; Second bedroom on main level; Third bedroom on main level
- Flooring: Laminate flooring; Wall-to-wall carpet
- Bathrooms: Two full bathrooms (both on main level)
- Heating & cooling: Forced air heating; Central air conditioning
- Interior features: Accessibility features including parking and a walk-in shower; Laminate flooring and wall-to-wall carpet; Washer and dryer included; Double-pane windows with vinyl frames
- Laundry & utility: Washer and dryer included
Neighborhood map
What this means for you Summary
Snapshot
- This is a 3-bed/2.0-bath manufactured listed at $119k.
Deal economics
- At list price, monthly cash flow is $1k ($13k/yr) — positive.
- The deal already cash-flows at list — no discount required.
- Meets the 1% rule at list price ($2k rent vs $119k).
- Cap rate 17.2% vs local median 1.7% in Washougal — top-decile yield for the area; either an underpriced asset or a hidden risk that comps aren't pricing in. Stress-test before assuming the spread holds.
Location & tenants
- Location reads 84/100 on livability (#42 in WA, #742 nationally) — a professional / high-income tenant draw. Strengths: employment A+, housing A+, health & safety A+; Watch: amenities D+, cost of living F.
- Washougal School District (suburban): math 53% / reading 64% proficiency, ranked #59 of 291 in WA (top 20%) — acceptable for families but not a draw, mixed tenant base, ~2y average lease.
- Zoned schools: Columbia River Gorge Elementary School (339 students, 43% FRL); Jemtegaard Middle School (439 students, 48% FRL); Washougal High School (1,006 students, 38% FRL).
- Market conditions: Rents rising (+3.7%/yr); 275 active listings in the ZIP; 9 comparable units currently listed for rent nearby; rentals at typical pace (median 15d on market — plan ~3-4 weeks tenant-placement turnaround); 44% of comp listings sitting > 30 days — soft ceiling on asking rent; high-income renter base; 3,547 units permitted in Clark County in 2024 (1,361 in 5+ unit buildings).
Forward outlook
- Local home prices are declining (-3.0%/yr); year-one equity from $823 of loan paydown is wiped out by about $4k of value loss. Plan a longer hold.
- Clark County population projected at +29% by 2050 — long-run rental-demand tailwind backs the buy-and-hold thesis.
- At projected returns (-3.0% appreciation + 3.7% rent growth), your $33k cash investment doubles in ~3 years — after that, you're playing with house money.
Negotiation context
- Only 10 days on market — expect competitive offers; lowballing is unlikely to land.
- 3 sale attempts since 21y ago with the ask held roughly flat each time — persistent listings suggest the price (not the market) is what's stuck; bring a comps-based counter.
- Current owner paid $50k; list at $119k implies a 140% gain — meaningful room to come down on a strong offer.
Questions for the listing agent
- Is there a deadline driving the sale (1031 exchange, divorce, estate, relocation)? That informs how much negotiation room exists.
- Schools are B-rated — typically a magnet for longer-tenancy family renters. What's the average tenant stay here, and is there a school-zone premium baked into asking?
- What's the average days-on-market for RENTAL listings here right now (not sales)? A rising rental-DOM trend means longer vacancies and softer asking-rent achievability than the comps imply.
- What's the recent tenant-quality profile in this submarket — average credit score on applications, eviction rate, late-payment / NSF rate, and stable-employment percentage? A property-management company in the area should have these aggregated.
- How much new for-sale + rental construction is in the pipeline within 1–3 miles? Heavy new supply typically softens prices + rents 12–24 months out; constrained supply supports both.
Investment metrics
- 1% rule
- 1.91% ✓
- Cap rate
- 17.23%
- Cash-on-cash
- 39.08%
- DSCR
- 2.74
- GRM
- 4.4
CMA / ARV
- ARV (on-the-fly)
- $157,861
- Comps found
- 6
Show comp detail 6 sales within ~0.75 mi
| Address | Dist | Beds/Ba | Sqft | Sold | Price | $/sf | Match |
|---|---|---|---|---|---|---|---|
| 3777 Addy St #12 | 0.00mi | 3/2.0 | 1,348 (-4%) | 4mo | $105,000 | $78 | 91 |
| 3777 Addy St #63 | 0.00mi | 3/2.0 | 1,404 (+0%) | 10mo | $159,000 | $113 | 91 |
| 3777 Addy St #4 | 0.00mi | 3/2.0 | 1,200 (-14%) | 10mo | $150,000 | $125 | 68 |
| 3777 Addy St #54 | 0.00mi | 3/2.0 | 1,252 (-10%) | 17mo | $135,000 | $108 | 68 |
| 3777 Addy St #33 | 0.00mi | 3/2.0 | 1,197 (-14%) | 10mo | $128,000 | $107 | 68 |
| 4501 Addy St #16 | 0.46mi | 3/2.0 | 1,248 (-11%) | 10mo | $190,708 | $153 | 52 |
Match score weights: distance 35% · size 25% · config 20% · recency 20%. Top-matched comps best support the ARV.
Projected returns pro-forma
-3.0% appreciation · 3.7% rent growth · sell at horizon
- IRR
- 36.0%
- Equity multiple
- 2.54×
- Total profit
- $51,397
- Equity at exit
- $17,743
- IRR
- 43.1%
- Equity multiple
- 5.21×
- Total profit
- $140,287
- Equity at exit
- $10,289
Cash invested: $33,320 (down + closing). Projections, not guarantees.
Landlord ↔ Tenant lean methodology
- Overall (STATE)
- 28 Tenant-Leaning
- State Washington
- 28 Tenant-Leaning · D+8
- County
- — inherits STATE
- City
- — inherits STATE
ZIP-level market 98671
- Rents YoY
- 3.7%
- Active inventory
- 275
- Price-to-rent
- 4.4×
Monthly cashflow live
- Estimated rent
- $2,268 high interval (Pro) →
- Mortgage (P&I)
- −$624
- Tax from tax record
- −$33 /mo · $393/yr
- Insurance
- −$50
- HOA
- −$0
- Vacancy / Maint / Mgmt
- −$476
- Net cashflow
- $1,085
Break-even live
UW: 25.0% down · 7.5% · 30yr · 1.5% tax · 5.0% vac · 8.0% maint · 8.0% mgmt
Financing live
Cash to close
- Down payment
- $29,750
- Closing costs
- $3,570
- Reserves months
- —
- Total cash needed
- —
Loan-product check · same deal, 3 products live
Conventional
25% down · 7.5% · 30yr
- Down + closing
- —
- Monthly P&I
- —
- Monthly cashflow
- —
- DSCR
- —
- Eligible?
- —
Personal DTI + credit; lowest rate.
DSCR
20% down · 8.5% · 30yr
- Down + closing
- —
- Monthly P&I
- —
- Monthly cashflow
- —
- DSCR
- —
- Eligible?
- —
No personal income docs; deal must DSCR.
Hard money
10% down · 12.0% · 12mo
- Down + closing
- —
- Monthly P&I
- —
- Monthly cashflow
- —
- DSCR
- —
- Eligible?
- —
Short-term bridge; refi at stabilization.
Rent comps 9 comps
| Address | Beds | Baths | Sqft | Rent | $/sqft | DOM | Units | Dist |
|---|---|---|---|---|---|---|---|---|
| 3381 Lewis Ln Washougal, WA | 2.0 | 2.5 | 980 | $2,195 | $2.24 | 2d | 1 | 0.33mi |
| 3337 Lewis Ln Washougal, WA | 2.0 | 2.5 | 981 | $2,195 | $2.24 | 44d | 1 | 0.33mi |
| 3251 Lewis Ln Washougal, WA | 2.0 | 2.5 | 992 | $2,095 | $2.11 | 2d | 1 | 0.42mi |
| 3108 H St Apt 3 Washougal, WA | 2.0 | 1.5 | 950 | $1,450 | $1.53 | 2d | 1 | 0.60mi |
| 4694 Rolling Meadows Dr Washougal, WA | 3.0 | 2.0 | 1358 | $2,900 | $2.14 | 15d | 1 | 0.90mi |
| 2300 Main St Washougal, WA | 2.0 | 2.0 | 1080 | $1,845 | $1.71 | 2d | 10 | 0.99mi |
| 5447 N St Washougal, WA | 3.0 | 2.0 | 1872 | $2,795 | $1.49 | 44d | 1 | 1.14mi |
| 1628 G St Washougal, WA | 2.0 | 1.0 | 900 | $1,595 | $1.77 | 44d | 1 | 1.35mi |
| 1506 G St Washougal, WA | 2.0 | 1.0 | 900 | $1,925 | $2.14 | 44d | 1 | 1.40mi |
Listing history 7 events
-
2026-06-15statusdays on market $119,000 Pending 10 DOM
-
2026-06-13days on market $119,000 Active 9 DOM
-
2026-06-09days on market $119,000 Active 5 DOM
-
2026-06-08days on market $119,000 Active 4 DOM
-
2026-06-07days on market $119,000 Active 3 DOM
-
2026-06-05remarks 699-char remark
-
2026-06-05$119,000 Active 1 DOM
ⓘ Source: listings_history table (triggers on properties + properties_extension) + one-shot
backfill from property_details.listing_events for pre-trigger history.
Tax reassessment forecast WA · Resets to sale price
- Current annual tax
- $393 · $33/mo
- Projected year-2 tax
- $1,166 · $97/mo
- Expected delta
- +$773/yr (+$64/mo · 197.0%)
ⓘ Screening estimate from a state-policy table — verify with the county assessor before closing.
Nearby sold comps map
Loading sold comps map…
Walkable amenities ~0.75 mi
Loading nearby amenities…
Taxation est. · year 1
- Rental income
- $27,212
- − Mortgage interest
- −$6,666
- − Property taxes
- −$393
- − Insurance
- −$595
- − Repairs & maintenance
- −$2,177
- − Management
- −$2,177
- − Depreciation
- −$3,462
- Taxable income
- $11,742
- Est. tax owed @ 24.0%
- −$2,818
- After-tax cash flow
- $10,203/yr
For passive investors: Depreciation is non-cash, so a rental often shows a tax loss while cash-flowing — sheltering income. Rental losses are passive: they offset passive income freely, and up to $25,000/yr can offset ordinary (W-2) income if you actively participate and your MAGI is under $100k (phasing out to $0 by $150k); unused losses carry forward. On sale, claimed depreciation is recaptured at up to 25%, and gains may owe capital-gains tax (a 1031 exchange can defer both). Figures are a year-1 estimate at your 24.0% rate — not tax advice; consult a CPA.
Schools (NCES district)
- District
- Washougal School District
- NCES district ID
- 5309540
- Math proficiency
- 53% ▼ -2.00%
- Reading proficiency
- 64% ▼ -2.00%
- Median HH income
- $68,134
- Composite
- 53.22/100
- National rank
- #3195
- State rank
- #59 of 291 in WA
Livability — Washougal
- Score
- 84/100
- State rank
- #42
- US rank
- #742
Category grades
Schools grade is shown separately in the Schools card above.
Census & demographics
- Census place
- Washougal, WA
- County
- Clark County · 513,189 people
- City population
- 24,871
- Metro
- Portland-Vancouver-Hillsboro, OR-WA
- Population (ZIP)
- 24,871
- Household income
- $111,545
- Rent vs Own
- Severe rent burden
- 382.0
Population outlook (Clark County) Hauer SSP2
- Today (2025)
- 529,610 people
- By 2030
- 563,242 · +6.4%
- By 2040
- 625,905 · +18.2%
- By 2050
- 681,558 · +28.7%
- By 2075
- 805,967 · +52.2%
- By 2100
- 877,450 · +65.7%
Race, ethnicity, and origin ACS 2023
- Neighborhood character
- Predominantly White (82%)
- Race & ethnicity
- White 82% Hispanic / Latino 10% Two or more races 9% Asian 2%
- Hispanic origin (detail)
- Mexican 7%
- Common ancestry
- Portuguese 5% Italian 3% Lithuanian 3%
- Foreign-born
- 4% · Canada, China
- Languages at home
- 91% English-only · Spanish 6% Chinese 1% Russian/Polish/Slavic 1%
Political lean MEDSL · Clark
- 2024 margin
- Lean D (+7.0) · D 52.1% · R 45.1% · Other 2.8%
- 2008→2024 swing
- +0.9pp no change · 2008: 6.1pp · 2024: 7.0pp
- All cycles
- 2024: D+7.0 2020: D+5.1 2016: D+0.1 2012: D+0.1 2008: D+6.1
Not yet ingested
- Civics
- —
Market trends
- HPI YoY
- ▼ -418.85%
- Current HPI
- 315.8635
- Rent YoY
- ▲ 3.70%
- Metro
- Portland-Vancouver-Hillsboro, OR-WA
- State GDP YoY
- ▲ 4.65%
- F500 in state
- 22
Industry mix (Fortune 500 HQ in WA)
| Industry | F500 HQs | Revenue |
|---|---|---|
| Retail | 2 | $269B |
|
||
| Technology / Retail | 1 | $638B |
|
||
| Technology | 1 | $245B |
|
||
| Telecommunications | 1 | $38B |
|
||
| Food / Beverage | 1 | $36B |
|
||
| Automotive / Trucks | 1 | $34B |
|
||
Price history
+98.7% since first listed7 events — show timeline
- 2026-06-04 Listed $119,000 RMLS
- 2011-04-24 Sold (MLS) $49,500 RMLS
- 2011-03-08 Pending — RMLS
- 2010-12-06 Listed $49,500 RMLS
- 2005-06-01 Sold (MLS) $56,900 RMLS
- 2005-04-21 Delisted — RMLS
- 2005-02-14 Listed $59,900 RMLS
Property tax history
-2.2%/yrLatest (2022): $393 · -9.4% YoY. Source: county tax records.
Cash-flow waterfall
monthlySold comps — $/sqft
last 12 mo · ≤1 miLoading sold comps…