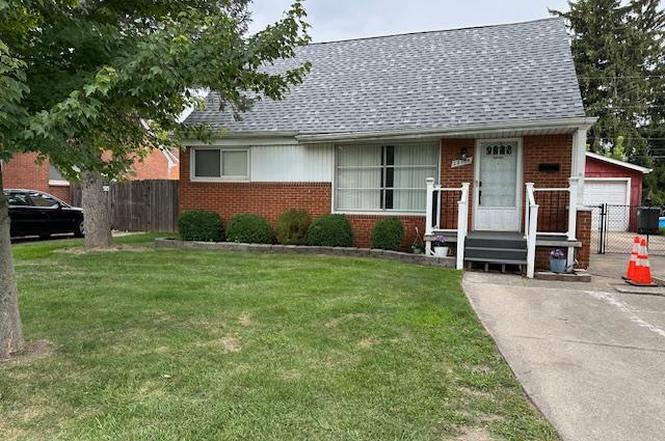
22134 Wick Rd · Taylor, MI
Flood risk No data
- FEMA flood zone
- —
- Chance of flooding over 30 yrs
- —
- Est. flood insurance / yr
- —
Fire risk No data
- Est. fire insurance / yr
- —
Heat risk No data
- Hot days now (above threshold)
- —
- Hot days in 30 yrs
- —
Wind risk No data
- Chance of severe wind over 30 yrs
- —
Air-quality risk No data
- Unhealthy air days now
- —
- Unhealthy air days in 30 yrs
- —
Risk factors via First Street. Map © Google.
Why this score? — see what drove the D+ grade
The composite is a weighted blend of 9 inputs, each scored 0–100. Each bar is that input's sub-score; the figure is the points it added to the 100-point composite (weight × sub-score).
- Cash flow +15.2/30.0
- ARV discount +13.8/15.0
- DSCR +4.7/10.0
- Livability +3.8/5.0
- 1% rule +3.7/10.0
- Rent growth +3.7/5.0
- Condition / age +2.5/5.0
- Schools +1.8/10.0
- Appreciation +0.0/10.0
$169,900
🖨 Deal sheet 📄 Offer letter ✓ Due diligence
Listing remarks MLS
* * ESTATE SALE * * 3 BEDROOM BUNGALOW IN PRIME TAYLOR AREA. 1 1/2 CAR GARAGE WITH ELECTRICITY. FULL PARTIALLY FINISHED BASEMENT. BIG BACKYARD FOR ENTERTAINMENT. NEWER F/A C/A ROOF. PURCHASER TO ASSUME ALL REPAIRS FOR CERTIFICATE OF OCCUPANCY. FURTHER DETAILS IN AGENT REMARKS. EASY SHOWINGS. BATVAI. LICENSED REALTORS PRESENT AT ALL SHOWINGS. NO VIRTUAL TOURS,
Key facts
- Big backyard
- Newer roof
- 1 1/2 car garage
Tags
Neighborhood map
What this means for you Summary
Snapshot
- This is a 3-bed/1.0-bath single-family listed at $170k.
Deal economics
- At list price, monthly cash flow is $60 ($725/yr) — positive.
- The deal already cash-flows at list — no discount required.
- To meet the 1% rule (rent ≥ 1% of price), the offer needs to be $149k (12.6% below list).
- Recommended offer: $149k (12.6% below list) — sets the bar for 1% rule.
- Cap rate 6.7% vs local median 5.4% in Taylor — meaningfully above typical; check what's discounted (condition, days-on-market, listing class) to confirm the premium yield is real.
Location & tenants
- Location reads 76/100 on livability (#144 in MI, #3,684 nationally) — a middle-class / working-renter tenant base. Strengths: commute A+, cost of living A+, housing A+; Watch: employment D+, schools F, crime F.
- Taylor School District (urban): math 14% / reading 27% proficiency, ranked #462 of 540 in MI (top 86%) — low school quality limits family demand, transient renter base, plan for 1-2y turnover; 68% free/reduced lunch — lower-income household profile, screen leases tightly.
- Market conditions: Rents rising fast (+4.9%/yr); 281 active listings in the ZIP; 7 comparable units currently listed for rent nearby; rentals leasing fast (median 13d on market — plan ~1-2 weeks tenant-placement turnaround); 2,639 units permitted in Wayne County in 2024 (1,216 in 5+ unit buildings).
Forward outlook
- Local home prices are declining (-3.0%/yr); year-one equity from $1k of loan paydown is wiped out by about $5k of value loss. Plan a longer hold.
- Wayne County population projected at -17% by 2050 — secular population decline; favor cash flow + early exit over multi-decade hold.
Negotiation context
- It's been on market 221 days — a 12% lower offer ($150k) is reasonable based on typical stale-listing flexibility.
- 3 sale attempts; this cycle's ask has dropped $23k (12%) from the opening price — seller is motivated, your offer sets the floor, not the list.
- Current owner paid $33k; list at $170k implies a 415% gain — meaningful room to come down on a strong offer.
Risks & watch-outs
- Watch-outs: built in 1956 — expect roof / HVAC / electrical / plumbing capex.
Questions for the listing agent
- It's been on market 221 days. Have you received any prior offers? Is the seller open to a 13% concession, seller financing, or rate buy-down credit?
- Built in 1956 — when were the roof, HVAC, electrical panel, plumbing, and water heater last replaced?
- Why hasn't it sold? Are there any deal-killer items the seller is aware of (foundation, flood, title, zoning, code violations)?
- Is there a deadline driving the sale (1031 exchange, divorce, estate, relocation)? That informs how much negotiation room exists.
- Schools are F-rated, which usually means shorter tenancies and higher turnover. Who's the typical renter profile here, and what's been the actual vacancy rate?
- Crime grade is F in this area — have there been break-ins, vandalism, or insurance claims at this property in the last 3 years? What carrier currently insures it and at what premium?
- The area grade is low — what's the realistic commute time and amenity access for the typical tenant pool here? Any planned neighborhood developments (good or bad) we should know about?
- What's the average days-on-market for RENTAL listings here right now (not sales)? A rising rental-DOM trend means longer vacancies and softer asking-rent achievability than the comps imply.
- What's the recent tenant-quality profile in this submarket — average credit score on applications, eviction rate, late-payment / NSF rate, and stable-employment percentage? A property-management company in the area should have these aggregated.
- How much new for-sale + rental construction is in the pipeline within 1–3 miles? Heavy new supply typically softens prices + rents 12–24 months out; constrained supply supports both.
Investment metrics
- 1% rule
- 0.87% ✗
- Cap rate
- 6.72%
- Cash-on-cash
- 1.53%
- DSCR
- 1.07
- GRM
- 9.5
CMA / ARV
- ARV (on-the-fly)
- $197,640
- Comps found
- 12
Show comp detail 12 sales within ~0.75 mi
| Address | Dist | Beds/Ba | Sqft | Sold | Price | $/sf | Match |
|---|---|---|---|---|---|---|---|
| 22021 Rosemary St | 0.20mi | 3/1.0 | 980 (-9%) | 1mo | $210,000 | $214 | 74 |
| 9223 Roosevelt St | 0.07mi | 3/2.0 | 1,200 (+11%) | 4mo | $219,000 | $183 | 71 |
| 8910 Mason St | 0.50mi | 3/1.0 | 1,053 (-2%) | 5mo | $145,000 | $138 | 69 |
| 20812 Wick Rd | 0.63mi | 3/1.0 | 1,100 (+2%) | 3mo | $155,000 | $141 | 65 |
| 8003 Roosevelt St | 0.59mi | 3/1.0 | 1,029 (-5%) | 1mo | $195,000 | $190 | 64 |
| 8248 Birch St | 0.64mi | 3/1.0 | 1,123 (+4%) | 0mo | $181,900 | $162 | 63 |
| 8339 Birch St | 0.58mi | 3/1.0 | 994 (-8%) | 1mo | $142,000 | $143 | 59 |
| 9360 Pine St | 0.70mi | 3/1.0 | 1,036 (-4%) | 2mo | $140,000 | $135 | 59 |
| 9942 Lincoln St | 0.50mi | 3/1.0 | 980 (-9%) | 3mo | $205,000 | $209 | 58 |
| 9255 Syracuse St | 0.71mi | 3/1.0 | 1,036 (-4%) | 4mo | $169,000 | $163 | 57 |
| 8019 Roosevelt St | 0.58mi | 3/1.0 | 957 (-11%) | 3mo | $175,100 | $183 | 52 |
| 22324 Wohlfeil St | 0.45mi | 2/2.0 (-1) | 948 (-12%) | 5mo | $190,000 | $200 | 46 |
Match score weights: distance 35% · size 25% · config 20% · recency 20%. Top-matched comps best support the ARV.
Projected returns pro-forma
-3.0% appreciation · 4.9% rent growth · sell at horizon
- IRR
- -11.9%
- Equity multiple
- 0.56×
- Total profit
- $-20,803
- Equity at exit
- $25,333
- IRR
- -0.2%
- Equity multiple
- 0.98×
- Total profit
- $-877
- Equity at exit
- $14,690
Cash invested: $47,572 (down + closing). Projections, not guarantees.
Landlord ↔ Tenant lean methodology
- Overall (STATE)
- 62 Landlord-Friendly
- State Michigan
- 62 Landlord-Friendly · EVEN
- County
- — inherits STATE
- City
- — inherits STATE
ZIP-level market 48180
- Rents YoY
- 4.9%
- Active inventory
- 281
- Price-to-rent
- 9.5×
Monthly cashflow live
- Estimated rent
- $1,485 high interval (Pro) →
- Mortgage (P&I)
- −$891
- Tax from tax record
- −$151 /mo · $1,813/yr
- Insurance
- −$71
- HOA
- −$0
- Vacancy / Maint / Mgmt
- −$312
- Net cashflow
- $60
Break-even live
UW: 25.0% down · 7.5% · 30yr · 1.5% tax · 5.0% vac · 8.0% maint · 8.0% mgmt
Financing live
Cash to close
- Down payment
- $42,475
- Closing costs
- $5,097
- Reserves months
- —
- Total cash needed
- —
Loan-product check · same deal, 3 products live
Conventional
25% down · 7.5% · 30yr
- Down + closing
- —
- Monthly P&I
- —
- Monthly cashflow
- —
- DSCR
- —
- Eligible?
- —
Personal DTI + credit; lowest rate.
DSCR
20% down · 8.5% · 30yr
- Down + closing
- —
- Monthly P&I
- —
- Monthly cashflow
- —
- DSCR
- —
- Eligible?
- —
No personal income docs; deal must DSCR.
Hard money
10% down · 12.0% · 12mo
- Down + closing
- —
- Monthly P&I
- —
- Monthly cashflow
- —
- DSCR
- —
- Eligible?
- —
Short-term bridge; refi at stabilization.
Rent comps 7 comps
| Address | Beds | Baths | Sqft | Rent | $/sqft | DOM | Units | Dist |
|---|---|---|---|---|---|---|---|---|
| 9620 Elm St Taylor, MI | 2.0 | 1.0 | 800 | $1,470 | $1.84 | 1d | 3 | 0.62mi |
| 23060 Bernard St Taylor, MI | 2.0 | 1.0 | 836 | $1,400 | $1.67 | 1d | 1 | 0.94mi |
| 7873 Syracuse St Taylor, MI | 2.0 | 1.0 | 728 | $1,400 | $1.92 | 43d | 1 | 0.96mi |
| 24268 Haskell St Taylor, MI | 1.0–2.0 | 1.0 | 880 | $1,565 | $1.78 | 1d | 8 | 1.11mi |
| 9918 Allen Pointe Dr Allen Park, MI | 1.0–2.0 | 1.0–2.0 | 678 | $1,125 | $1.66 | 12d | 1 | 1.22mi |
| 10019 Allen Pointe Dr Allen Park, MI | 2.0 | 1.5 | 796 | $1,055 | $1.33 | 12d | 1 | 1.26mi |
| 11312 Elm St Taylor, MI | 2.0 | 1.0 | 830 | $1,125 | $1.36 | 43d | 1 | 1.40mi |
Listing history 15 events
-
2026-04-06status Pending 364-char remark
Show marketing remark (364 chars)
* * ESTATE SALE * * 3 BEDROOM BUNGALOW IN PRIME TAYLOR AREA. 1 1/2 CAR GARAGE WITH ELECTRICITY. FULL PARTIALLY FINISHED BASEMENT. BIG BACKYARD FOR ENTERTAINMENT. NEWER F/A C/A ROOF. PURCHASER TO ASSUME ALL REPAIRS FOR CERTIFICATE OF OCCUPANCY. FURTHER DETAILS IN AGENT REMARKS. EASY SHOWINGS. BATVAI. LICENSED REALTORS PRESENT AT ALL SHOWINGS. NO VIRTUAL TOURS,
-
2026-04-06status Pending
Show marketing remark (364 chars)
* * ESTATE SALE * * 3 BEDROOM BUNGALOW IN PRIME TAYLOR AREA. 1 1/2 CAR GARAGE WITH ELECTRICITY. FULL PARTIALLY FINISHED BASEMENT. BIG BACKYARD FOR ENTERTAINMENT. NEWER F/A C/A ROOF. PURCHASER TO ASSUME ALL REPAIRS FOR CERTIFICATE OF OCCUPANCY. FURTHER DETAILS IN AGENT REMARKS. EASY SHOWINGS. BATVAI. LICENSED REALTORS PRESENT AT ALL SHOWINGS. NO VIRTUAL TOURS,
-
2026-03-01status Active 364-char remark
Show marketing remark (364 chars)
* * ESTATE SALE * * 3 BEDROOM BUNGALOW IN PRIME TAYLOR AREA. 1 1/2 CAR GARAGE WITH ELECTRICITY. FULL PARTIALLY FINISHED BASEMENT. BIG BACKYARD FOR ENTERTAINMENT. NEWER F/A C/A ROOF. PURCHASER TO ASSUME ALL REPAIRS FOR CERTIFICATE OF OCCUPANCY. FURTHER DETAILS IN AGENT REMARKS. EASY SHOWINGS. BATVAI. LICENSED REALTORS PRESENT AT ALL SHOWINGS. NO VIRTUAL TOURS,
-
2026-03-01historical 364-char remark
Show marketing remark (364 chars)
* * ESTATE SALE * * 3 BEDROOM BUNGALOW IN PRIME TAYLOR AREA. 1 1/2 CAR GARAGE WITH ELECTRICITY. FULL PARTIALLY FINISHED BASEMENT. BIG BACKYARD FOR ENTERTAINMENT. NEWER F/A C/A ROOF. PURCHASER TO ASSUME ALL REPAIRS FOR CERTIFICATE OF OCCUPANCY. FURTHER DETAILS IN AGENT REMARKS. EASY SHOWINGS. BATVAI. LICENSED REALTORS PRESENT AT ALL SHOWINGS. NO VIRTUAL TOURS,
-
2026-02-18price $169,900 364-char remark
Show marketing remark (364 chars)
* * ESTATE SALE * * 3 BEDROOM BUNGALOW IN PRIME TAYLOR AREA. 1 1/2 CAR GARAGE WITH ELECTRICITY. FULL PARTIALLY FINISHED BASEMENT. BIG BACKYARD FOR ENTERTAINMENT. NEWER F/A C/A ROOF. PURCHASER TO ASSUME ALL REPAIRS FOR CERTIFICATE OF OCCUPANCY. FURTHER DETAILS IN AGENT REMARKS. EASY SHOWINGS. BATVAI. LICENSED REALTORS PRESENT AT ALL SHOWINGS. NO VIRTUAL TOURS,
-
2026-02-17price $169,900
-
2026-01-16price $175,000 364-char remark
Show marketing remark (364 chars)
* * ESTATE SALE * * 3 BEDROOM BUNGALOW IN PRIME TAYLOR AREA. 1 1/2 CAR GARAGE WITH ELECTRICITY. FULL PARTIALLY FINISHED BASEMENT. BIG BACKYARD FOR ENTERTAINMENT. NEWER F/A C/A ROOF. PURCHASER TO ASSUME ALL REPAIRS FOR CERTIFICATE OF OCCUPANCY. FURTHER DETAILS IN AGENT REMARKS. EASY SHOWINGS. BATVAI. LICENSED REALTORS PRESENT AT ALL SHOWINGS. NO VIRTUAL TOURS,
-
2026-01-15price $175,000
-
2025-11-21price $179,900 364-char remark
Show marketing remark (364 chars)
* * ESTATE SALE * * 3 BEDROOM BUNGALOW IN PRIME TAYLOR AREA. 1 1/2 CAR GARAGE WITH ELECTRICITY. FULL PARTIALLY FINISHED BASEMENT. BIG BACKYARD FOR ENTERTAINMENT. NEWER F/A C/A ROOF. PURCHASER TO ASSUME ALL REPAIRS FOR CERTIFICATE OF OCCUPANCY. FURTHER DETAILS IN AGENT REMARKS. EASY SHOWINGS. BATVAI. LICENSED REALTORS PRESENT AT ALL SHOWINGS. NO VIRTUAL TOURS,
-
2025-11-20price $179,900
-
2025-10-13price $185,000 364-char remark
Show marketing remark (364 chars)
* * ESTATE SALE * * 3 BEDROOM BUNGALOW IN PRIME TAYLOR AREA. 1 1/2 CAR GARAGE WITH ELECTRICITY. FULL PARTIALLY FINISHED BASEMENT. BIG BACKYARD FOR ENTERTAINMENT. NEWER F/A C/A ROOF. PURCHASER TO ASSUME ALL REPAIRS FOR CERTIFICATE OF OCCUPANCY. FURTHER DETAILS IN AGENT REMARKS. EASY SHOWINGS. BATVAI. LICENSED REALTORS PRESENT AT ALL SHOWINGS. NO VIRTUAL TOURS,
-
2025-10-12price $185,000
-
2025-08-28$192,500 Active 364-char remark
Show marketing remark (364 chars)
* * ESTATE SALE * * 3 BEDROOM BUNGALOW IN PRIME TAYLOR AREA. 1 1/2 CAR GARAGE WITH ELECTRICITY. FULL PARTIALLY FINISHED BASEMENT. BIG BACKYARD FOR ENTERTAINMENT. NEWER F/A C/A ROOF. PURCHASER TO ASSUME ALL REPAIRS FOR CERTIFICATE OF OCCUPANCY. FURTHER DETAILS IN AGENT REMARKS. EASY SHOWINGS. BATVAI. LICENSED REALTORS PRESENT AT ALL SHOWINGS. NO VIRTUAL TOURS,
-
2025-08-28$192,500 Active
Show marketing remark (364 chars)
* * ESTATE SALE * * 3 BEDROOM BUNGALOW IN PRIME TAYLOR AREA. 1 1/2 CAR GARAGE WITH ELECTRICITY. FULL PARTIALLY FINISHED BASEMENT. BIG BACKYARD FOR ENTERTAINMENT. NEWER F/A C/A ROOF. PURCHASER TO ASSUME ALL REPAIRS FOR CERTIFICATE OF OCCUPANCY. FURTHER DETAILS IN AGENT REMARKS. EASY SHOWINGS. BATVAI. LICENSED REALTORS PRESENT AT ALL SHOWINGS. NO VIRTUAL TOURS,
-
1991-09-10soldstatus $33,000
ⓘ Source: listings_history table (triggers on properties + properties_extension) + one-shot
backfill from property_details.listing_events for pre-trigger history.
Tax reassessment forecast MI · Partial reset (capped growth)
- Current annual tax
- $1,813 · $151/mo
- Projected year-2 tax
- $2,215 · $185/mo
- Expected delta
- +$402/yr (+$33/mo · 22.1%)
ⓘ Screening estimate from a state-policy table — verify with the county assessor before closing.
Nearby sold comps map
Loading sold comps map…
Walkable amenities ~0.75 mi
Loading nearby amenities…
Taxation est. · year 1
- Rental income
- $17,823
- − Mortgage interest
- −$9,517
- − Property taxes
- −$1,813
- − Insurance
- −$850
- − Repairs & maintenance
- −$1,426
- − Management
- −$1,426
- − Depreciation
- −$4,943
- Taxable loss
- −$2,151
- Est. tax savings @ 24.0%
- +$516
- After-tax cash flow
- $1,242/yr
For passive investors: Depreciation is non-cash, so a rental often shows a tax loss while cash-flowing — sheltering income. Rental losses are passive: they offset passive income freely, and up to $25,000/yr can offset ordinary (W-2) income if you actively participate and your MAGI is under $100k (phasing out to $0 by $150k); unused losses carry forward. On sale, claimed depreciation is recaptured at up to 25%, and gains may owe capital-gains tax (a 1031 exchange can defer both). Figures are a year-1 estimate at your 24.0% rate — not tax advice; consult a CPA.
Schools (NCES district)
- District
- Taylor School District
- NCES district ID
- 2633540
- Math proficiency
- 14% ▼ -7.00%
- Reading proficiency
- 27% ▼ -4.00%
- Median HH income
- $43,062
- Composite
- 17.62/100
- National rank
- #9034
- State rank
- #462 of 540 in MI
Livability — Taylor
- Score
- 76/100
- State rank
- #144
- US rank
- #3684
Category grades
Schools grade is shown separately in the Schools card above.
Census & demographics
- Census place
- Taylor, MI
- County
- Wayne County · 1,562,939 people
- City population
- 62,081
- Metro
- Detroit-Warren-Dearborn, MI
- Population (ZIP)
- 62,081
- Household income
- $61,081
- Rent vs Own
- Severe rent burden
- 1957.0
Population outlook (Wayne County) Hauer SSP2
- Today (2025)
- 1,675,273 people
- By 2030
- 1,620,300 · -3.3%
- By 2040
- 1,502,341 · -10.3%
- By 2050
- 1,384,039 · -17.4%
- By 2075
- 1,124,592 · -32.9%
- By 2100
- 881,193 · -47.4%
Race, ethnicity, and origin ACS 2023
- Neighborhood character
- Majority White (65%)
- Race & ethnicity
- White 65% Black 19% Two or more races 9% Hispanic / Latino 9% Asian 2%
- Hispanic origin (detail)
- Mexican 6% Puerto Rican 2%
- Common ancestry
- Romanian 8% Lithuanian 3% Slovak 2%
- Foreign-born
- 7% · Canada
- Languages at home
- 89% English-only · Spanish 4% Arabic 3% Other Indo-European 3%
Political lean MEDSL · Wayne
- 2024 margin
- Strong D (+29.0) · D 62.7% · R 33.7% · Other 3.6%
- 2008→2024 swing
- -20.5pp toward R · 2008: 49.5pp · 2024: 29.0pp
- All cycles
- 2024: D+29.0 2020: D+38.1 2016: D+37.3 2012: D+46.9 2008: D+49.5
Not yet ingested
- Civics
- —
Market trends
- HPI YoY
- ▼ -212.33%
- Current HPI
- 228.921
- Rent YoY
- ▲ 4.90%
- Metro
- Detroit-Warren-Dearborn, MI
- State GDP YoY
- ▲ 1.37%
- F500 in state
- 28
Industry mix (Fortune 500 HQ in MI)
| Industry | F500 HQs | Revenue |
|---|---|---|
| Automotive Parts | 3 | $48B |
|
||
| Automotive | 2 | $372B |
|
||
| Chemicals | 1 | $45B |
|
||
| Automotive Retail | 1 | $29B |
|
||
| Healthcare / Medical Devices | 1 | $23B |
|
||
| Automotive Technology | 1 | $20B |
|
||
Price history
+414.8% since first listed15 events — show timeline
- 2026-04-06 Pending — MiRealSource-MiMLS
- 2026-04-06 Pending — REALCOMP
- 2026-03-01 Relisted — MiRealSource-MiMLS
- 2026-03-01 Listing Removed — MiRealSource-MiMLS
- 2026-02-18 Price Changed $169,900 MiRealSource-MiMLS
- 2026-02-17 Price Changed $169,900 REALCOMP
- 2026-01-16 Price Changed $175,000 MiRealSource-MiMLS
- 2026-01-15 Price Changed $175,000 REALCOMP
- 2025-11-21 Price Changed $179,900 MiRealSource-MiMLS
- 2025-11-20 Price Changed $179,900 REALCOMP
- 2025-10-13 Price Changed $185,000 MiRealSource-MiMLS
- 2025-10-12 Price Changed $185,000 REALCOMP
- 2025-08-28 Listed $192,500 REALCOMP
- 2025-08-28 Listed $192,500 MiRealSource-MiMLS
- 1991-09-10 Sold (Public Records) $33,000 Public Records
Property tax history
+0.4%/yrLatest (2025): $1,813 · -11.6% YoY. Source: county tax records.
Cash-flow waterfall
monthlySold comps — $/sqft
last 12 mo · ≤1 miLoading sold comps…