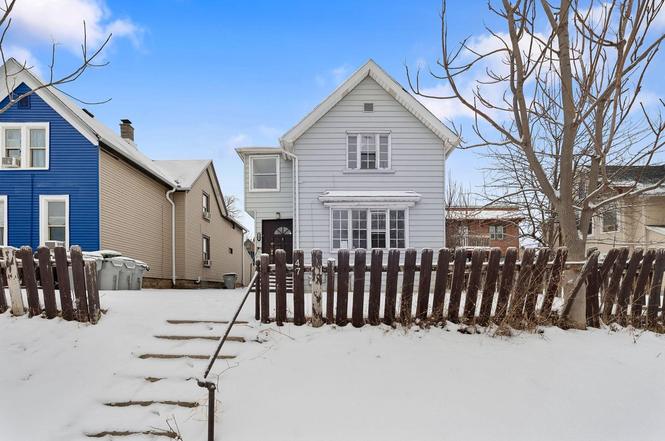
747 S 23rd St · Milwaukee, WI
Flood risk 1/10 · Minimal
- FEMA flood zone
- X (unshaded)
- Chance of flooding over 30 yrs
- 0.0%
- Est. flood insurance / yr
- $507 – $1,088
Fire risk 1/10 · Minimal
- Est. fire insurance / yr
- $636 – $1,182
Heat risk 2/10 · Minimal
- Hot days now (above 97°F)
- 7 days/yr
- Hot days in 30 yrs
- 13 days/yr
Wind risk 2/10 · Minimal
- Chance of severe wind over 30 yrs
- —
Air-quality risk 3/10 · Minor
- Unhealthy air days now
- 3 days/yr
- Unhealthy air days in 30 yrs
- 3 days/yr
Risk factors via First Street. Map © Google.
Why this score? — see what drove the D grade
The composite is a weighted blend of 9 inputs, each scored 0–100. Each bar is that input's sub-score; the figure is the points it added to the 100-point composite (weight × sub-score).
- Appreciation +10.0/10.0
- Cash flow +7.9/30.0
- ARV discount +7.5/15.0
- 1% rule +4.9/10.0
- Livability +4.0/5.0
- Rent growth +3.0/5.0
- Condition / age +2.5/5.0
- DSCR +2.0/10.0
- Schools +1.2/10.0
$179,900
🖨 Deal sheet (PDF) 📄 Offer letter ✓ Due diligence
Listing remarks MLS
Beautifully updated 4- family. New roof in 2019, and painted in 2019. Units updated during vacancies. All tenants MTM. Great tenants and nice property. 2 tenants have been long term so cash flow is slightly below market.
Key facts
- Water heater
- Newer windows
- 4 unit building
Tags
Property features AI
Finance
- Other: 4 units in the building
Exterior
- Parking: Outdoor parking; Indoor parking available; Outside spaces
- Utilities: Municipal water; Municipal sewer; Natural gas
- Home design: Multi-family property; Duplex+ building type; 1-2 stories
- Construction: Wood construction
- Exterior features: Wood exterior; Lot under 1/2 acre; 0.1 acre lot; Zoned RT4
Interior
- Heating & cooling: Forced air heating; Central air conditioning; Natural gas heat
- Interior features: Full basement with laundry facilities; Central air; Forced air heating
- Laundry & utility: Laundry facilities in basement
Neighborhood map
What this means for you Summary
Snapshot
- This is a 3-bed/1.0-bath other listed at $180k.
Deal economics
- At list price, monthly cash flow is $-191 ($-2k/yr) — negative.
- To cash-flow at today's rent, offer at most $146k (18.8% below list).
- To meet the 1% rule (rent ≥ 1% of price), the offer needs to be $179k (0.6% below list).
- Recommended offer: $146k (18.8% below list) — sets the bar for cash-flow.
Location & tenants
- Location reads 81/100 on livability (#55 in WI, #1,534 nationally) — a professional / high-income tenant draw. Strengths: amenities A+, commute A+, cost of living A+; Watch: employment D+, schools F, crime F.
- Milwaukee School District (urban): math 10% / reading 18% proficiency, ranked #337 of 342 in WI (top 98%) — low school quality limits family demand, transient renter base, plan for 1-2y turnover; 77% free/reduced lunch — lower-income household profile, screen leases tightly.
- Market conditions: Rents rising (+2.0%/yr); 56 active listings in the ZIP; 1 comparable units currently listed for rent nearby; 1,017 units permitted in Milwaukee County in 2024 (803 in 5+ unit buildings).
- At $1,788/mo this rent would consume 47% of the median local household income ($46k/yr) (locally 2357% of renters already pay >50% of income on rent) — very limited rent-growth headroom before tenants either downsize or default.
Forward outlook
- In year one you build about $19k of equity ($1k loan paydown + $18k appreciation (10.0% local appreciation)).
- Milwaukee County population projected at +4% by 2050 — modest demand growth; plan on rents tracking national, not racing it.
- By year 2, paydown + projected appreciation supports a ~$31k cash-out refi (75% LTV) — recoverable capital for the next deal without selling this one.
Negotiation context
- It's been on market 94 days — a 9% lower offer ($164k) is reasonable based on typical stale-listing flexibility.
- 12 sale attempts since 13y ago; this cycle's ask has dropped $20k (10%) from the opening price — seller is motivated, your offer sets the floor, not the list.
Risks & watch-outs
- Watch-outs: property tax is 3.9% of price; built in 1892 — expect roof / HVAC / electrical / plumbing capex.
Questions for the listing agent
- What do current leases actually rent for vs. the listed asking? Can we see a recent rent roll and the last 12 months of T-12 income?
- It's been on market 94 days. Have you received any prior offers? Is the seller open to a 19% concession, seller financing, or rate buy-down credit?
- Built in 1892 — when were the roof, HVAC, electrical panel, plumbing, and water heater last replaced?
- Property tax is high relative to price — has the assessment been appealed recently, and will the sale trigger a re-assessment?
- Why hasn't it sold? Are there any deal-killer items the seller is aware of (foundation, flood, title, zoning, code violations)?
- Is there a deadline driving the sale (1031 exchange, divorce, estate, relocation)? That informs how much negotiation room exists.
- Schools are F-rated, which usually means shorter tenancies and higher turnover. Who's the typical renter profile here, and what's been the actual vacancy rate?
- Crime grade is F in this area — have there been break-ins, vandalism, or insurance claims at this property in the last 3 years? What carrier currently insures it and at what premium?
- The area grade is low — what's the realistic commute time and amenity access for the typical tenant pool here? Any planned neighborhood developments (good or bad) we should know about?
- What's the average days-on-market for RENTAL listings here right now (not sales)? A rising rental-DOM trend means longer vacancies and softer asking-rent achievability than the comps imply.
- What's the recent tenant-quality profile in this submarket — average credit score on applications, eviction rate, late-payment / NSF rate, and stable-employment percentage? A property-management company in the area should have these aggregated.
- How much new for-sale + rental construction is in the pipeline within 1–3 miles? Heavy new supply typically softens prices + rents 12–24 months out; constrained supply supports both.
Investment metrics
- 1% rule
- 0.99% ✗
- Cap rate
- 5.02%
- Cash-on-cash
- -4.56%
- DSCR
- 0.80
- GRM
- 8.4
CMA / ARV
No comps found within radius.
Projected returns pro-forma
10.0% appreciation · 2.0% rent growth · sell at horizon
- IRR
- 20.7%
- Equity multiple
- 2.67×
- Total profit
- $84,266
- Equity at exit
- $162,068
- IRR
- 18.6%
- Equity multiple
- 6.06×
- Total profit
- $254,752
- Equity at exit
- $349,506
Cash invested: $50,372 (down + closing). Projections, not guarantees.
Landlord ↔ Tenant lean methodology
- Overall (STATE)
- 73 Landlord-Friendly
- State Wisconsin
- 73 Landlord-Friendly · R+2
- County
- — inherits STATE
- City
- — inherits STATE
ZIP-level market 53204
- Home prices YoY
- 19.0%
- Rents YoY
- 2.0%
- Active inventory
- 56
- Price-to-rent
- 8.4×
Monthly cashflow live
- Estimated rent
- $1,788 medium interval (Pro) →
- Mortgage (P&I)
- −$943
- Tax from tax record
- −$586 /mo · $7,028/yr
- Insurance
- −$75
- HOA
- −$0
- Vacancy / Maint / Mgmt
- −$376
- Net cashflow
- $-191
Break-even live
Sensitivity live
| Price | -10% $-89 | -5% $-140 | +0% $-191 | +5% $-242 | +10% $-293 |
|---|---|---|---|---|---|
| Rent | -10% $-333 | -5% $-262 | +0% $-191 | +5% $-121 | +10% $-50 |
| Rate | -1.0pp $-101 | -0.5pp $-145 | base $-191 | +0.5pp $-238 | +1.0pp $-285 |
UW: 25.0% down · 7.5% · 30yr · 1.5% tax · 5.0% vac · 8.0% maint · 8.0% mgmt
Financing live
Cash to close
- Down payment
- $44,975
- Closing costs
- $5,397
- Reserves months
- —
- Total cash needed
- —
Loan-product check · same deal, 3 products live
Conventional
25% down · 7.5% · 30yr
- Down + closing
- —
- Monthly P&I
- —
- Monthly cashflow
- —
- DSCR
- —
- Eligible?
- —
Personal DTI + credit; lowest rate.
DSCR
20% down · 8.5% · 30yr
- Down + closing
- —
- Monthly P&I
- —
- Monthly cashflow
- —
- DSCR
- —
- Eligible?
- —
No personal income docs; deal must DSCR.
Hard money
10% down · 12.0% · 12mo
- Down + closing
- —
- Monthly P&I
- —
- Monthly cashflow
- —
- DSCR
- —
- Eligible?
- —
Short-term bridge; refi at stabilization.
Rent comps 1 comps
| Address | Beds | Baths | Sqft | Rent | $/sqft | DOM | Units | Dist |
|---|---|---|---|---|---|---|---|---|
| 1812 S 7th St Milwaukee, WI | 3.0 | 1.5 | 1703 | $2,100 | $1.23 | 25d | 1 | 1.41mi |
Listing history 36 events
-
2026-05-01status Pending
-
2026-04-30historical Contingent
-
2026-04-28price $179,900
-
2026-03-25price $189,900
-
2026-03-04status Active
-
2026-02-06historical Contingent
-
2026-01-27$199,900 Active
-
2025-08-12soldstatus $338,310
-
2023-05-08status Pending 220-char remark
Show marketing remark (220 chars)
Beautifully updated 4- family. New roof in 2019, and painted in 2019. Units updated during vacancies. All tenants MTM. Great tenants and nice property. 2 tenants have been long term so cash flow is slightly below market.
-
2023-05-08historical 220-char remark
Show marketing remark (220 chars)
Beautifully updated 4- family. New roof in 2019, and painted in 2019. Units updated during vacancies. All tenants MTM. Great tenants and nice property. 2 tenants have been long term so cash flow is slightly below market.
-
2023-05-06historical 220-char remark
Show marketing remark (220 chars)
Beautifully updated 4- family. New roof in 2019, and painted in 2019. Units updated during vacancies. All tenants MTM. Great tenants and nice property. 2 tenants have been long term so cash flow is slightly below market.
-
2023-05-05$159,900 Active 220-char remark
Show marketing remark (220 chars)
Beautifully updated 4- family. New roof in 2019, and painted in 2019. Units updated during vacancies. All tenants MTM. Great tenants and nice property. 2 tenants have been long term so cash flow is slightly below market.
-
2023-04-23historical Contingent 220-char remark
Show marketing remark (220 chars)
Beautifully updated 4- family. New roof in 2019, and painted in 2019. Units updated during vacancies. All tenants MTM. Great tenants and nice property. 2 tenants have been long term so cash flow is slightly below market.
-
2023-04-17historical
-
2023-04-15status Active
Show marketing remark (220 chars)
Beautifully updated 4- family. New roof in 2019, and painted in 2019. Units updated during vacancies. All tenants MTM. Great tenants and nice property. 2 tenants have been long term so cash flow is slightly below market.
-
2023-04-15$159,900 Active 220-char remark
Show marketing remark (220 chars)
Beautifully updated 4- family. New roof in 2019, and painted in 2019. Units updated during vacancies. All tenants MTM. Great tenants and nice property. 2 tenants have been long term so cash flow is slightly below market.
-
2023-03-17historical Contingent
-
2023-03-03$159,900 Active
-
2019-10-01historical
-
2019-08-14price $119,900
-
2019-07-18$124,000 Active
-
2017-08-23$109,900 Active
-
2017-08-18soldstatus $101,500 Sold
-
2015-05-22historical
-
2015-04-02status Contingent
-
2015-03-24soldstatus $25,000 Sold
-
2015-02-27status Pending
-
2015-02-27$30,000 Active
-
2015-02-20historical
-
2015-01-06$94,900 Active
-
2013-10-02historical
-
2013-10-02$65,000
-
2009-12-31soldstatus $57,500
-
2009-12-04soldstatus $57,500
-
1996-12-16soldstatus $29,000
-
1996-11-01soldstatus $29,000
ⓘ Source: listings_history table (triggers on properties + properties_extension) + one-shot
backfill from property_details.listing_events for pre-trigger history.
Tax reassessment forecast WI · Partial reset (capped growth)
- Current annual tax
- $7,028 · $586/mo
- Projected year-2 tax
- $7,028 · $586/mo
- Expected delta
- $0/yr ($0/mo · 0.0%)
ⓘ Screening estimate from a state-policy table — verify with the county assessor before closing.
Climate risk First Street
- Flood 1/10 Low FEMA zone X (unshaded) · 0% chance over 30 yrs
- Wildfire 1/10 Low
- Heat 2/10 Low 7 d/yr ≥97°F today · 13 d/yr by 30 yrs out
- Wind 2/10 Low
- Air quality 3/10 Moderate 3 unhealthy d/yr today · 3 by 30 yrs out
Nearby sold comps map
Loading sold comps map…
Walkable amenities ~0.75 mi
Loading nearby amenities…
Taxation est. · year 1
- Rental income
- $21,461
- − Mortgage interest
- −$10,077
- − Property taxes
- −$7,028
- − Insurance
- −$900
- − Repairs & maintenance
- −$1,717
- − Management
- −$1,717
- − Depreciation
- −$5,233
- Taxable loss
- −$5,211
- Est. tax savings @ 24.0%
- +$1,251
- After-tax cash flow
- $-1,044/yr
For passive investors: Depreciation is non-cash, so a rental often shows a tax loss while cash-flowing — sheltering income. Rental losses are passive: they offset passive income freely, and up to $25,000/yr can offset ordinary (W-2) income if you actively participate and your MAGI is under $100k (phasing out to $0 by $150k); unused losses carry forward. On sale, claimed depreciation is recaptured at up to 25%, and gains may owe capital-gains tax (a 1031 exchange can defer both). Figures are a year-1 estimate at your 24.0% rate — not tax advice; consult a CPA.
Schools (NCES district)
- District
- Milwaukee School District
- NCES district ID
- 5509600
- Math proficiency
- 10% ▼ -5.00%
- Reading proficiency
- 18% ▬ 0.00%
- Median HH income
- $36,339
- Composite
- 11.61/100
- National rank
- #9696
- State rank
- #337 of 342 in WI
Livability — Milwaukee
- Score
- 81/100
- State rank
- #55
- US rank
- #1534
Category grades
Schools grade is shown separately in the Schools card above.
Census & demographics
- Census place
- Milwaukee, WI
- County
- Milwaukee County · 926,379 people
- City population
- 573,768
- Metro
- Milwaukee-Waukesha, WI
- Population (ZIP)
- 39,996
- Household income
- $45,934
- Rent vs Own
- Severe rent burden
- 2357.0
Population outlook (Milwaukee County) Hauer SSP2
- Today (2025)
- 995,758 people
- By 2030
- 1,009,124 · +1.3%
- By 2040
- 1,028,128 · +3.3%
- By 2050
- 1,040,066 · +4.4%
- By 2075
- 1,057,849 · +6.2%
- By 2100
- 1,039,774 · +4.4%
Race, ethnicity, and origin ACS 2023
- Neighborhood character
- Predominantly Hispanic (68%)
- Race & ethnicity
- Hispanic / Latino 68% Two or more races 35% White 15% Black 11% Asian 3% Native American 1%
- Hispanic origin (detail)
- Mexican 51% Puerto Rican 13%
- Common ancestry
- Romanian 3% Portuguese 1% Lithuanian 1%
- Foreign-born
- 28% · Canada
- Languages at home
- 35% English-only · Spanish 61% Other Asian/Pacific 1%
Political lean MEDSL · Milwaukee
- 2024 margin
- Solid D (+38.5) · D 68.3% · R 29.8% · Other 1.8%
- 2008→2024 swing
- +2.7pp toward D · 2008: 35.9pp · 2024: 38.5pp
- All cycles
- 2024: D+38.5 2020: D+39.9 2016: D+37.5 2012: D+34.6 2008: D+35.9
Not yet ingested
- Civics
- —
Market trends
- HPI YoY
- ▲ 64.27%
- Current HPI
- 403.236
- Rent YoY
- ▲ 2.00%
- Metro
- Milwaukee-Waukesha, WI
- State GDP YoY
- ▲ 2.10%
- F500 in state
- 20
Industry mix (Fortune 500 HQ in WI)
| Industry | F500 HQs | Revenue |
|---|---|---|
| Industrial Machinery | 4 | $23B |
|
||
| Industrial Technology | 2 | $36B |
|
||
| Insurance | 1 | $36B |
|
||
| Professional Services | 1 | $19B |
|
||
| Utilities | 1 | $9B |
|
||
| Consumer Goods | 1 | $3B |
|
||
Price history
+520.3% since first listed36 events — show timeline
- 2026-05-01 Pending — METROMLS
- 2026-04-30 Contingent — METROMLS
- 2026-04-28 Price Changed $179,900 METROMLS
- 2026-03-25 Price Changed $189,900 METROMLS
- 2026-03-04 Relisted — METROMLS
- 2026-02-06 Contingent — METROMLS
- 2026-01-27 Listed $199,900 METROMLS
- 2025-08-12 Sold (Public Records) $338,310 Public Records
- 2023-05-08 Pending — METROMLS
- 2023-05-08 Listing Removed — METROMLS
- 2023-05-06 Listing Removed — METROMLS
- 2023-05-05 Listed $159,900 METROMLS
- 2023-04-23 Contingent — METROMLS
- 2023-04-17 Listing Removed — METROMLS
- 2023-04-15 Relisted — METROMLS
- 2023-04-15 Listed $159,900 METROMLS
- 2023-03-17 Contingent — METROMLS
- 2023-03-03 Listed $159,900 METROMLS
- 2019-10-01 Listing Removed — METROMLS
- 2019-08-14 Price Changed $119,900 METROMLS
- 2019-07-18 Listed $124,000 METROMLS
- 2017-08-23 Listed $109,900 METROMLS
- 2017-08-18 Sold (MLS) $101,500 METROMLS
- 2015-05-22 Listing Removed — METROMLS
- 2015-04-02 Relisted — METROMLS
- 2015-03-24 Sold (MLS) $25,000 METROMLS
- 2015-02-27 Pending — METROMLS
- 2015-02-27 Listed $30,000 METROMLS
- 2015-02-20 Listing Removed — METROMLS
- 2015-01-06 Listed $94,900 METROMLS
- 2013-10-02 Listed $65,000 METROMLS
- 2013-10-02 Listing Removed — METROMLS
- 2009-12-31 Sold (Public Records) $57,500 Public Records
- 2009-12-04 Sold (MLS) $57,500 METROMLS
- 1996-12-16 Sold (Public Records) $29,000 Public Records
- 1996-11-01 Sold (Public Records) $29,000 Public Records
Property tax history
+13.5%/yrLatest (2024): $7,028 · +15.7% YoY. Source: county tax records.
Cash-flow waterfall
monthlySold comps — $/sqft
last 12 mo · ≤1 miLoading sold comps…