2607 Ohio St · Paducah, KY
Flood risk 1/10 · Minimal
- FEMA flood zone
- X (unshaded)
- Chance of flooding over 30 yrs
- 0.0%
- Est. flood insurance / yr
- $507 – $1,088
Fire risk 1/10 · Minimal
- Est. fire insurance / yr
- $839 – $1,559
Heat risk 6/10 · Moderate
- Hot days now (above 108°F)
- 7 days/yr
- Hot days in 30 yrs
- 20 days/yr
Wind risk 3/10 · Minor
- Chance of severe wind over 30 yrs
- 6.0%
Air-quality risk 3/10 · Minor
- Unhealthy air days now
- 1 days/yr
- Unhealthy air days in 30 yrs
- 4 days/yr
Risk factors via First Street. Map © Google.
Why this score? — see what drove the B+ grade
The composite is a weighted blend of 9 inputs, each scored 0–100. Each bar is that input's sub-score; the figure is the points it added to the 100-point composite (weight × sub-score).
- Cash flow +30.0/30.0
- ARV discount +15.0/15.0
- 1% rule +10.0/10.0
- DSCR +10.0/10.0
- Livability +3.4/5.0
- Rent growth +2.5/5.0
- Condition / age +2.5/5.0
- Schools +2.3/10.0
- Appreciation +0.0/10.0
$59,900
🖨 Deal sheet (PDF) 📄 Offer letter ✓ Due diligence
Listing remarks MLS
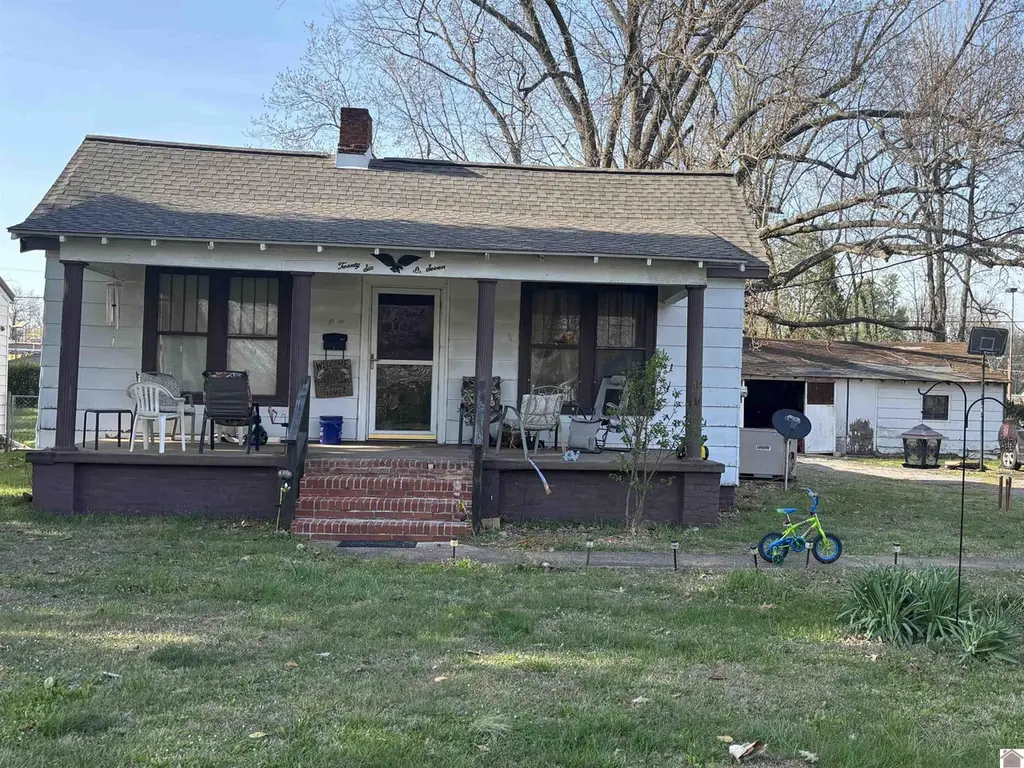
Charming 1925 home full of character and opportunity! Situated on a large lot , this property features a detached garage and timeless architectural details throughout. Inside, you'll find high ceilings, a cozy gas log fireplace, and beautiful original wood floors that add warmth and charm to the living spaces. This home offers great potential for investors or handy homeowners looking to restore and customize. While it boasts solid bones and classic appeal, it does need some TLC, including flooring work in the kitchen, and ceiling work in one of the bedrooms. Being sold AS IS, this property is a fantastic opportunity to bring your vision to life and build equity. Conveniently located near schools, shopping, dining, parks, and entertainment, this home combines location, character, and potential-all at an attractive value. Don't miss a chance to transform this hidden gem into something truly special.
Key facts
- Classic appeal
- Original wood floors
- Detached garage
Tags
Neighborhood map
What this means for you Summary
Snapshot
- This is a 2-bed/1.0-bath single-family listed at $60k.
Deal economics
- At list price, monthly cash flow is $302 ($4k/yr) — positive.
- The deal already cash-flows at list — no discount required.
- Meets the 1% rule at list price ($906 rent vs $60k).
- Recommended offer: $55k (9.0% below list) — sets the bar for market timing.
- Cap rate 12.3% vs local median 4.5% in Paducah — top-decile yield for the area; either an underpriced asset or a hidden risk that comps aren't pricing in. Stress-test before assuming the spread holds.
Location & tenants
- Location reads 68/100 on livability (#197 in KY) — a middle-class / working-renter tenant base. Strengths: cost of living A+, housing A+, health & safety A+; Watch: crime C-, employment D, amenities F.
- Paducah Independent (town): math 22% / reading 36% proficiency, ranked #122 of 165 in KY (top 74%) — low school quality limits family demand, transient renter base, plan for 1-2y turnover; 69% free/reduced lunch — lower-income household profile, screen leases tightly.
- Zoned schools: Morgan Elementary School (math 17% / reading 22%, grade F, #572 of 676 statewide, top 88%, 380 students, 89% FRL); Paducah Middle School (math 19% / reading 36%, grade F, #168 of 217 statewide, top 78%, 652 students, 69% FRL); Paducah Tilghman High School (math 22% / reading 42%, grade F, #97 of 254 statewide, top 46%, 878 students, 64% FRL) — zoned schools at 74% FRL track the district average.
- Market conditions: 269 active listings in the ZIP; 6 comparable units currently listed for rent nearby; rentals lingering (median 46d on market — plan ~5-8 weeks vacancy on turnover, expect pricing pressure); 100% of comp listings sitting > 30 days — soft ceiling on asking rent; 187 units permitted in McCracken County in 2024 (104 in 5+ unit buildings).
Forward outlook
- Local home prices are declining (-3.0%/yr); year-one equity from $414 of loan paydown is wiped out by about $2k of value loss. Plan a longer hold.
- McCracken County population projected to shrink 9% by 2050 — rents likely to lag national; underwrite the cash flow, not the appreciation.
- At projected returns (-3.0% appreciation + 3.0% rent growth), your $17k cash investment doubles in ~6 years — after that, you're playing with house money.
Negotiation context
- It's been on market 92 days — a 9% lower offer ($55k) is reasonable based on typical stale-listing flexibility.
- Current owner paid $16k; list at $60k implies a 263% gain — meaningful room to come down on a strong offer.
Risks & watch-outs
- Watch-outs: built in 1925 — expect roof / HVAC / electrical / plumbing capex.
- Climate carrying-cost: extreme-heat days projected 7→20/yr by 2055 (HVAC capex compounding) — expect insurance premiums to compound above CPI over the hold.
Questions for the listing agent
- It's been on market 92 days. Have you received any prior offers? Is the seller open to a 9% concession, seller financing, or rate buy-down credit?
- Built in 1925 — when were the roof, HVAC, electrical panel, plumbing, and water heater last replaced?
- Why hasn't it sold? Are there any deal-killer items the seller is aware of (foundation, flood, title, zoning, code violations)?
- Is there a deadline driving the sale (1031 exchange, divorce, estate, relocation)? That informs how much negotiation room exists.
- Schools are D-rated, which usually means shorter tenancies and higher turnover. Who's the typical renter profile here, and what's been the actual vacancy rate?
- What's the average days-on-market for RENTAL listings here right now (not sales)? A rising rental-DOM trend means longer vacancies and softer asking-rent achievability than the comps imply.
- What's the recent tenant-quality profile in this submarket — average credit score on applications, eviction rate, late-payment / NSF rate, and stable-employment percentage? A property-management company in the area should have these aggregated.
- How much new for-sale + rental construction is in the pipeline within 1–3 miles? Heavy new supply typically softens prices + rents 12–24 months out; constrained supply supports both.
Investment metrics
- 1% rule
- 1.51% ✓
- Cap rate
- 12.34%
- Cash-on-cash
- 21.59%
- DSCR
- 1.96
- GRM
- 5.5
CMA / ARV
- ARV (median comp)
- $105,344
- List price
- $59,900
- Delta
- -43.14%
- Verdict
- UNDERPRICED
- Comps
- 20 within 1.0 mi
Show comp detail 12 sales within ~0.75 mi
| Address | Dist | Beds/Ba | Sqft | Sold | Price | $/sf | Match |
|---|---|---|---|---|---|---|---|
| 2328 Center St | 0.35mi | 3/1.0 (+1) | 960 (-2%) | 4mo | $158,000 | $165 | 72 |
| 2332 Center St | 0.34mi | 3/1.0 (+1) | 960 (-2%) | 7mo | $128,400 | $134 | 70 |
| 2827 Cornell St | 0.59mi | 2/1.0 | 994 (+1%) | 0mo | $144,500 | $145 | 70 |
| 2909 Clark St | 0.40mi | 3/1.5 (+1) | 1,018 (+4%) | 2mo | $180,000 | $177 | 67 |
| 3019 Mississippi St | 0.59mi | 2/1.0 | 918 (-6%) | 3mo | $150,000 | $163 | 59 |
| 2600 Monroe St | 0.61mi | 2/1.0 | 899 (-8%) | 4mo | $127,500 | $142 | 54 |
| 3001 Georgia St | 0.63mi | 2/1.0 | 900 (-8%) | 7mo | $54,000 | $60 | 51 |
| 3017 Georgia St | 0.65mi | 2/1.0 | 888 (-10%) | 4mo | $70,000 | $79 | 51 |
| 926 S 21st St | 0.60mi | 2/1.0 | 1,102 (+12%) | 4mo | $79,000 | $72 | 48 |
| 2936 Cornell St | 0.68mi | 3/1.0 (+1) | 1,080 (+10%) | 5mo | $94,000 | $87 | 42 |
| 2403 Monroe St | 0.67mi | 2/1.0 | 1,118 (+14%) | 6mo | $162,500 | $145 | 40 |
| 2707 Madison St | 0.72mi | 3/1.0 (+1) | 864 (-12%) | 6mo | $130,000 | $150 | 36 |
Match score weights: distance 35% · size 25% · config 20% · recency 20%. Top-matched comps best support the ARV.
Projected returns pro-forma
-3.0% appreciation · 3.0% rent growth · sell at horizon
- IRR
- 14.2%
- Equity multiple
- 1.57×
- Total profit
- $9,522
- Equity at exit
- $8,931
- IRR
- 23.0%
- Equity multiple
- 2.97×
- Total profit
- $33,089
- Equity at exit
- $5,179
Cash invested: $16,772 (down + closing). Projections, not guarantees.
Landlord ↔ Tenant lean methodology
- Overall (STATE)
- 83 Strongly Landlord-Friendly
- State Kentucky
- 83 Strongly Landlord-Friendly · R+16
- County
- — inherits STATE
- City
- — inherits STATE
ZIP-level market 42003
- Home prices YoY
- -19.8%
- Active inventory
- 269
- Price-to-rent
- 5.5×
Monthly cashflow live
- Estimated rent
- $906 high interval (Pro) →
- Mortgage (P&I)
- −$314
- Tax est. 1.5%
- −$75 /mo · $898/yr
- Insurance
- −$25
- HOA
- −$0
- Vacancy / Maint / Mgmt
- −$190
- Net cashflow
- $302
Break-even live
Sensitivity live
| Price | -10% $343 | -5% $322 | +0% $302 | +5% $281 | +10% $260 |
|---|---|---|---|---|---|
| Rent | -10% $230 | -5% $266 | +0% $302 | +5% $337 | +10% $373 |
| Rate | -1.0pp $332 | -0.5pp $317 | base $302 | +0.5pp $286 | +1.0pp $270 |
UW: 25.0% down · 7.5% · 30yr · 1.5% tax · 5.0% vac · 8.0% maint · 8.0% mgmt
Financing live
Cash to close
- Down payment
- $14,975
- Closing costs
- $1,797
- Reserves months
- —
- Total cash needed
- —
Loan-product check · same deal, 3 products live
Conventional
25% down · 7.5% · 30yr
- Down + closing
- —
- Monthly P&I
- —
- Monthly cashflow
- —
- DSCR
- —
- Eligible?
- —
Personal DTI + credit; lowest rate.
DSCR
20% down · 8.5% · 30yr
- Down + closing
- —
- Monthly P&I
- —
- Monthly cashflow
- —
- DSCR
- —
- Eligible?
- —
No personal income docs; deal must DSCR.
Hard money
10% down · 12.0% · 12mo
- Down + closing
- —
- Monthly P&I
- —
- Monthly cashflow
- —
- DSCR
- —
- Eligible?
- —
Short-term bridge; refi at stabilization.
Rent comps 6 comps
| Address | Beds | Baths | Sqft | Rent | $/sqft | DOM | Units | Dist |
|---|---|---|---|---|---|---|---|---|
| 922 S 27th St Unit A Paducah, KY | 2.0 | 1.0 | 600 | $875 | $1.46 | 46d | 1 | 0.21mi |
| 1900 Jefferson St Paducah, KY | 2.0 | 1.0 | 800 | $1,400 | $1.75 | 46d | 1 | 0.78mi |
| 2967 Harrison St Paducah, KY | 1.0–2.0 | 1.0 | 725 | $915 | $1.26 | 46d | 1 | 0.90mi |
| 710 Lone Oak Rd Paducah, KY | 2.0 | 1.0 | 620 | $799 | $1.29 | 46d | 1 | 0.91mi |
| 2991 Clay St Unit 06 Paducah, KY | 2.0 | 1.0 | 974 | $715 | $0.73 | 46d | 1 | 0.96mi |
| 2741 Trimble St Unit 27195 Paducah, KY | 2.0 | 1.0 | 850 | $725 | $0.85 | 46d | 1 | 0.98mi |
Listing history 20 events
-
2026-06-22days on market $59,900 Active 92 DOM
-
2026-06-21days on market $59,900 Active 91 DOM
-
2026-06-19days on market $59,900 Active 89 DOM
-
2026-06-18days on market $59,900 Active 88 DOM
-
2026-06-17days on market $59,900 Active 87 DOM
-
2026-06-16days on market $59,900 Active 86 DOM
-
2026-06-15days on market $59,900 Active 85 DOM
-
2026-06-14days on market $59,900 Active 83 DOM
-
2026-06-12days on market $59,900 Active 82 DOM
-
2026-06-09days on market $59,900 Active 79 DOM
-
2026-06-08days on market $59,900 Active 78 DOM
-
2026-06-07days on market $59,900 Active 77 DOM
-
2026-06-03days on market $59,900 Active 73 DOM
-
2026-06-02days on market $59,900 Active 72 DOM
-
2026-06-01days on market $59,900 Active 71 DOM
-
2026-05-31days on market $59,900 Active 70 DOM
-
2026-05-30days on market $59,900 Active 69 DOM
-
2026-04-15price $59,900 910-char remark
Show marketing remark (910 chars)
Charming 1925 home full of character and opportunity! Situated on a large lot , this property features a detached garage and timeless architectural details throughout. Inside, you'll find high ceilings, a cozy gas log fireplace, and beautiful original wood floors that add warmth and charm to the living spaces. This home offers great potential for investors or handy homeowners looking to restore and customize. While it boasts solid bones and classic appeal, it does need some TLC, including flooring work in the kitchen, and ceiling work in one of the bedrooms. Being sold AS IS, this property is a fantastic opportunity to bring your vision to life and build equity. Conveniently located near schools, shopping, dining, parks, and entertainment, this home combines location, character, and potential-all at an attractive value. Don't miss a chance to transform this hidden gem into something truly special.
-
2026-03-20$69,900 Active 910-char remark
Show marketing remark (910 chars)
Charming 1925 home full of character and opportunity! Situated on a large lot , this property features a detached garage and timeless architectural details throughout. Inside, you'll find high ceilings, a cozy gas log fireplace, and beautiful original wood floors that add warmth and charm to the living spaces. This home offers great potential for investors or handy homeowners looking to restore and customize. While it boasts solid bones and classic appeal, it does need some TLC, including flooring work in the kitchen, and ceiling work in one of the bedrooms. Being sold AS IS, this property is a fantastic opportunity to bring your vision to life and build equity. Conveniently located near schools, shopping, dining, parks, and entertainment, this home combines location, character, and potential-all at an attractive value. Don't miss a chance to transform this hidden gem into something truly special.
-
1995-06-01soldstatus $16,500
ⓘ Source: listings_history table (triggers on properties + properties_extension) + one-shot
backfill from property_details.listing_events for pre-trigger history.
Climate risk First Street
- Flood 1/10 Low FEMA zone X (unshaded) · 0% chance over 30 yrs
- Wildfire 1/10 Low
- Heat 6/10 Major 7 d/yr ≥108°F today · 20 d/yr by 30 yrs out
- Wind 3/10 Moderate 6% chance of damaging wind over 30 yrs
- Air quality 3/10 Moderate 1 unhealthy d/yr today · 4 by 30 yrs out
Nearby sold comps map
Loading sold comps map…
Walkable amenities ~0.75 mi
Loading nearby amenities…
Taxation est. · year 1
- Rental income
- $10,871
- − Mortgage interest
- −$3,355
- − Property taxes
- −$898
- − Insurance
- −$300
- − Repairs & maintenance
- −$870
- − Management
- −$870
- − Depreciation
- −$1,743
- Taxable income
- $2,835
- Est. tax owed @ 24.0%
- −$680
- After-tax cash flow
- $2,940/yr
For passive investors: Depreciation is non-cash, so a rental often shows a tax loss while cash-flowing — sheltering income. Rental losses are passive: they offset passive income freely, and up to $25,000/yr can offset ordinary (W-2) income if you actively participate and your MAGI is under $100k (phasing out to $0 by $150k); unused losses carry forward. On sale, claimed depreciation is recaptured at up to 25%, and gains may owe capital-gains tax (a 1031 exchange can defer both). Figures are a year-1 estimate at your 24.0% rate — not tax advice; consult a CPA.
Schools (NCES district)
- District
- Paducah Independent
- NCES district ID
- 2104650
- Math proficiency
- 22% ▼ -14.00%
- Reading proficiency
- 36% ▼ -17.00%
- Median HH income
- $30,067
- Composite
- 23.41/100
- National rank
- #7896
- State rank
- #122 of 165 in KY
Livability — Paducah
- Score
- 68/100
- State rank
- #197
- US rank
- #9780
Category grades
Schools grade is shown separately in the Schools card above.
Census & demographics
- Census place
- Paducah, KY
- City population
- 30,856
- Population (ZIP)
- 29,384
Population outlook (McCracken County) Hauer SSP2
- Today (2025)
- 64,237 people
- By 2030
- 63,468 · -1.2%
- By 2040
- 61,221 · -4.7%
- By 2050
- 58,432 · -9.0%
- By 2075
- 52,668 · -18.0%
- By 2100
- 44,517 · -30.7%
Race, ethnicity, and origin ACS 2023
- Neighborhood character
- Predominantly White (83%)
- Race & ethnicity
- White 83% Black 9% Two or more races 5% Hispanic / Latino 4%
- Common ancestry
- Slovak 2% Lithuanian 1% Serbian 1%
- Foreign-born
- 2% · Canada
- Languages at home
- 97% English-only · Spanish 1% Other Asian/Pacific 1%
Political lean MEDSL · McCracken
- 2024 margin
- Solid R (+34.9) · D 31.9% · R 66.8% · Other 1.2%
- 2008→2024 swing
- -9.7pp toward R · 2008: -25.2pp · 2024: -34.9pp
- All cycles
- 2024: R+34.9 2020: R+31.7 2016: R+37.2 2012: R+32.5 2008: R+25.2
Not yet ingested
- Civics
- —
Market trends
- HPI YoY
- ▼ -58.31%
- Current HPI
- 236.3013
- Rent YoY
- —
- Metro
- —
- State GDP YoY
- ▲ 1.81%
- F500 in state
- 4
Industry mix (Fortune 500 HQ in KY)
| Industry | F500 HQs | Revenue |
|---|---|---|
| Healthcare | 1 | $118B |
|
||
| Food / Beverage | 1 | $7B |
|
||
Price history
+263.0% since first listed3 events — show timeline
- 2026-04-15 Price Changed $59,900 WKRMLS
- 2026-03-20 Listed $69,900 WKRMLS
- 1995-06-01 Sold (Public Records) $16,500 Public Records
Property tax history
-22.9%/yrLatest (2022): $77 · +0.6% YoY. Source: county tax records.
Cash-flow waterfall
monthlySold comps — $/sqft
last 12 mo · ≤1 miLoading sold comps…