 Multi-family
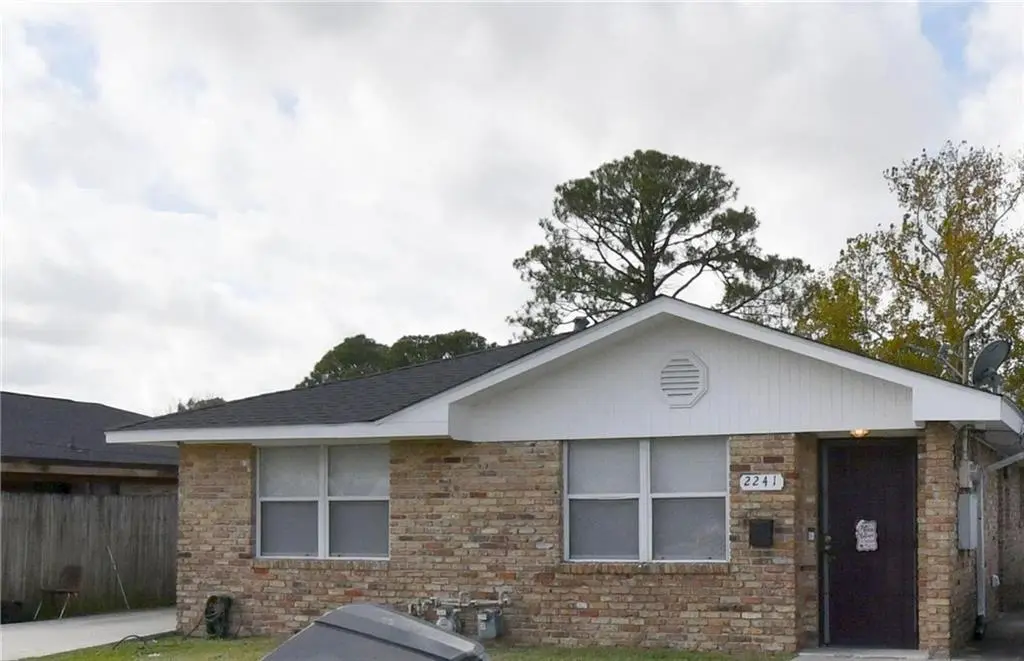
2241 43 Kraft Pl · New Orleans, LA
Flood risk 9/10 · Severe
- FEMA flood zone
- AE
- Chance of flooding over 30 yrs
- 0.76%
- Est. flood insurance / yr
- $1,737 – $8,500
Fire risk 1/10 · Minimal
- Est. fire insurance / yr
- $1,269 – $2,357
Heat risk 10/10 · Severe
- Hot days now (above 108°F)
- 7 days/yr
- Hot days in 30 yrs
- 21 days/yr
Wind risk 10/10 · Severe
- Chance of severe wind over 30 yrs
- 99.0%
Air-quality risk 2/10 · Minimal
- Unhealthy air days now
- 2 days/yr
- Unhealthy air days in 30 yrs
- 2 days/yr
Risk factors via First Street. Map © Google.
Why this score? — see what drove the B- grade
The composite is a weighted blend of 9 inputs, each scored 0–100. Each bar is that input's sub-score; the figure is the points it added to the 100-point composite (weight × sub-score).
- Cash flow +30.0/30.0
- DSCR +10.0/10.0
- 1% rule +8.6/10.0
- ARV discount +7.5/15.0
- Livability +4.0/5.0
- Condition / age +2.5/5.0
- Rent growth +2.3/5.0
- Schools +1.6/10.0
- Appreciation +0.0/10.0
$205,000
🖨 Deal sheet 📄 Offer letter ✓ Due diligence
Multi-family units
County records classify this as Multi-Family (2-4 Unit). Listing-text estimate: 1 unit. estimate disagrees with records
Listing remarks MLS
Investors. Take advantage of the opportunity to own this property situated in a quiet established neighborhood with long term tenants. This property has been well maintained. It is conveniently located in an area that has easy access to businesses, major interstates and the vibrant entertainment scene of New Orleans. The consistent stream of income makes it an ideal addition to any investment portfolio. Furnished photos are of 2241 & vacant photos are of 2243 which is vacant until June 23rd 2026. Separate meters. Tenants pay their own utilities.
Key facts
- Major interstates
- Well maintained
- Parking
Tags
Property features AI
Exterior
- Parking: Driveway
- Utilities: Public water; Public sewer
- Home design: Single-story; Brick construction; Asphalt shingle roof; Slab foundation
- Construction: Built with brick exterior
- Exterior features: Fenced yard; City lot; Rectangular lot; Lot dimensions approximately 55 x 92/93
Interior
- Bedrooms:
- Bathrooms: 2 full bathrooms
- Heating & cooling: Central heating; Central air conditioning
- Interior features: Very good condition
- Laundry & utility: Indoor laundry
Neighborhood map
What this means for you Summary
Snapshot
- This is a 2-bed/2.0-bath multifamily listed at $205k.
Deal economics
- At list price, monthly cash flow is $479 ($6k/yr) — positive.
- The deal already cash-flows at list — no discount required.
- Meets the 1% rule at list price ($3k rent vs $205k).
- Recommended offer: $202k (1.5% below list) — sets the bar for market timing.
- Cap rate 11.6% vs local median 4.4% in New Orleans — top-decile yield for the area; either an underpriced asset or a hidden risk that comps aren't pricing in. Stress-test before assuming the spread holds.
Location & tenants
- Location reads 81/100 on livability (#3 in LA, #1,383 nationally) — a professional / high-income tenant draw. Strengths: amenities A+, commute A+, health & safety A+; Watch: crime C-, employment D.
- Orleans Parish (urban): math 11% / reading 27% proficiency, ranked #69 of 98 in LA (top 70%) — low school quality limits family demand, transient renter base, plan for 1-2y turnover; 68% free/reduced lunch — lower-income household profile, screen leases tightly.
- Market conditions: Rents soft (-0.7%/yr); 265 active listings in the ZIP; 32 comparable units currently listed for rent nearby; rentals at typical pace (median 24d on market — plan ~3-4 weeks tenant-placement turnaround); lower-income renter base — watch delinquency; 710 units permitted in Orleans Parish in 2024 (244 in 5+ unit buildings).
- At $2,787/mo this rent would consume 77% of the median local household income ($43k/yr) (locally 2240% of renters already pay >50% of income on rent) — very limited rent-growth headroom before tenants either downsize or default.
Forward outlook
- Local home prices are declining (-3.0%/yr); year-one equity from $1k of loan paydown is wiped out by about $6k of value loss. Plan a longer hold.
- Orleans County population projected at +61% by 2050 — long-run rental-demand tailwind backs the buy-and-hold thesis.
Negotiation context
- It's been on market 22 days — a 2% lower offer ($202k) is reasonable based on typical stale-listing flexibility.
- 6 sale attempts since 32y ago with the ask held roughly flat each time — persistent listings suggest the price (not the market) is what's stuck; bring a comps-based counter.
- Current owner paid $160k; 28% above their basis — modest negotiation headroom, anchor on the comps not their cost.
Risks & watch-outs
- Watch-outs: flood insurance adds $427/mo.
- Climate carrying-cost: in FEMA flood zone AE (mandatory federal flood insurance); severe wind risk, 99% chance of damaging wind over 30y; extreme-heat days projected 7→21/yr by 2055 (HVAC capex compounding) — expect insurance premiums to compound above CPI over the hold.
Questions for the listing agent
- Built in 1969 — when were the roof, HVAC, electrical panel, plumbing, and water heater last replaced?
- What's the actual annual flood-insurance premium (NFIP or private), and is the property in a SFHA with mandatory coverage?
- Is there a deadline driving the sale (1031 exchange, divorce, estate, relocation)? That informs how much negotiation room exists.
- What's the average days-on-market for RENTAL listings here right now (not sales)? A rising rental-DOM trend means longer vacancies and softer asking-rent achievability than the comps imply.
- What's the recent tenant-quality profile in this submarket — average credit score on applications, eviction rate, late-payment / NSF rate, and stable-employment percentage? A property-management company in the area should have these aggregated.
- How much new apartment / multifamily construction is in the pipeline within 1–3 miles? Heavy new supply (>2% of stock underway) typically softens rents 12–24 months out; light construction supports rent growth.
Investment metrics
- 1% rule
- 1.36% ✓
- Cap rate
- 11.59%
- Cash-on-cash
- 18.92%
- DSCR
- 1.84
- GRM
- 6.1
CMA / ARV
No comps found within radius.
Projected returns pro-forma
-3.0% appreciation · 0.0% rent growth · sell at horizon
- IRR
- -5.2%
- Equity multiple
- 0.81×
- Total profit
- $-10,671
- Equity at exit
- $30,566
- IRR
- -0.2%
- Equity multiple
- 0.99×
- Total profit
- $-666
- Equity at exit
- $17,725
Cash invested: $57,400 (down + closing). Projections, not guarantees.
Landlord ↔ Tenant lean methodology
- Overall (STATE)
- 90 Strongly Landlord-Friendly
- State Louisiana
- 90 Strongly Landlord-Friendly · R+12
- County
- — inherits STATE
- City
- — inherits STATE
ZIP-level market 70114
- Rents YoY
- -0.7%
- Active inventory
- 265
- Price-to-rent
- 12.3×
Monthly cashflow live
- Estimated rent
- $2,787 high interval (Pro) →
- Mortgage (P&I)
- −$1,075
- Tax from tax record
- −$136 /mo · $1,633/yr
- Insurance
- −$85
- Flood insurance flood zone
- −$427 /mo · $5,118/yr
- HOA
- −$0
- Vacancy / Maint / Mgmt
- −$585
- Net cashflow
- $479
Break-even live
2-unit breakdown (identical units grouped — click to expand)
| Units | Beds | Baths | Est. rent |
|---|---|---|---|
| 2× units | 2 | 1 | $2,788 |
| #1 | 2 | 1 | $1,394 |
| #2 | 2 | 1 | $1,394 |
| Total (2 units) | $2,787 | ||
UW: 25.0% down · 7.5% · 30yr · 1.5% tax · 5.0% vac · 8.0% maint · 8.0% mgmt
Financing live
Cash to close
- Down payment
- $51,250
- Closing costs
- $6,150
- Reserves months
- —
- Total cash needed
- —
Loan-product check · same deal, 3 products live
Conventional
25% down · 7.5% · 30yr
- Down + closing
- —
- Monthly P&I
- —
- Monthly cashflow
- —
- DSCR
- —
- Eligible?
- —
Personal DTI + credit; lowest rate.
DSCR
20% down · 8.5% · 30yr
- Down + closing
- —
- Monthly P&I
- —
- Monthly cashflow
- —
- DSCR
- —
- Eligible?
- —
No personal income docs; deal must DSCR.
Hard money
10% down · 12.0% · 12mo
- Down + closing
- —
- Monthly P&I
- —
- Monthly cashflow
- —
- DSCR
- —
- Eligible?
- —
Short-term bridge; refi at stabilization.
Rent comps 32 comps
| Address | Beds | Baths | Sqft | Rent | $/sqft | DOM | Units | Dist |
|---|---|---|---|---|---|---|---|---|
| 1719 Pace Blvd New Orleans, LA | 3.0 | 1.0 | 1178 | $2,000 | $1.70 | 11d | 1 | 0.42mi |
| 3000 Americus St New Orleans, LA | 3.0 | 2.0 | 1280 | $1,400 | $1.09 | 23d | 1 | 0.59mi |
| 1402 Behrman Ave New Orleans, LA | 2.0 | 1.0 | 1673 | $1,500 | $0.90 | 23d | 1 | 0.61mi |
| 1414 Sumner St New Orleans, LA | 3.0 | 2.0 | 1800 | $1,450 | $0.81 | 15d | 1 | 0.62mi |
| 1622 Jo Ann Pl New Orleans, LA | 3.0 | 1.5 | 1301 | $1,500 | $1.15 | 1d | 1 | 0.64mi |
| 1565 Murl St Unit B New Orleans, LA | 2.0 | 2.0 | 1100 | $1,100 | $1.00 | 23d | 1 | 0.72mi |
| 1010 Isbell St Gretna, LA | 3.0 | 1.0 | 1300 | $1,350 | $1.04 | 43d | 1 | 0.76mi |
| 1108 Sumner St New Orleans, LA | 3.0 | 1.5 | 1197 | $1,500 | $1.25 | 11d | 1 | 0.83mi |
| 21 Carriage Ln New Orleans, LA | 3.0 | 2.5 | 1900 | $2,000 | $1.05 | 21d | 1 | 0.87mi |
| 718 Majestic Pl New Orleans, LA | 3.0 | 2.0 | 1164 | $1,785 | $1.53 | 21d | 1 | 0.99mi |
| 513 Park Blvd New Orleans, LA | 3.0 | 2.0 | 1600 | $2,300 | $1.44 | 3d | 1 | 1.08mi |
| 3725 Macarthur Blvd Unit 2A New Orleans, LA | 2.0 | 2.0 | 1200 | $2,750 | $2.29 | 19d | 1 | 1.10mi |
| 913 Milton St Gretna, LA | 3.0 | 1.0 | 1061 | $2,800 | $2.64 | 43d | 1 | 1.10mi |
| 1318 Monroe St Gretna, LA | 2.0 | 1.0 | 1200 | $1,595 | $1.33 | 2d | 1 | 1.10mi |
| 701 Behrman Ave New Orleans, LA | 3.0 | 2.0 | 1368 | $2,300 | $1.68 | 3d | 1 | 1.12mi |
| 807 Whitney Ave Unit 1 New Orleans, LA | 3.0 | 2.0 | 1262 | $1,500 | $1.19 | 3d | 1 | 1.12mi |
| 300 Terry Pkwy Unit C Terrytown, LA | 3.0 | 2.5 | 1532 | $1,800 | $1.17 | 23d | 1 | 1.16mi |
| 241 Helen St Unit 4D Terrytown, LA | 2.0 | 1.5 | 1383 | $1,400 | $1.01 | 43d | 1 | 1.24mi |
| 241 Helen St Unit 3c Terrytown, LA | 2.0 | 1.5 | 1383 | $1,400 | $1.01 | 21d | 1 | 1.24mi |
| 606 Drum St New Orleans, LA | 3.0 | 2.0 | 1131 | $2,350 | $2.08 | 23d | 1 | 1.25mi |
| 2123 Browning Ln Terrytown, LA | 3.0 | 1.5 | 1073 | $1,650 | $1.54 | 2d | 1 | 1.28mi |
| 310 Coral Ave Gretna, LA | 3.0 | 1.5 | 1216 | $1,750 | $1.44 | 23d | 1 | 1.30mi |
| 1140 Teche St Apt B New Orleans, LA | 3.0 | 1.0 | 1100 | $1,850 | $1.68 | 23d | 1 | 1.34mi |
| 721 Hinyub Ave Unit D Gretna, LA | 2.0 | 1.5 | 1200 | $1,250 | $1.04 | 43d | 1 | 1.34mi |
| 507 Newton St New Orleans, LA | 2.0 | 2.0 | 1150 | $1,400 | $1.22 | 23d | 1 | 1.36mi |
| 543 Atlantic Ave New Orleans, LA | 2.0 | 2.5 | 1430 | $2,200 | $1.54 | 23d | 1 | 1.40mi |
| 349 Cherry Blossom Ln Terrytown, LA | 3.0 | 1.5 | 1225 | $1,600 | $1.31 | 23d | 1 | 1.40mi |
| 14 Gelbke Dr Gretna, LA | 3.0 | 2.0 | 1327 | $1,800 | $1.36 | 23d | 1 | 1.41mi |
| 14 Gelbke Dr Gretna, LA | 3.0 | 2.0 | 1327 | $1,950 | $1.47 | 43d | 1 | 1.41mi |
| 527 Atlantic Ave New Orleans, LA | 3.0 | 2.0 | 1800 | $2,050 | $1.14 | 23d | 1 | 1.42mi |
| 335 Whitney Ave New Orleans, LA | 2.0 | 1.0 | 1100 | $1,575 | $1.43 | 23d | 1 | 1.44mi |
| 423 E Butterfly Cir Terrytown, LA | 3.0 | 1.5 | 1189 | $1,500 | $1.26 | 23d | 1 | 1.47mi |
Listing history 27 events
-
2026-06-18days on market $205,000 Active 22 DOM
-
2026-06-17days on market $205,000 Active 21 DOM
-
2026-06-16days on market $205,000 Active 20 DOM
-
2026-06-15days on market $205,000 Active 19 DOM
-
2026-06-13days on market $205,000 Active 17 DOM
-
2026-06-10days on market $205,000 Active 14 DOM
-
2026-06-09days on market $205,000 Active 13 DOM
-
2026-06-08days on market $205,000 Active 12 DOM
-
2026-06-07days on market $205,000 Active 11 DOM
-
2026-06-05days on market $205,000 Active 8 DOM
-
2026-06-03days on market $205,000 Active 7 DOM
-
2026-06-02days on market $205,000 Active 6 DOM
-
2026-06-01days on market $205,000 Active 5 DOM
-
2026-05-31days on market $205,000 Active 4 DOM
-
2026-05-27$205,000 Active
Show marketing remark (555 chars)
Investors. Take advantage of the opportunity to own this property situated in a quiet established neighborhood with long term tenants. This property has been well maintained. It is conveniently located in an area that has easy access to businesses, major interstates and the vibrant entertainment scene of New Orleans. The consistent stream of income makes it an ideal addition to any investment portfolio. Furnished photos are of 2241 & vacant photos are of 2243 which is vacant until June 23rd 2026. Separate meters. Tenants pay their own utilities.
-
2026-05-27$205,000 Active 555-char remark
Show marketing remark (555 chars)
Investors. Take advantage of the opportunity to own this property situated in a quiet established neighborhood with long term tenants. This property has been well maintained. It is conveniently located in an area that has easy access to businesses, major interstates and the vibrant entertainment scene of New Orleans. The consistent stream of income makes it an ideal addition to any investment portfolio. Furnished photos are of 2241 & vacant photos are of 2243 which is vacant until June 23rd 2026. Separate meters. Tenants pay their own utilities.
-
2024-01-22soldstatus $160,000
-
2024-01-16soldstatus $160,000 Closed
-
2023-11-23historical Active Under Contract
-
2023-11-14$160,000 964-char remark
Show marketing remark (964 chars)
Investors, seize this exceptional multi-family opportunity. Situated in a quiet, established neighborhood, this property features a new roof, an immense amount of yard space, and resilient tile floors throughout. It has been meticulously maintained by the owner, ensuring its excellent condition and minimizing maintenance hassles for prospective buyers. Convenience is key with easy access to businesses and major interstates, streamlining commutes and enhancing accessibility for both tenants and owner alike. Furthermore, the property's proximity to the vibrant entertainment scene of New Orleans adds a desirable allure for future tenants. Enjoy the peace of mind that comes with owning a property with long-term, reliable tenants. The consistent stream of income makes it an ideal addition to any investment portfolio. NOTE: Interior images are of 2341 Kraft Place (MLS 2421622), and are used to represent the identical layouts of both sides of this property.
-
2023-11-14$160,000 Active
Show marketing remark (964 chars)
Investors, seize this exceptional multi-family opportunity. Situated in a quiet, established neighborhood, this property features a new roof, an immense amount of yard space, and resilient tile floors throughout. It has been meticulously maintained by the owner, ensuring its excellent condition and minimizing maintenance hassles for prospective buyers. Convenience is key with easy access to businesses and major interstates, streamlining commutes and enhancing accessibility for both tenants and owner alike. Furthermore, the property's proximity to the vibrant entertainment scene of New Orleans adds a desirable allure for future tenants. Enjoy the peace of mind that comes with owning a property with long-term, reliable tenants. The consistent stream of income makes it an ideal addition to any investment portfolio. NOTE: Interior images are of 2341 Kraft Place (MLS 2421622), and are used to represent the identical layouts of both sides of this property.
-
2007-09-18soldstatus $50,000
-
1994-05-11soldstatus $24,900
-
1994-05-03soldstatus $24,900
-
1994-01-31$24,900
-
1994-01-31$24,900
-
1989-04-21soldstatus $30,000
ⓘ Source: listings_history table (triggers on properties + properties_extension) + one-shot
backfill from property_details.listing_events for pre-trigger history.
Tax reassessment forecast LA · Resets to sale price
- Current annual tax
- $1,633 · $136/mo
- Projected year-2 tax
- $1,633 · $136/mo
- Expected delta
- $0/yr ($0/mo · 0.0%)
ⓘ Screening estimate from a state-policy table — verify with the county assessor before closing.
Climate risk First Street
- Flood 9/10 Extreme FEMA zone AE · 76% chance over 30 yrs
- Wildfire 1/10 Low
- Heat 10/10 Extreme 7 d/yr ≥108°F today · 21 d/yr by 30 yrs out
- Wind 10/10 Extreme 99% chance of damaging wind over 30 yrs
- Air quality 2/10 Low 2 unhealthy d/yr today · 2 by 30 yrs out
Nearby sold comps map
Loading sold comps map…
Walkable amenities ~0.75 mi
Loading nearby amenities…
Taxation est. · year 1
- Rental income
- $33,444
- − Mortgage interest
- −$11,483
- − Property taxes
- −$1,633
- − Insurance
- −$6,144
- − Repairs & maintenance
- −$2,676
- − Management
- −$2,676
- − Depreciation
- −$5,964
- Taxable income
- $2,870
- Est. tax owed @ 24.0%
- −$689
- After-tax cash flow
- $5,055/yr
For passive investors: Depreciation is non-cash, so a rental often shows a tax loss while cash-flowing — sheltering income. Rental losses are passive: they offset passive income freely, and up to $25,000/yr can offset ordinary (W-2) income if you actively participate and your MAGI is under $100k (phasing out to $0 by $150k); unused losses carry forward. On sale, claimed depreciation is recaptured at up to 25%, and gains may owe capital-gains tax (a 1031 exchange can defer both). Figures are a year-1 estimate at your 24.0% rate — not tax advice; consult a CPA.
Schools (NCES district)
- District
- Orleans Parish
- NCES district ID
- 2201170
- Math proficiency
- 11% ▼ -52.00%
- Reading proficiency
- 27% ▼ -46.00%
- Median HH income
- $37,011
- Composite
- 15.78/100
- National rank
- #9271
- State rank
- #69 of 98 in LA
Livability — New Orleans
- Score
- 81/100
- State rank
- #3
- US rank
- #1383
Category grades
Schools grade is shown separately in the Schools card above.
Census & demographics
- Census place
- New Orleans, LA
- County
- Orleans Parish · 338,817 people
- City population
- 338,817
- Metro
- New Orleans-Metairie, LA
- Population (ZIP)
- 22,659
- Household income
- $43,493
- Rent vs Own
- Severe rent burden
- 2240.0
Population outlook (Orleans County) Hauer SSP2
- Today (2025)
- 513,025 people
- By 2030
- 575,781 · +12.2%
- By 2040
- 700,174 · +36.5%
- By 2050
- 826,541 · +61.1%
- By 2075
- 1,123,374 · +119.0%
- By 2100
- 1,355,609 · +164.2%
Race, ethnicity, and origin ACS 2023
- Neighborhood character
- Predominantly Black (72%)
- Race & ethnicity
- Black 72% White 16% Hispanic / Latino 8% Two or more races 5%
- Hispanic origin (detail)
- Mexican 2% Puerto Rican 1%
- Common ancestry
- Lithuanian 3% Slovak 1% Italian 1%
- Foreign-born
- 5% · Canada
- Languages at home
- 91% English-only · Spanish 6% French/Haitian/Cajun 2% Other Indo-European 1%
Political lean MEDSL · Orleans
- 2024 margin
- Solid D (+67.0) · D 82.2% · R 15.2% · Other 2.7%
- 2008→2024 swing
- +6.7pp toward D · 2008: 60.3pp · 2024: 67.0pp
- All cycles
- 2024: D+67.0 2020: D+68.2 2016: D+66.2 2012: D+62.5 2008: D+60.3
Not yet ingested
- Civics
- —
Market trends
- HPI YoY
- ▼ -98.56%
- Current HPI
- 149.0172
- Rent YoY
- ▼ -0.72%
- Metro
- New Orleans-Metairie, LA
- State GDP YoY
- ▲ 3.29%
- F500 in state
- 10
Industry mix (Fortune 500 HQ in LA)
| Industry | F500 HQs | Revenue |
|---|---|---|
| Telecommunications | 2 | $23B |
|
||
| Utilities | 1 | $12B |
|
||
| Wholesale / Distribution | 1 | $5B |
|
||
| Advertising | 1 | $2B |
|
||
Price history
+583.3% since first listed13 events — show timeline
- 2026-05-27 Listed $205,000 AcadianaMLS
- 2026-05-27 Listed $205,000 GSREIN
- 2024-01-22 Sold (Public Records) $160,000 Public Records
- 2024-01-16 Sold (MLS) $160,000 GSREIN
- 2023-11-23 Contingent — GSREIN
- 2023-11-14 Listed $160,000 GSREIN
- 2023-11-14 Listed $160,000 AcadianaMLS
- 2007-09-18 Sold (Public Records) $50,000 Public Records
- 1994-05-11 Sold (Public Records) $24,900 Public Records
- 1994-05-03 Sold (MLS) $24,900 GSREIN
- 1994-01-31 Listed $24,900 AcadianaMLS
- 1994-01-31 Listed $24,900 GSREIN
- 1989-04-21 Sold (Public Records) $30,000 Public Records
Property tax history
-0.3%/yrLatest (2026): $1,633 · -14.1% YoY. Source: county tax records.
Cash-flow waterfall
monthlySold comps — $/sqft
last 12 mo · ≤1 miLoading sold comps…