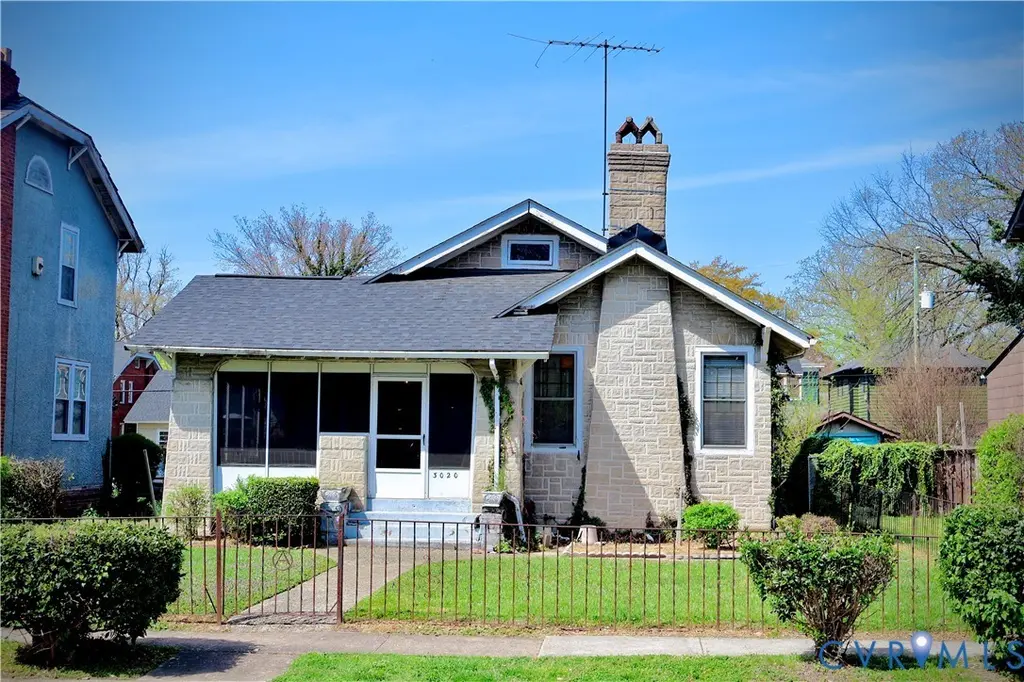
3020 Woodrow Ave · Richmond, VA
Flood risk 1/10 · Minimal
- FEMA flood zone
- X (unshaded)
- Chance of flooding over 30 yrs
- 0.0%
- Est. flood insurance / yr
- $473 – $860
Fire risk 1/10 · Minimal
- Est. fire insurance / yr
- $666 – $1,236
Heat risk 8/10 · Major
- Hot days now (above 105°F)
- 7 days/yr
- Hot days in 30 yrs
- 17 days/yr
Wind risk 6/10 · Moderate
- Chance of severe wind over 30 yrs
- 27.0%
Air-quality risk 2/10 · Minimal
- Unhealthy air days now
- 1 days/yr
- Unhealthy air days in 30 yrs
- 3 days/yr
Risk factors via First Street. Map © Google.
Why this score? — see what drove the C- grade
The composite is a weighted blend of 9 inputs, each scored 0–100. Each bar is that input's sub-score; the figure is the points it added to the 100-point composite (weight × sub-score).
- Cash flow +15.0/30.0
- ARV discount +15.0/15.0
- DSCR +4.6/10.0
- Rent growth +4.4/5.0
- Livability +4.2/5.0
- 1% rule +3.4/10.0
- Schools +3.3/10.0
- Condition / age +2.5/5.0
- Appreciation +0.0/10.0
$225,000
🖨 Deal sheet (PDF) 📄 Offer letter ✓ Due diligence
Listing remarks
Calling ALL Investors! Here's your opportunity to own/invest in the highly sought after Barton Heights. This one-level home offers great bones, a partial basement, and a detached garage. A perfect opportunity for renovation or rental potential-bring your ideas and transform this property into something special. Don't delay, make your appointment today!
Key facts
- Rental potential
- Partial basement
- Renovation potential
Tags
Property features AI
Exterior
- Parking: Detached garage; On-street parking; 1 garage space
- Utilities: Public water; Public sewer; Electric service
- Home design: Single-story; Resale property
- Construction: Brick, stone and drywall construction; Shingle roof; Partial basement
- Exterior features: Front porch; Rear porch; Screened porch
Interior
- Bedrooms: Total rooms: 5
- Flooring: Wood
- Bathrooms: One full bathroom with tub and shower (first level)
- Heating & cooling: Electric heating; Heat pump; Electric cooling
- Interior features: Wood flooring; Fireplace (gas, 1)
Neighborhood map
What this means for you Summary
Snapshot
- This is a 3-bed/1.0-bath single-family listed at $225k.
Deal economics
- At list price, monthly cash flow is $69 ($831/yr) — positive.
- The deal already cash-flows at list — no discount required.
- To meet the 1% rule (rent ≥ 1% of price), the offer needs to be $190k (15.6% below list).
- Recommended offer: $190k (15.6% below list) — sets the bar for 1% rule.
- Cap rate 6.7% vs local median 3.2% in Richmond — top-decile yield for the area; either an underpriced asset or a hidden risk that comps aren't pricing in. Stress-test before assuming the spread holds.
Location & tenants
- Location reads 84/100 on livability (#33 in VA, #793 nationally) — a professional / high-income tenant draw. Strengths: amenities A+, commute A+, health & safety A+; Watch: crime D-.
- Richmond City Public School District (urban): math 32% / reading 47% proficiency, ranked #123 of 131 in VA (top 94%) — families likely to look elsewhere, expect single-tenant / working-renter base with shorter leases; 74% free/reduced lunch — lower-income household profile, screen leases tightly.
- Zoned schools: Barack Obama Elementary (math 15% / reading 24%, grade F, #1,082 of 1,108 statewide, top 98%, 295 students, 99% FRL); Henderson Middle (math 37% / reading 54%, grade D+, #267 of 342 statewide, top 78%, 430 students, 98% FRL); John Marshall High (math 37% / reading 74%, grade C, #278 of 319 statewide, top 87%, 600 students, 113% FRL) — zoned schools average 103% FRL vs 74% district-wide (30 pts higher); higher-poverty schools than district average — tighter screening recommended.
- Market conditions: Rents rising fast (+7.4%/yr); 185 active listings in the ZIP; 39 comparable units currently listed for rent nearby; rentals at typical pace (median 26d on market — plan ~3-4 weeks tenant-placement turnaround); 2,540 units permitted in Richmond city in 2024 (2,077 in 5+ unit buildings).
- This rent runs 37% of the median local income ($61k/yr) — at the standard rent-burdened threshold; future hikes will face affordability resistance.
Forward outlook
- Local home prices are declining (-3.0%/yr); year-one equity from $2k of loan paydown is wiped out by about $7k of value loss. Plan a longer hold.
- Richmond County population projected at +40% by 2050 — long-run rental-demand tailwind backs the buy-and-hold thesis.
Negotiation context
- It's been on market 16 days — a 2% lower offer ($222k) is reasonable based on typical stale-listing flexibility.
- Current owner paid $19k; list at $225k implies a 1090% gain — meaningful room to come down on a strong offer.
Risks & watch-outs
- Watch-outs: built in 1923 — expect roof / HVAC / electrical / plumbing capex.
- Climate carrying-cost: major wind risk, 27% chance of damaging wind over 30y; extreme-heat days projected 7→17/yr by 2055 (HVAC capex compounding) — expect insurance premiums to compound above CPI over the hold.
Questions for the listing agent
- Built in 1923 — when were the roof, HVAC, electrical panel, plumbing, and water heater last replaced?
- Is there a deadline driving the sale (1031 exchange, divorce, estate, relocation)? That informs how much negotiation room exists.
- Schools are A-rated — typically a magnet for longer-tenancy family renters. What's the average tenant stay here, and is there a school-zone premium baked into asking?
- Crime grade is D in this area — have there been break-ins, vandalism, or insurance claims at this property in the last 3 years? What carrier currently insures it and at what premium?
- What's the average days-on-market for RENTAL listings here right now (not sales)? A rising rental-DOM trend means longer vacancies and softer asking-rent achievability than the comps imply.
- What's the recent tenant-quality profile in this submarket — average credit score on applications, eviction rate, late-payment / NSF rate, and stable-employment percentage? A property-management company in the area should have these aggregated.
- How much new for-sale + rental construction is in the pipeline within 1–3 miles? Heavy new supply typically softens prices + rents 12–24 months out; constrained supply supports both.
Investment metrics
- 1% rule
- 0.84% ✗
- Cap rate
- 6.66%
- Cash-on-cash
- 1.32%
- DSCR
- 1.06
- GRM
- 9.9
CMA / ARV
- ARV (on-the-fly)
- $313,470
- Comps found
- 12
Show comp detail 12 sales within ~0.75 mi
| Address | Dist | Beds/Ba | Sqft | Sold | Price | $/sf | Match |
|---|---|---|---|---|---|---|---|
| 3020 Woodrow Ave | 0.00mi | 3/1.0 | 1,290 (0%) | 1mo | $190,000 | $147 | 99 |
| 603 Arnold Ave | 0.28mi | 3/1.5 | 1,284 (-0%) | 0mo | $345,000 | $269 | 84 |
| 504 Arnold Ave | 0.20mi | 3/2.5 | 1,254 (-3%) | 2mo | $340,000 | $271 | 79 |
| 3226 Cliff Ave | 0.29mi | 3/1.0 | 1,194 (-7%) | 3mo | $156,000 | $131 | 72 |
| 611 Pollock St | 0.43mi | 2/1.0 (-1) | 1,254 (-3%) | 0mo | $280,000 | $223 | 70 |
| 3407 Garland Ave | 0.44mi | 2/1.0 (-1) | 1,242 (-4%) | 2mo | $301,500 | $243 | 66 |
| 1206 Newbury Ave | 0.52mi | 3/2.5 | 1,337 (+4%) | 1mo | $325,000 | $243 | 62 |
| 640 Overby Bend Rd | 0.60mi | 3/2.5 | 1,344 (+4%) | 2mo | $348,393 | $259 | 58 |
| 2910 3rd Ave | 0.69mi | 3/1.0 | 1,186 (-8%) | 0mo | $255,000 | $215 | 54 |
| 640 Dove St | 0.67mi | 3/2.5 | 1,344 (+4%) | 2mo | $345,000 | $257 | 54 |
| 622 Pollock St | 0.47mi | 3/1.5 | 1,122 (-13%) | 2mo | $285,000 | $254 | 53 |
| 3410 Montrose Ave | 0.71mi | 3/1.0 | 1,472 (+14%) | 1mo | $313,076 | $213 | 42 |
Match score weights: distance 35% · size 25% · config 20% · recency 20%. Top-matched comps best support the ARV.
Projected returns pro-forma
-3.0% appreciation · 7.43% rent growth · sell at horizon
- IRR
- -9.7%
- Equity multiple
- 0.63×
- Total profit
- $-23,258
- Equity at exit
- $33,548
- IRR
- 4.6%
- Equity multiple
- 1.40×
- Total profit
- $24,985
- Equity at exit
- $19,454
Cash invested: $63,000 (down + closing). Projections, not guarantees.
Landlord ↔ Tenant lean methodology
- Overall (STATE)
- 55 Moderately Landlord-Leaning
- State Virginia
- 55 Moderately Landlord-Leaning · D+2
- County
- — inherits STATE
- City
- — inherits STATE
ZIP-level market 23222
- Rents YoY
- 7.4%
- Active inventory
- 185
- Price-to-rent
- 9.9×
Monthly cashflow live
- Estimated rent
- $1,899 high interval (Pro) →
- Mortgage (P&I)
- −$1,180
- Tax from tax record
- −$157 /mo · $1,884/yr
- Insurance
- −$94
- HOA
- −$0
- Vacancy / Maint / Mgmt
- −$399
- Net cashflow
- $69
Break-even live
Sensitivity live
| Price | -10% $197 | -5% $133 | +0% $69 | +5% $6 | +10% $-58 |
|---|---|---|---|---|---|
| Rent | -10% $-81 | -5% $-6 | +0% $69 | +5% $144 | +10% $219 |
| Rate | -1.0pp $183 | -0.5pp $126 | base $69 | +0.5pp $11 | +1.0pp $-48 |
UW: 25.0% down · 7.5% · 30yr · 1.5% tax · 5.0% vac · 8.0% maint · 8.0% mgmt
Financing live
Cash to close
- Down payment
- $56,250
- Closing costs
- $6,750
- Reserves months
- —
- Total cash needed
- —
Loan-product check · same deal, 3 products live
Conventional
25% down · 7.5% · 30yr
- Down + closing
- —
- Monthly P&I
- —
- Monthly cashflow
- —
- DSCR
- —
- Eligible?
- —
Personal DTI + credit; lowest rate.
DSCR
20% down · 8.5% · 30yr
- Down + closing
- —
- Monthly P&I
- —
- Monthly cashflow
- —
- DSCR
- —
- Eligible?
- —
No personal income docs; deal must DSCR.
Hard money
10% down · 12.0% · 12mo
- Down + closing
- —
- Monthly P&I
- —
- Monthly cashflow
- —
- DSCR
- —
- Eligible?
- —
Short-term bridge; refi at stabilization.
Rent comps 39 comps
| Address | Beds | Baths | Sqft | Rent | $/sqft | DOM | Units | Dist |
|---|---|---|---|---|---|---|---|---|
| 3204 North Ave Richmond, VA | 3.0 | 2.5 | 1626 | $2,395 | $1.47 | 6d | 1 | 0.25mi |
| 3311 Cliff Ave Richmond, VA | 2.0 | 1.5 | 1567 | $2,000 | $1.28 | 45d | 1 | 0.40mi |
| 622 Pollock St Richmond, VA | 3.0 | 1.5 | 1122 | $2,300 | $2.05 | 25d | 1 | 0.45mi |
| 3117 Meadowbridge Rd Richmond, VA | 2.0 | 1.0 | 887 | $1,225 | $1.38 | 45d | 1 | 0.47mi |
| 3324 Meadowbridge Rd Richmond, VA | 4.0 | 2.5 | 1667 | $2,175 | $1.30 | 19d | 1 | 0.52mi |
| 3211 Maryland Ave Richmond, VA | 4.0 | 1.5 | 1344 | $1,871 | $1.39 | 45d | 1 | 0.52mi |
| 2420 Barton Ave Apt 2 Richmond, VA | 2.0 | 1.0 | 900 | $1,150 | $1.28 | 25d | 1 | 0.55mi |
| 2416 Barton Ave Apt 2 Richmond, VA | 2.0 | 1.0 | 1000 | $1,150 | $1.15 | 45d | 1 | 0.57mi |
| 2807 Edgewood Ave Richmond, VA | 3.0 | 1.0 | 1320 | $1,750 | $1.33 | 45d | 1 | 0.59mi |
| 2810 2nd Ave Richmond, VA | 2.0 | 1.0 | 1120 | $1,950 | $1.74 | 45d | 1 | 0.61mi |
| 3501 Meadowbridge Rd Richmond, VA | 3.0 | 1.0 | 1383 | $1,495 | $1.08 | 25d | 1 | 0.62mi |
| 3501 Meadowbridge Rd Richmond, VA | 3.0 | 1.0 | 1383 | $1,495 | $1.08 | 22d | 1 | 0.62mi |
| 3202 1st Ave Richmond, VA | 3.0 | 2.5 | 1440 | $2,062 | $1.43 | 23d | 1 | 0.64mi |
| 3007 Moss Side Ave Richmond, VA | 3.0 | 2.5 | 1772 | $2,495 | $1.41 | 25d | 1 | 0.64mi |
| 3716 Delmont St Richmond, VA | 2.0 | 2.0 | 890 | $1,122 | $1.26 | 45d | 1 | 0.66mi |
| 3418 Carolina Ave Unit A Richmond, VA | 2.0 | 1.0 | 1000 | $1,524 | $1.52 | 45d | 1 | 0.72mi |
| 3800 North Ave Richmond, VA | 3.0 | 1.0 | 1008 | $1,650 | $1.64 | 13d | 1 | 0.73mi |
| 2922 Noble Ave Unit A Richmond, VA | 2.0 | 1.0 | 1200 | $1,499 | $1.25 | 6d | 1 | 0.74mi |
| 3425 Carolina Ave Unit A Richmond, VA | 3.0 | 1.0 | 1300 | $1,400 | $1.08 | 45d | 1 | 0.75mi |
| 3425 Carolina Ave Unit B Richmond, VA | 3.0 | 1.0 | 1300 | $1,400 | $1.08 | 25d | 1 | 0.75mi |
| 3017 Dill Ave Richmond, VA | 4.0 | 2.0 | 1578 | $1,895 | $1.20 | 5d | 1 | 0.76mi |
| 2919 4th Ave #2 Richmond, VA | 2.0 | 2.0 | 950 | $1,287 | $1.35 | 45d | 1 | 0.77mi |
| 2806 Hawthorne Ave Unit 1 Richmond, VA | 2.0 | 1.0 | 1144 | $1,400 | $1.22 | 45d | 1 | 0.79mi |
| 3615 Missouri Ave Richmond, VA | 3.0 | 2.0 | 1758 | $2,150 | $1.22 | 45d | 1 | 0.80mi |
| 3103 Dill Ave Richmond, VA | 3.0 | 1.5 | 1380 | $2,050 | $1.49 | 25d | 1 | 0.81mi |
| 3511 1st Ave Richmond, VA | 4.0 | 1.5 | 1600 | $2,050 | $1.28 | 25d | 1 | 0.87mi |
| 1910 North Ave Richmond, VA | 3.0 | 1.0 | 1010 | $1,595 | $1.58 | 12d | 1 | 0.91mi |
| 200 Minor St Unit A Richmond, VA | 3.0 | 1.0 | 1100 | $1,295 | $1.18 | 25d | 1 | 0.94mi |
| 3909 Patrick Ave Richmond, VA | 3.0 | 1.5 | 1200 | $2,650 | $2.21 | 45d | 1 | 0.95mi |
| 3621 Enslow Ave Richmond, VA | 2.0 | 1.5 | 1232 | $2,850 | $2.31 | 25d | 1 | 0.95mi |
| 1801 Monteiro Ave Unit 1 Richmond, VA | 2.0 | 2.0 | 1500 | $1,550 | $1.03 | 6d | 1 | 1.00mi |
| 3317 Waverly Blvd Unit B Richmond, VA | 3.0 | 2.0 | 1500 | $1,875 | $1.25 | 19d | 1 | 1.00mi |
| 207 Welford St Richmond, VA | 3.0 | 1.5 | 1348 | $1,850 | $1.37 | 25d | 1 | 1.01mi |
| 3101 Divine Dr Richmond, VA | 3.0 | 2.5 | 1525 | $2,700 | $1.77 | 5d | 1 | 1.18mi |
| 1519 Byron St Richmond, VA | 3.0 | 1.5 | 1384 | $1,700 | $1.23 | 5d | 1 | 1.18mi |
| 3200 Brook Rd Richmond, VA | 1.0–2.0 | 1.0–2.5 | 968 | $2,633 | $2.72 | 4d | 20 | 1.19mi |
| 403 Fritz St Richmond, VA | 2.0 | 1.0 | 1000 | $1,595 | $1.59 | 45d | 1 | 1.22mi |
| 1601 Roane St Richmond, VA | 1.0–3.0 | 1.0–2.5 | 914 | $2,100 | $2.30 | 3d | 28 | 1.25mi |
| 2005 Brook Rd Richmond, VA | 2.0 | 1.0–2.0 | 739 | $2,767 | $3.74 | 23d | 18 | 1.30mi |
Listing history 3 events
-
2026-04-23status Pending
-
2026-04-07$225,000 Active
-
1973-03-05soldstatus $18,900
ⓘ Source: listings_history table (triggers on properties + properties_extension) + one-shot
backfill from property_details.listing_events for pre-trigger history.
Tax reassessment forecast VA · Resets to sale price
- Current annual tax
- $1,884 · $157/mo
- Projected year-2 tax
- $1,884 · $157/mo
- Expected delta
- $0/yr ($0/mo · 0.0%)
ⓘ Screening estimate from a state-policy table — verify with the county assessor before closing.
Climate risk First Street
- Flood 1/10 Low FEMA zone X (unshaded) · 0% chance over 30 yrs
- Wildfire 1/10 Low
- Heat 8/10 Severe 7 d/yr ≥105°F today · 17 d/yr by 30 yrs out
- Wind 6/10 Major 27% chance of damaging wind over 30 yrs
- Air quality 2/10 Low 1 unhealthy d/yr today · 3 by 30 yrs out
Nearby sold comps map
Loading sold comps map…
Walkable amenities ~0.75 mi
Loading nearby amenities…
Taxation est. · year 1
- Rental income
- $22,783
- − Mortgage interest
- −$12,603
- − Property taxes
- −$1,884
- − Insurance
- −$1,125
- − Repairs & maintenance
- −$1,823
- − Management
- −$1,823
- − Depreciation
- −$6,545
- Taxable loss
- −$3,020
- Est. tax savings @ 24.0%
- +$725
- After-tax cash flow
- $1,556/yr
For passive investors: Depreciation is non-cash, so a rental often shows a tax loss while cash-flowing — sheltering income. Rental losses are passive: they offset passive income freely, and up to $25,000/yr can offset ordinary (W-2) income if you actively participate and your MAGI is under $100k (phasing out to $0 by $150k); unused losses carry forward. On sale, claimed depreciation is recaptured at up to 25%, and gains may owe capital-gains tax (a 1031 exchange can defer both). Figures are a year-1 estimate at your 24.0% rate — not tax advice; consult a CPA.
Schools (NCES district)
- District
- Richmond City Public School District
- NCES district ID
- 5103240
- Math proficiency
- 32% ▼ -24.00%
- Reading proficiency
- 47% ▼ -9.00%
- Median HH income
- $40,276
- Composite
- 33.09/100
- National rank
- #5564
- State rank
- #123 of 131 in VA
Livability — Richmond
- Score
- 84/100
- State rank
- #33
- US rank
- #793
Category grades
Schools grade is shown separately in the Schools card above.
Census & demographics
- Census place
- Richmond, VA
- County
- Richmond City · 178,280 people
- City population
- 287,109
- Metro
- Richmond, VA
- Population (ZIP)
- 26,322
- Household income
- $61,345
- Rent vs Own
- Severe rent burden
- 1325.0
Population outlook (Richmond County) Hauer SSP2
- Today (2025)
- 262,263 people
- By 2030
- 284,503 · +8.5%
- By 2040
- 327,353 · +24.8%
- By 2050
- 367,946 · +40.3%
- By 2075
- 449,560 · +71.4%
- By 2100
- 500,301 · +90.8%
Race, ethnicity, and origin ACS 2023
- Neighborhood character
- Predominantly Black (70%)
- Race & ethnicity
- Black 70% White 21% Two or more races 4% Hispanic / Latino 3% Asian 2%
- Common ancestry
- Lithuanian 1% Italian 1% Serbian 1%
- Foreign-born
- 5% · Canada
- Languages at home
- 95% English-only · Spanish 2% Other Indo-European 1%
Political lean MEDSL · Richmond
- 2024 margin
- Solid D (+66.3) · D 82.0% · R 15.8% · Other 2.2%
- 2008→2024 swing
- +7.2pp toward D · 2008: 59.1pp · 2024: 66.3pp
- All cycles
- 2024: D+66.3 2020: D+68.0 2016: D+63.8 2012: D+55.7 2008: D+59.1
Not yet ingested
- Civics
- —
Market trends
- HPI YoY
- ▼ -288.72%
- Current HPI
- 428.4029
- Rent YoY
- ▲ 7.43%
- Metro
- Richmond, VA
- State GDP YoY
- ▲ 2.40%
- F500 in state
- 50
Industry mix (Fortune 500 HQ in VA)
| Industry | F500 HQs | Revenue |
|---|---|---|
| Aerospace / Defense | 4 | $236B |
|
||
| Technology / Defense | 3 | $32B |
|
||
| Financial Services | 2 | $176B |
|
||
| Utilities | 2 | $27B |
|
||
| Insurance | 2 | $25B |
|
||
| Technology | 2 | $15B |
|
||
Price history
+1090.5% since first listed3 events — show timeline
- 2026-04-23 Pending — CVRMLS
- 2026-04-07 Listed $225,000 CVRMLS
- 1973-03-05 Sold (Public Records) $18,900 Public Records
Property tax history
+7.0%/yrLatest (2022): $1,884 · +40.2% YoY. Source: county tax records.
Cash-flow waterfall
monthlySold comps — $/sqft
last 12 mo · ≤1 miLoading sold comps…