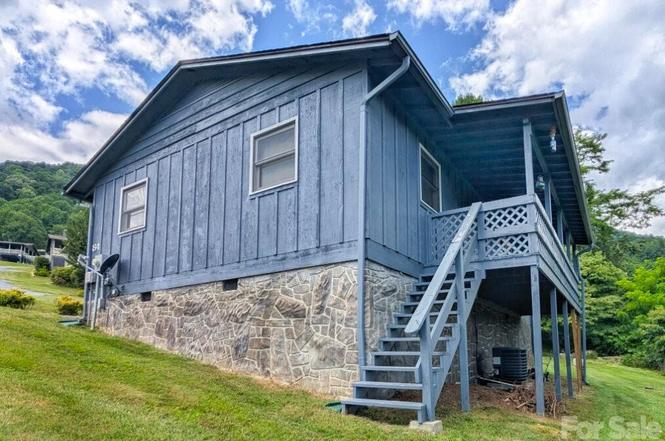
84 Stoney Ridge Loop · Maggie Valley, NC
Flood risk 1/10 · Minimal
- FEMA flood zone
- X (unshaded)
- Chance of flooding over 30 yrs
- 0.0%
- Est. flood insurance / yr
- $473 – $860
Fire risk 2/10 · Minimal
- Est. fire insurance / yr
- $906 – $1,684
Heat risk 3/10 · Minor
- Hot days now (above 85°F)
- 12 days/yr
- Hot days in 30 yrs
- 35 days/yr
Wind risk 2/10 · Minimal
- Chance of severe wind over 30 yrs
- —
Air-quality risk 3/10 · Minor
- Unhealthy air days now
- 3 days/yr
- Unhealthy air days in 30 yrs
- 3 days/yr
Risk factors via First Street. Map © Google.
Why this score? — see what drove the C- grade
The composite is a weighted blend of 9 inputs, each scored 0–100. Each bar is that input's sub-score; the figure is the points it added to the 100-point composite (weight × sub-score).
- Cash flow +15.4/30.0
- ARV discount +15.0/15.0
- DSCR +4.7/10.0
- Schools +4.5/10.0
- 1% rule +3.3/10.0
- Livability +2.6/5.0
- Rent growth +2.5/5.0
- Condition / age +2.5/5.0
- Appreciation +0.0/10.0
$300,000
🖨 Deal sheet (PDF) 📄 Offer letter ✓ Due diligence
Listing remarks MLS
Cabin with a view in beautiful Maggie Valley. Low maintenance, open floor plan,front porch,covered parking,minutes to Maggie. Right over the mountain from Cherokee. All in a very well kept neighborhood.
Key facts
- Covered front porch
- Open floor plan
- Carport
Tags
Property features AI
Finance
- HOA & community: Homeowners association required; Annual HOA fee of $450
Exterior
- Parking: Attached carport (1 car, main level)
- Utilities: City water; Public sewer; Cable available; Electricity connected; Propane
- Home design: Single-family residence; Residential property; One story; Entry level: Main
- Construction: Site-built construction; Wood construction materials; Composition roof; Crawl space foundation; Built on one level
- Exterior features: Covered patio/porch; Private maintained paved/asphalt road
Interior
- Kitchen: Dishwasher; Electric range; Refrigerator
- Bedrooms: 2 bedrooms (both on the main level)
- Flooring: Carpet; Vinyl
- Bathrooms: 2 full bathrooms (main level)
- Heating & cooling: Baseboard heating; Central heating; Electric heating; Forced air; Central air conditioning
- Interior features: 7 total rooms; Gas log fireplace; Covered porch
- Laundry & utility: Electric dryer hookup in kitchen
Neighborhood map
What this means for you Summary
Snapshot
- This is a 2-bed/2.0-bath single-family listed at $300k.
Deal economics
- At list price, monthly cash flow is $118 ($1k/yr) — positive.
- The deal already cash-flows at list — no discount required.
- To meet the 1% rule (rent ≥ 1% of price), the offer needs to be $250k (16.7% below list).
- Recommended offer: $250k (16.7% below list) — sets the bar for 1% rule.
- Cap rate 6.8% vs local median 2.3% in Maggie Valley — top-decile yield for the area; either an underpriced asset or a hidden risk that comps aren't pricing in. Stress-test before assuming the spread holds.
Location & tenants
- Location reads 51/100 on livability (#701 in NC) — a working-class tenant base; expect higher turnover. Strengths: housing A+, cost of living A; Watch: crime F, amenities F, commute F.
- Haywood County Schools (suburban): math 55% / reading 53% proficiency, ranked #50 of 178 in NC (top 28%) — acceptable for families but not a draw, mixed tenant base, ~2y average lease.
- Zoned schools: Jonathan Valley Elementary (math 52% / reading 47%, grade D, #417 of 1,410 statewide, top 32%, 378 students, 99% FRL); Waynesville Middle (math 49% / reading 54%, grade C, #103 of 475 statewide, top 22%, 720 students, 62% FRL); Tuscola High (math 57% / reading 60%, grade C, #235 of 535 statewide, top 45%, 917 students, 49% FRL) — zoned schools average 70% FRL vs 49% district-wide (21 pts higher); higher-poverty schools than district average — tighter screening recommended.
- Market conditions: 243 active listings in the ZIP; 1 comparable units currently listed for rent nearby; 537 units permitted in Haywood County in 2024 (150 in 5+ unit buildings).
Forward outlook
- Local home prices are declining (-3.0%/yr); year-one equity from $2k of loan paydown is wiped out by about $9k of value loss. Plan a longer hold.
Negotiation context
- It's been on market 338 days — a 12% lower offer ($264k) is reasonable based on typical stale-listing flexibility.
- 2 sale attempts since 12y ago; this cycle's ask has dropped $49k (14%) from the opening price — seller is motivated, your offer sets the floor, not the list.
- Current owner paid $52k; list at $300k implies a 477% gain — meaningful room to come down on a strong offer.
Questions for the listing agent
- It's been on market 338 days. Have you received any prior offers? Is the seller open to a 17% concession, seller financing, or rate buy-down credit?
- What does the HOA fee cover, when was the last increase, and are there any pending special assessments or reserve-fund shortfalls?
- Why hasn't it sold? Are there any deal-killer items the seller is aware of (foundation, flood, title, zoning, code violations)?
- Is there a deadline driving the sale (1031 exchange, divorce, estate, relocation)? That informs how much negotiation room exists.
- Schools are D-rated, which usually means shorter tenancies and higher turnover. Who's the typical renter profile here, and what's been the actual vacancy rate?
- Crime grade is F in this area — have there been break-ins, vandalism, or insurance claims at this property in the last 3 years? What carrier currently insures it and at what premium?
- What's the average days-on-market for RENTAL listings here right now (not sales)? A rising rental-DOM trend means longer vacancies and softer asking-rent achievability than the comps imply.
- What's the recent tenant-quality profile in this submarket — average credit score on applications, eviction rate, late-payment / NSF rate, and stable-employment percentage? A property-management company in the area should have these aggregated.
- How much new for-sale + rental construction is in the pipeline within 1–3 miles? Heavy new supply typically softens prices + rents 12–24 months out; constrained supply supports both.
Investment metrics
- 1% rule
- 0.83% ✗
- Cap rate
- 6.76%
- Cash-on-cash
- 1.68%
- DSCR
- 1.07
- GRM
- 10.0
CMA / ARV
- ARV (on-the-fly)
- $360,000
- Comps found
- 10
Show comp detail 10 sales within ~0.75 mi
| Address | Dist | Beds/Ba | Sqft | Sold | Price | $/sf | Match |
|---|---|---|---|---|---|---|---|
| 12 Boulder Ln | 0.03mi | 2/2.0 | 982 (+2%) | 7mo | $340,000 | $346 | 89 |
| 336 Stoney Ridge Loop | 0.12mi | 2/2.0 | 966 (+1%) | 6mo | $345,000 | $357 | 88 |
| 38 Boulder Ln | 0.05mi | 2/2.0 | 960 (0%) | 14mo | $360,000 | $375 | 86 |
| 21 Flint Ln | 0.14mi | 2/2.0 | 890 (-7%) | 0mo | $330,000 | $371 | 81 |
| 98 Stoney Ridge Loop | 0.01mi | 2/2.0 | 970 (+1%) | 21mo | $366,000 | $377 | 80 |
| 80 Sapphire Ln | 0.09mi | 2/3.0 | 985 (+3%) | 9mo | $380,000 | $386 | 80 |
| 24 Hawthorn Rd | 0.60mi | 2/2.0 | 884 (-8%) | 2mo | $375,000 | $424 | 57 |
| 131 Elm Dr | 0.59mi | 2/2.0 | 987 (+3%) | 19mo | $329,000 | $333 | 52 |
| 59 Enchanted Way | 0.57mi | 2/2.0 | 864 (-10%) | 16mo | $277,700 | $321 | 43 |
| 412 Soco Acres Rd | 0.74mi | 1/1.0 (-1) | 871 (-9%) | 23mo | $330,000 | $379 | 21 |
Match score weights: distance 35% · size 25% · config 20% · recency 20%. Top-matched comps best support the ARV.
Projected returns pro-forma
-3.0% appreciation · 3.0% rent growth · sell at horizon
- IRR
- -13.7%
- Equity multiple
- 0.51×
- Total profit
- $-41,200
- Equity at exit
- $44,731
- IRR
- -4.8%
- Equity multiple
- 0.68×
- Total profit
- $-26,594
- Equity at exit
- $25,939
Cash invested: $84,000 (down + closing). Projections, not guarantees.
Landlord ↔ Tenant lean methodology
- Overall (STATE)
- 85 Strongly Landlord-Friendly
- State North Carolina
- 85 Strongly Landlord-Friendly · R+3
- County
- — inherits STATE
- City
- — inherits STATE
ZIP-level market 28751
- Home prices YoY
- -23.8%
- Active inventory
- 243
- Price-to-rent
- 10.0×
Monthly cashflow live
- Estimated rent
- $2,500 medium interval (Pro) →
- Mortgage (P&I)
- −$1,573
- Tax from tax record
- −$121 /mo · $1,451/yr
- Insurance
- −$125
- HOA
- −$38
- Vacancy / Maint / Mgmt
- −$525
- Net cashflow
- $118
Break-even live
Sensitivity live
| Price | -10% $288 | -5% $203 | +0% $118 | +5% $33 | +10% $-52 |
|---|---|---|---|---|---|
| Rent | -10% $-80 | -5% $19 | +0% $118 | +5% $217 | +10% $315 |
| Rate | -1.0pp $269 | -0.5pp $194 | base $118 | +0.5pp $40 | +1.0pp $-39 |
UW: 25.0% down · 7.5% · 30yr · 1.5% tax · 5.0% vac · 8.0% maint · 8.0% mgmt
Financing live
Cash to close
- Down payment
- $75,000
- Closing costs
- $9,000
- Reserves months
- —
- Total cash needed
- —
Loan-product check · same deal, 3 products live
Conventional
25% down · 7.5% · 30yr
- Down + closing
- —
- Monthly P&I
- —
- Monthly cashflow
- —
- DSCR
- —
- Eligible?
- —
Personal DTI + credit; lowest rate.
DSCR
20% down · 8.5% · 30yr
- Down + closing
- —
- Monthly P&I
- —
- Monthly cashflow
- —
- DSCR
- —
- Eligible?
- —
No personal income docs; deal must DSCR.
Hard money
10% down · 12.0% · 12mo
- Down + closing
- —
- Monthly P&I
- —
- Monthly cashflow
- —
- DSCR
- —
- Eligible?
- —
Short-term bridge; refi at stabilization.
Rent comps 1 comps
| Address | Beds | Baths | Sqft | Rent | $/sqft | DOM | Units | Dist |
|---|---|---|---|---|---|---|---|---|
| 8 Granite Ln Maggie Valley, NC | 2.0 | 2.0 | 986 | $2,500 | $2.54 | 15d | 1 | 0.08mi |
HOA detail
- Monthly dues
- $38 · $456/yr
Listing history 23 events
-
2026-06-22days on market $300,000 Active 338 DOM
-
2026-06-18days on market $300,000 Active 335 DOM
-
2026-06-17days on market $300,000 Active 334 DOM
-
2026-06-16days on market $300,000 Active 333 DOM
-
2026-06-15days on market $300,000 Active 332 DOM
-
2026-06-14days on market $300,000 Active 330 DOM
-
2026-06-13days on market $300,000 Active 329 DOM
-
2026-06-10days on market $300,000 Active 327 DOM
-
2026-06-09days on market $300,000 Active 326 DOM
-
2026-06-08days on market $300,000 Active 325 DOM
-
2026-06-07pricedays on market $300,000 Active 324 DOM
-
2026-06-03days on market $315,000 Active 320 DOM
-
2026-06-02days on market $315,000 Active 319 DOM
-
2026-06-01days on market $315,000 Active 318 DOM
-
2026-05-31days on market $315,000 Active 317 DOM
-
2026-05-30days on market $315,000 Active 316 DOM
-
2025-09-25price $315,000
-
2025-09-05price $325,000
-
2025-08-02price $339,000
-
2025-07-18$349,000 Active
-
2014-07-11soldstatus $52,000 202-char remark
Show marketing remark (202 chars)
Cabin with a view in beautiful Maggie Valley. Low maintenance, open floor plan,front porch,covered parking,minutes to Maggie. Right over the mountain from Cherokee. All in a very well kept neighborhood.
-
2014-07-11soldstatus $52,000 202-char remark
Show marketing remark (202 chars)
Cabin with a view in beautiful Maggie Valley. Low maintenance, open floor plan,front porch,covered parking,minutes to Maggie. Right over the mountain from Cherokee. All in a very well kept neighborhood.
-
2014-04-07$64,900 202-char remark
Show marketing remark (202 chars)
Cabin with a view in beautiful Maggie Valley. Low maintenance, open floor plan,front porch,covered parking,minutes to Maggie. Right over the mountain from Cherokee. All in a very well kept neighborhood.
ⓘ Source: listings_history table (triggers on properties + properties_extension) + one-shot
backfill from property_details.listing_events for pre-trigger history.
Tax reassessment forecast NC · Resets to sale price
- Current annual tax
- $1,451 · $121/mo
- Projected year-2 tax
- $2,460 · $205/mo
- Expected delta
- +$1,009/yr (+$84/mo · 69.6%)
ⓘ Screening estimate from a state-policy table — verify with the county assessor before closing.
Climate risk First Street
- Flood 1/10 Low FEMA zone X (unshaded) · 0% chance over 30 yrs
- Wildfire 2/10 Low
- Heat 3/10 Moderate 12 d/yr ≥85°F today · 35 d/yr by 30 yrs out
- Wind 2/10 Low
- Air quality 3/10 Moderate 3 unhealthy d/yr today · 3 by 30 yrs out
Nearby sold comps map
Loading sold comps map…
Walkable amenities ~0.75 mi
Loading nearby amenities…
Taxation est. · year 1
- Rental income
- $30,000
- − Mortgage interest
- −$16,805
- − Property taxes
- −$1,451
- − Insurance
- −$1,500
- − Repairs & maintenance
- −$2,400
- − Management
- −$2,400
- − HOA
- −$456
- − Depreciation
- −$8,727
- Taxable loss
- −$3,738
- Est. tax savings @ 24.0%
- +$897
- After-tax cash flow
- $2,312/yr
For passive investors: Depreciation is non-cash, so a rental often shows a tax loss while cash-flowing — sheltering income. Rental losses are passive: they offset passive income freely, and up to $25,000/yr can offset ordinary (W-2) income if you actively participate and your MAGI is under $100k (phasing out to $0 by $150k); unused losses carry forward. On sale, claimed depreciation is recaptured at up to 25%, and gains may owe capital-gains tax (a 1031 exchange can defer both). Figures are a year-1 estimate at your 24.0% rate — not tax advice; consult a CPA.
Schools (NCES district)
- District
- Haywood County Schools
- NCES district ID
- 3702040
- Math proficiency
- 55% ▲ 7.00%
- Reading proficiency
- 53% ▲ 2.00%
- Median HH income
- $42,715
- Composite
- 45.42/100
- National rank
- #2623
- State rank
- #50 of 178 in NC
Livability — Maggie Valley
- Score
- 51/100
- State rank
- #701
- US rank
- #25374
Category grades
Schools grade is shown separately in the Schools card above.
Census & demographics
- Census place
- Maggie Valley, NC
- Population (ZIP)
- 4,370
Population outlook (Haywood County) Hauer SSP2
- Today (2025)
- 61,607 people
- By 2030
- 62,137 · +0.9%
- By 2040
- 62,418 · +1.3%
- By 2050
- 61,578 · +-0.0%
- By 2075
- 59,137 · -4.0%
- By 2100
- 53,470 · -13.2%
Race, ethnicity, and origin ACS 2023
- Neighborhood character
- Predominantly White (91%)
- Race & ethnicity
- White 91% Hispanic / Latino 5% Two or more races 3%
- Common ancestry
- Slovak 4% Italian 4% Serbian 3%
- Foreign-born
- 3% · Canada
- Languages at home
- 95% English-only · Spanish 4%
Political lean MEDSL · Haywood
- 2024 margin
- Strong R (+25.1) · D 36.9% · R 62.0% · Other 1.1%
- 2008→2024 swing
- -17.4pp toward R · 2008: -7.8pp · 2024: -25.1pp
- All cycles
- 2024: R+25.1 2020: R+26.5 2016: R+28.0 2012: R+13.8 2008: R+7.8
Not yet ingested
- Civics
- —
Market trends
- HPI YoY
- ▼ -66.36%
- Current HPI
- 211.9422
- Rent YoY
- —
- Metro
- —
- State GDP YoY
- ▲ 3.28%
- F500 in state
- 26
Industry mix (Fortune 500 HQ in NC)
| Industry | F500 HQs | Revenue |
|---|---|---|
| Financial Services | 2 | $213B |
|
||
| Retail | 2 | $95B |
|
||
| Industrial Conglomerate | 1 | $38B |
|
||
| Metals / Steel | 1 | $35B |
|
||
| Utilities | 1 | $30B |
|
||
| Industrial Machinery | 1 | $19B |
|
||
Price history
+385.4% since first listed7 events — show timeline
- 2025-09-25 Price Changed $315,000 CANOPYMLS as Distributed by MLS Grid
- 2025-09-05 Price Changed $325,000 CANOPYMLS as Distributed by MLS Grid
- 2025-08-02 Price Changed $339,000 CANOPYMLS as Distributed by MLS Grid
- 2025-07-18 Listed $349,000 CANOPYMLS as Distributed by MLS Grid
- 2014-07-11 Sold (MLS) $52,000 NCMMLS
- 2014-07-11 Sold (MLS) $52,000 CANOPYMLS as Distributed by MLS Grid
- 2014-04-07 Listed $64,900 CANOPYMLS as Distributed by MLS Grid
Property tax history
+4.9%/yrLatest (2025): $1,451 · +2.8% YoY. Source: county tax records.
Cash-flow waterfall
monthlySold comps — $/sqft
last 12 mo · ≤1 miLoading sold comps…