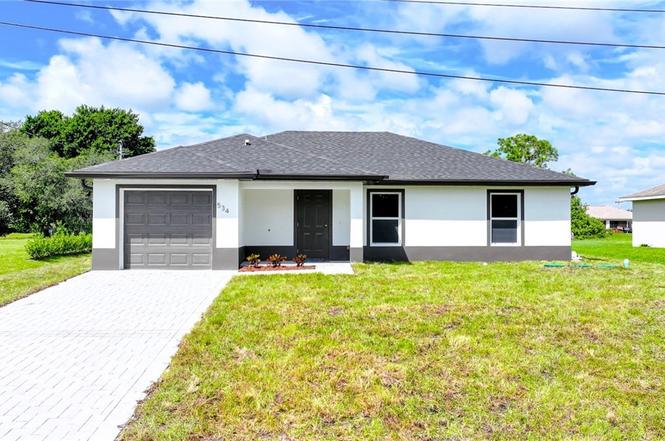
319 Hermosa Ave · Lehigh Acres, FL
Flood risk 1/10 · Minimal
- FEMA flood zone
- X (unshaded)
- Chance of flooding over 30 yrs
- 0.0%
- Est. flood insurance / yr
- $507 – $1,088
Fire risk 3/10 · Minor
- Est. fire insurance / yr
- $947 – $1,759
Heat risk 9/10 · Severe
- Hot days now (above 108°F)
- 7 days/yr
- Hot days in 30 yrs
- 26 days/yr
Wind risk 10/10 · Severe
- Chance of severe wind over 30 yrs
- 99.0%
Air-quality risk 2/10 · Minimal
- Unhealthy air days now
- 1 days/yr
- Unhealthy air days in 30 yrs
- 2 days/yr
Risk factors via First Street. Map © Google.
Why this score? — see what drove the D grade
The composite is a weighted blend of 9 inputs, each scored 0–100. Each bar is that input's sub-score; the figure is the points it added to the 100-point composite (weight × sub-score).
- Cash flow +10.0/30.0
- Appreciation +10.0/10.0
- ARV discount +7.5/15.0
- Schools +4.1/10.0
- 1% rule +3.0/10.0
- Livability +3.0/5.0
- DSCR +2.8/10.0
- Condition / age +2.5/5.0
- Rent growth +1.3/5.0
$258,900
🖨 Deal sheet 📄 Offer letter ✓ Due diligence
Listing remarks
BRAND NEW CONSTRUCTION!! You Will Be Amazed By The Quality Of This Brand New 3 Bedroom/2 Bathroom Home With Eastern Exposure For Those Amazing Painted Florida Sunrises On An Oversized 1/4+ Acre Lot In Lehigh Acres, FL. This Home Has 1258 SF Under Air And It Is COMPLETELY Finished With Its CO Issued! You Can Move Into It Today Or Use It As A Cash Flowing Rental Unit (High Demand). The Gourmet Kitchen Comes With Quartz Countertops, STAINLESS STEEL APPLIANCES, White Real Wood Shaker SOFT TOUCH Cabinet Doors & Drawers, Glass Tile Backsplash, Floor To Ceiling Pantry, And A Large Breakfast Bar. Other Upgrades Include; FREE BRAND NEW WASHER AND DRYER WITH PURCHASE OF THIS PROPERTY, HURRICAN
Key facts
- Quartz countertops
- Gourmet kitchen
- Oversized lot
Tags
Property features AI
Finance
- Other: Lot is oversized with approximate dimensions 80 x 125 x 90 x 125 (appraiser source); Road is public and maintained; paved road surface; Zoned RS-1; Irrigation via well
- Financial info: Pets allowed
- HOA & community: Non-gated community; Street lights
Exterior
- Parking: Attached garage with 1 covered space; Driveway parking; Paved access; Garage door opener
- Security: Smoke detectors
- Utilities: Well water; Septic tank; Cable available; High-speed internet available
- Home design: Single-story (1 story); New construction; Entry level: 1; Faces west; East exposures noted
- Construction: Block, concrete and stucco construction; Shingle roof; New construction
- Exterior features: Security/high-impact doors; Room for pool; Open porch/lanai (screened porch)
Interior
- Kitchen: Refrigerator; Range; Self-cleaning oven; Microwave; Dishwasher; Icemaker; Water purifier; Breakfast bar; Pantry; Eat-in kitchen
- Bedrooms: Master bedroom (main level); Two additional bedrooms (main level)
- Flooring: Tile flooring
- Bathrooms: 2 full bathrooms
- Heating & cooling: Central heating (electric); Central air conditioning (electric); Ceiling fans
- Interior features: Impact glass windows; Breakfast bar; Built-in features; Eat-in kitchen; High ceilings; Living/Dining room; Custom mirrors; Main-level primary bedroom; Pantry; Sitting area in primary; Tub/shower; Vaulted ceilings; Walk-in closets; Split bedroom floorplan
- Laundry & utility: Washer; Dryer; Laundry room inside; Utility room
Neighborhood map
What this means for you Summary
Snapshot
- This is a 3-bed/2.0-bath land listed at $259k.
Deal economics
- At list price, monthly cash flow is $-158 ($-2k/yr) — negative.
- To cash-flow at today's rent, offer at most $236k (8.8% below list).
- To meet the 1% rule (rent ≥ 1% of price), the offer needs to be $207k (20.2% below list).
- Recommended offer: $207k (20.2% below list) — sets the bar for 1% rule.
Location & tenants
- Location reads 59/100 on livability (#826 in FL) — a working-class tenant base; expect higher turnover. Strengths: cost of living A+, housing A+; Watch: crime C-, employment D+, schools D-.
- Lee (suburban): math 47% / reading 50% proficiency, ranked #42 of 73 in FL (top 58%) — families likely to look elsewhere, expect single-tenant / working-renter base with shorter leases.
- Market conditions: Rents falling (-4.7%/yr); 2460 active listings in the ZIP; 40 comparable units currently listed for rent nearby; rentals at typical pace (median 16d on market — plan ~3-4 weeks tenant-placement turnaround); 15,411 units permitted in Lee County in 2024 (4,686 in 5+ unit buildings).
- This rent runs 34% of the median local income ($72k/yr) — at the standard rent-burdened threshold; future hikes will face affordability resistance.
Forward outlook
- In year one you build about $28k of equity ($2k loan paydown + $26k appreciation (10.0% local appreciation)).
- Lee County population projected at +44% by 2050 — long-run rental-demand tailwind backs the buy-and-hold thesis.
- By year 2, paydown + projected appreciation supports a ~$44k cash-out refi (75% LTV) — recoverable capital for the next deal without selling this one.
Negotiation context
- It's been on market 150 days — a 12% lower offer ($228k) is reasonable based on typical stale-listing flexibility.
- Current owner paid $30k; list at $259k implies a 763% gain — meaningful room to come down on a strong offer.
Risks & watch-outs
- Climate carrying-cost: severe wind risk, 99% chance of damaging wind over 30y; extreme-heat days projected 7→26/yr by 2055 (HVAC capex compounding) — expect insurance premiums to compound above CPI over the hold.
Questions for the listing agent
- What do current leases actually rent for vs. the listed asking? Can we see a recent rent roll and the last 12 months of T-12 income?
- It's been on market 150 days. Have you received any prior offers? Is the seller open to a 20% concession, seller financing, or rate buy-down credit?
- Why hasn't it sold? Are there any deal-killer items the seller is aware of (foundation, flood, title, zoning, code violations)?
- Is there a deadline driving the sale (1031 exchange, divorce, estate, relocation)? That informs how much negotiation room exists.
- Schools are D-rated, which usually means shorter tenancies and higher turnover. Who's the typical renter profile here, and what's been the actual vacancy rate?
- The area grade is low — what's the realistic commute time and amenity access for the typical tenant pool here? Any planned neighborhood developments (good or bad) we should know about?
- What's the average days-on-market for RENTAL listings here right now (not sales)? A rising rental-DOM trend means longer vacancies and softer asking-rent achievability than the comps imply.
- What's the recent tenant-quality profile in this submarket — average credit score on applications, eviction rate, late-payment / NSF rate, and stable-employment percentage? A property-management company in the area should have these aggregated.
- How much new for-sale + rental construction is in the pipeline within 1–3 miles? Heavy new supply typically softens prices + rents 12–24 months out; constrained supply supports both.
Investment metrics
- 1% rule
- 0.80% ✗
- Cap rate
- 5.56%
- Cash-on-cash
- -2.61%
- DSCR
- 0.88
- GRM
- 10.4
CMA / ARV
No comps found within radius.
Projected returns pro-forma
10.0% appreciation · 0.0% rent growth · sell at horizon
- IRR
- 21.5%
- Equity multiple
- 2.72×
- Total profit
- $124,943
- Equity at exit
- $233,238
- IRR
- 18.8%
- Equity multiple
- 6.04×
- Total profit
- $365,057
- Equity at exit
- $502,986
Cash invested: $72,492 (down + closing). Projections, not guarantees.
Landlord ↔ Tenant lean methodology
- Overall (STATE)
- 87 Strongly Landlord-Friendly
- State Florida
- 87 Strongly Landlord-Friendly · R+3
- County
- — inherits STATE
- City
- — inherits STATE
ZIP-level market 33974
- Home prices YoY
- 5.8%
- Rents YoY
- -4.7%
- Active inventory
- 2460
- Price-to-rent
- 10.4×
Monthly cashflow live
- Estimated rent
- $2,065 high interval (Pro) →
- Mortgage (P&I)
- −$1,358
- Tax est. 1.5%
- −$324 /mo · $3,884/yr
- Insurance
- −$108
- HOA
- −$0
- Vacancy / Maint / Mgmt
- −$434
- Net cashflow
- $-158
Break-even live
UW: 25.0% down · 7.5% · 30yr · 1.5% tax · 5.0% vac · 8.0% maint · 8.0% mgmt
Financing live
Cash to close
- Down payment
- $64,725
- Closing costs
- $7,767
- Reserves months
- —
- Total cash needed
- —
Loan-product check · same deal, 3 products live
Conventional
25% down · 7.5% · 30yr
- Down + closing
- —
- Monthly P&I
- —
- Monthly cashflow
- —
- DSCR
- —
- Eligible?
- —
Personal DTI + credit; lowest rate.
DSCR
20% down · 8.5% · 30yr
- Down + closing
- —
- Monthly P&I
- —
- Monthly cashflow
- —
- DSCR
- —
- Eligible?
- —
No personal income docs; deal must DSCR.
Hard money
10% down · 12.0% · 12mo
- Down + closing
- —
- Monthly P&I
- —
- Monthly cashflow
- —
- DSCR
- —
- Eligible?
- —
Short-term bridge; refi at stabilization.
Rent comps 40 comps
| Address | Beds | Baths | Sqft | Rent | $/sqft | DOM | Units | Dist |
|---|---|---|---|---|---|---|---|---|
| 947 Grant Blvd Lehigh Acres, FL | 4.0 | 2.0 | 1650 | $2,145 | $1.30 | 23d | 1 | 0.39mi |
| 382 McArthur Blvd Lehigh Acres, FL | 3.0 | 2.0 | 1055 | $2,200 | $2.09 | 23d | 1 | 0.47mi |
| 940 Belmont St E Lehigh Acres, FL | 4.0 | 2.0 | 1838 | $2,850 | $1.55 | 23d | 1 | 0.49mi |
| 232 Fowler Ave Lehigh Acres, FL | 3.0 | 2.0 | 1582 | $2,664 | $1.68 | 23d | 1 | 0.58mi |
| 444 Genoa Ave S Lehigh Acres, FL | 4.0 | 2.0 | 1389 | $1,750 | $1.26 | 21d | 1 | 0.70mi |
| 825 Carbon St E Lehigh Acres, FL | 3.0 | 2.0 | 1582 | $2,300 | $1.45 | 23d | 1 | 0.79mi |
| 459 Lockport Ave S Lehigh Acres, FL | 3.0 | 2.0 | 1650 | $2,000 | $1.21 | 23d | 1 | 0.80mi |
| 350 Limerick Ave S Lehigh Acres, FL | 3.0 | 2.0 | 1199 | $1,800 | $1.50 | 3d | 1 | 0.82mi |
| 333 Bell Blvd S Lehigh Acres, FL | 3.0 | 2.0 | 1114 | $1,300 | $1.17 | 3d | 1 | 0.84mi |
| 970 Lakeside Dr Lehigh Acres, FL | 3.0 | 2.0 | 1325 | $1,800 | $1.36 | 19d | 1 | 0.85mi |
| 1125 Chipley St Unit 1 Lehigh Acres, FL | 2.0 | 1.0 | 950 | $1,350 | $1.42 | 3d | 1 | 0.86mi |
| 1122 Randolph St Lehigh Acres, FL | 3.0 | 2.0 | 1550 | $2,100 | $1.35 | 23d | 1 | 0.86mi |
| 912 Anthony St E Lehigh Acres, FL | 3.0 | 2.5 | 1548 | $1,890 | $1.22 | 15d | 1 | 0.87mi |
| 346 Bell Blvd S Lehigh Acres, FL | 3.0 | 2.0 | 1185 | $1,495 | $1.26 | 3d | 1 | 0.89mi |
| 346 Bell Blvd S Lehigh Acres, FL | 3.0 | 2.0 | 1185 | $1,495 | $1.26 | 14d | 1 | 0.89mi |
| 940 Sterling St E Lehigh Acres, FL | 4.0 | 2.0 | 1389 | $1,750 | $1.26 | 3d | 1 | 0.90mi |
| 442 Genoa Ave S Lehigh Acres, FL | 4.0 | 2.0 | 1365 | $1,750 | $1.28 | 3d | 1 | 0.90mi |
| 388 Bell Blvd S Lehigh Acres, FL | 3.0 | 2.0 | 1200 | $1,780 | $1.48 | 23d | 1 | 0.91mi |
| 1018 Kent St E Lehigh Acres, FL | 3.0 | 2.0 | 1600 | $2,000 | $1.25 | 15d | 1 | 0.93mi |
| 759 Cane St E Lehigh Acres, FL | 3.0 | 2.0 | 1169 | $1,950 | $1.67 | 3d | 1 | 0.97mi |
| 455 Bell Blvd Unit 1 Lehigh Acres, FL | 3.0 | 2.0 | 1142 | $1,600 | $1.40 | 23d | 1 | 0.97mi |
| 219 Beckley Dr Lehigh Acres, FL | 3.0 | 2.5 | 1548 | $1,890 | $1.22 | 15d | 1 | 0.98mi |
| 750 Cane St E Lehigh Acres, FL | 4.0 | 3.0 | 1537 | $2,800 | $1.82 | 3d | 1 | 1.04mi |
| 327 Lester Ave S Lehigh Acres, FL | 4.0 | 2.0 | 1577 | $2,195 | $1.39 | 1d | 1 | 1.07mi |
| 230 E Malden Ave S Lehigh Acres, FL | 4.0 | 2.0 | 1833 | $1,875 | $1.02 | 23d | 1 | 1.09mi |
| 508 Bell Blvd S Lehigh Acres, FL | 3.0 | 2.0 | 1200 | $1,800 | $1.50 | 23d | 1 | 1.14mi |
| 538 Flamingo Ave S Lehigh Acres, FL | 3.0 | 2.0 | 1272 | $1,791 | $1.41 | 3d | 1 | 1.16mi |
| 538 Cypress Ave S Lehigh Acres, FL | 3.0 | 2.0 | 1055 | $1,699 | $1.61 | 2d | 1 | 1.22mi |
| 541 Hawthorne Ave S Lehigh Acres, FL | 3.0 | 2.0 | 1634 | $1,921 | $1.18 | 3d | 1 | 1.22mi |
| 727 Cane St E Lehigh Acres, FL | 3.0 | 2.0 | 1582 | $2,000 | $1.26 | 23d | 1 | 1.22mi |
| 718 Sunrise Blvd Lehigh Acres, FL | 3.0 | 2.0 | 1100 | $1,610 | $1.46 | 23d | 1 | 1.29mi |
| 459 Lackey Ave S Lehigh Acres, FL | 4.0 | 2.0 | 1833 | $1,825 | $1.00 | 1d | 1 | 1.29mi |
| 954 Pilgrim St E Lehigh Acres, FL | 3.0 | 2.0 | 1246 | $1,625 | $1.30 | 1d | 1 | 1.30mi |
| 1226 Chrisholm St Lehigh Acres, FL | 4.0 | 2.0 | 1811 | $2,500 | $1.38 | 1d | 1 | 1.32mi |
| 573 Bell Blvd S Lehigh Acres, FL | 3.0 | 2.0 | 1218 | $1,900 | $1.56 | 14d | 1 | 1.33mi |
| 1228 Chrisholm St Lehigh Acres, FL | 4.0 | 2.0 | 1811 | $2,500 | $1.38 | 1d | 1 | 1.34mi |
| 713 Cardinal St E Lehigh Acres, FL | 3.0 | 2.0 | 1100 | $1,635 | $1.49 | 3d | 1 | 1.35mi |
| 1440 Graham Cir Lehigh Acres, FL | 3.0 | 2.0 | 1767 | $2,300 | $1.30 | 23d | 1 | 1.38mi |
| 129 Wanatah Ave Lehigh Acres, FL | 4.0 | 2.0 | 1798 | $1,911 | $1.06 | 3d | 1 | 1.38mi |
| 720 Chavers St Lehigh Acres, FL | 3.0 | 2.0 | 1547 | $2,200 | $1.42 | 23d | 1 | 1.44mi |
Listing history 7 events
-
2026-05-21status Pending
-
2026-04-30price $258,900
-
2026-04-11price $259,900
-
2026-02-26price $262,500
-
2026-02-06price $264,900
-
2025-12-22$269,900 Active
-
2024-11-02soldstatus $30,000
ⓘ Source: listings_history table (triggers on properties + properties_extension) + one-shot
backfill from property_details.listing_events for pre-trigger history.
Climate risk First Street
- Flood 1/10 Low FEMA zone X (unshaded) · 0% chance over 30 yrs
- Wildfire 3/10 Moderate
- Heat 9/10 Extreme 7 d/yr ≥108°F today · 26 d/yr by 30 yrs out
- Wind 10/10 Extreme 99% chance of damaging wind over 30 yrs
- Air quality 2/10 Low 1 unhealthy d/yr today · 2 by 30 yrs out
Nearby sold comps map
Loading sold comps map…
Walkable amenities ~0.75 mi
Loading nearby amenities…
Taxation est. · year 1
- Rental income
- $24,783
- − Mortgage interest
- −$14,502
- − Property taxes
- −$3,884
- − Insurance
- −$1,294
- − Repairs & maintenance
- −$1,983
- − Management
- −$1,983
- − Depreciation
- −$7,532
- Taxable loss
- −$6,394
- Est. tax savings @ 24.0%
- +$1,535
- After-tax cash flow
- $-357/yr
For passive investors: Depreciation is non-cash, so a rental often shows a tax loss while cash-flowing — sheltering income. Rental losses are passive: they offset passive income freely, and up to $25,000/yr can offset ordinary (W-2) income if you actively participate and your MAGI is under $100k (phasing out to $0 by $150k); unused losses carry forward. On sale, claimed depreciation is recaptured at up to 25%, and gains may owe capital-gains tax (a 1031 exchange can defer both). Figures are a year-1 estimate at your 24.0% rate — not tax advice; consult a CPA.
Schools (NCES district)
- District
- Lee
- NCES district ID
- 1201080
- Math proficiency
- 47% ▼ -11.00%
- Reading proficiency
- 50% ▼ -4.00%
- Median HH income
- $49,518
- Composite
- 41.49/100
- National rank
- #3458
- State rank
- #42 of 73 in FL
Livability — Lehigh Acres
- Score
- 59/100
- State rank
- #826
- US rank
- #20055
Category grades
Schools grade is shown separately in the Schools card above.
Census & demographics
- Census place
- Lehigh Acres, FL
- County
- Lee County · 788,662 people
- City population
- 130,638
- Metro
- Cape Coral-Fort Myers, FL
- Population (ZIP)
- 19,927
- Household income
- $72,192
- Rent vs Own
- Severe rent burden
- 434.0
Population outlook (Lee County) Hauer SSP2
- Today (2025)
- 871,946 people
- By 2030
- 955,468 · +9.6%
- By 2040
- 1,113,587 · +27.7%
- By 2050
- 1,256,891 · +44.1%
- By 2075
- 1,560,270 · +78.9%
- By 2100
- 1,726,848 · +98.0%
Race, ethnicity, and origin ACS 2023
- Neighborhood character
- Diverse neighborhood (Simpson 0.64)
- Race & ethnicity
- Hispanic / Latino 52% Two or more races 31% White 26% Black 18%
- Hispanic origin (detail)
- Mexican 12% Puerto Rican 7% Cuban 20% Dominican 4%
- Common ancestry
- Hispanic 7% Italian 1% Portuguese 1%
- Foreign-born
- 32% · Canada, Jamaica
- Languages at home
- 48% English-only · Spanish 43% French/Haitian/Cajun 7% Other Indo-European 1%
Political lean MEDSL · Lee
- 2024 margin
- Strong R (+28.4) · D 35.5% · R 63.9%
- 2008→2024 swing
- -18.0pp toward R · 2008: -10.4pp · 2024: -28.4pp
- All cycles
- 2024: R+28.4 2020: R+19.2 2016: R+20.4 2012: R+16.6 2008: R+10.4
Not yet ingested
- Civics
- —
Market trends
- HPI YoY
- ▲ 16.53%
- Current HPI
- 303.3399
- Rent YoY
- ▼ -4.68%
- Metro
- Cape Coral-Fort Myers, FL
- State GDP YoY
- ▲ 3.28%
- F500 in state
- 36
Industry mix (Fortune 500 HQ in FL)
| Industry | F500 HQs | Revenue |
|---|---|---|
| Industrial Technology | 2 | $29B |
|
||
| Insurance | 2 | $17B |
|
||
| Retail | 1 | $60B |
|
||
| Technology Distribution | 1 | $58B |
|
||
| Homebuilding | 1 | $35B |
|
||
| Technology Manufacturing | 1 | $35B |
|
||
Price history
+763.0% since first listed7 events — show timeline
- 2026-05-21 Pending — FORTMLS
- 2026-04-30 Price Changed $258,900 FORTMLS
- 2026-04-11 Price Changed $259,900 FORTMLS
- 2026-02-26 Price Changed $262,500 FORTMLS
- 2026-02-06 Price Changed $264,900 FORTMLS
- 2025-12-22 Listed $269,900 FORTMLS
- 2024-11-02 Sold (Public Records) $30,000 Public Records
Property tax history
+2.0%/yrLatest (2025): $444 · -4.7% YoY. Source: county tax records.
Cash-flow waterfall
monthlySold comps — $/sqft
last 12 mo · ≤1 miLoading sold comps…