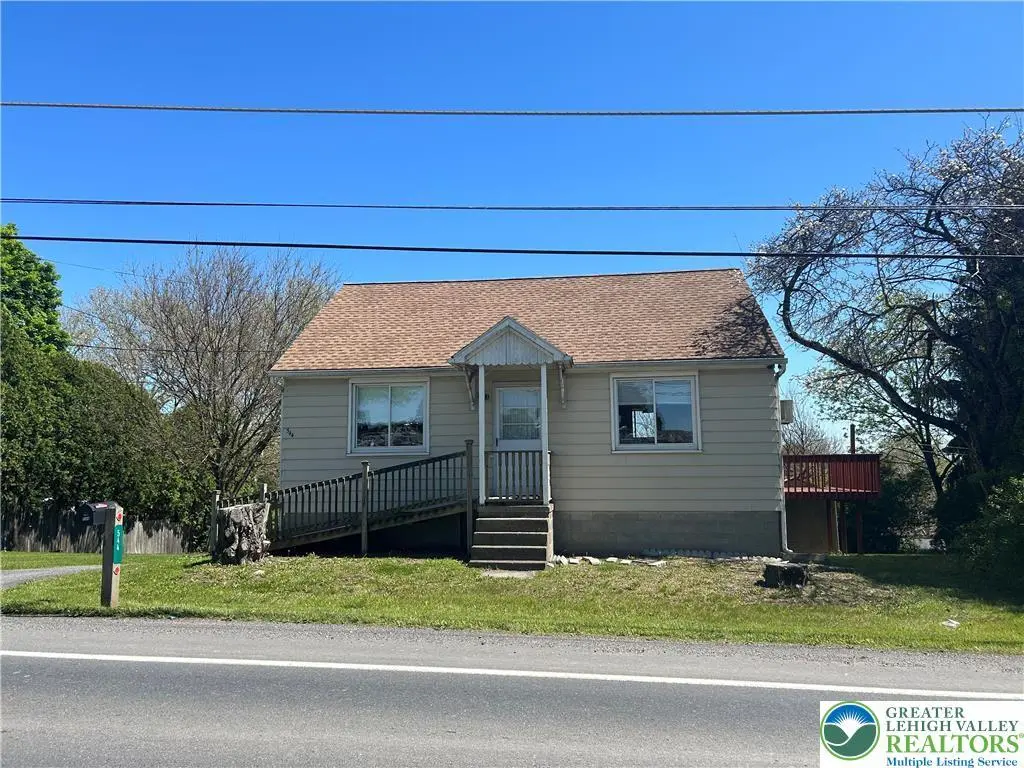
544 Moorestown Dr · Chapman, PA
Flood risk 1/10 · Minimal
- FEMA flood zone
- X (unshaded)
- Chance of flooding over 30 yrs
- 0.0%
- Est. flood insurance / yr
- $473 – $860
Fire risk 1/10 · Minimal
- Est. fire insurance / yr
- $511 – $949
Heat risk 4/10 · Minor
- Hot days now (above 96°F)
- 7 days/yr
- Hot days in 30 yrs
- 15 days/yr
Wind risk 4/10 · Minor
- Chance of severe wind over 30 yrs
- 17.0%
Air-quality risk 2/10 · Minimal
- Unhealthy air days now
- 1 days/yr
- Unhealthy air days in 30 yrs
- 3 days/yr
Risk factors via First Street. Map © Google.
Why this score? — see what drove the D grade
The composite is a weighted blend of 9 inputs, each scored 0–100. Each bar is that input's sub-score; the figure is the points it added to the 100-point composite (weight × sub-score).
- ARV discount +15.0/15.0
- Cash flow +9.3/30.0
- Schools +4.4/10.0
- Livability +3.3/5.0
- DSCR +2.6/10.0
- 1% rule +2.5/10.0
- Rent growth +2.5/5.0
- Condition / age +2.5/5.0
- Appreciation +0.0/10.0
$199,900
🖨 Deal sheet (PDF) 📄 Offer letter ✓ Due diligence
Listing remarks
* * MULTIPLE OFFERS RECEIVED. ALL HIGHEST AND BEST OFFERS DUE BY SUNDAY 5/17/26 @5PM * * 2-bedroom ranch home now available in Moore Township. Enter into the living room featuring wall-to-wall carpeting and a wall A/C unit. The living room flows into the eat-in kitchen with hardwood flooring, gas cooktop, electric oven, and refrigerator included. Just off the kitchen is a rear deck overlooking the property — a great spot to sit outside and enjoy the setting. The home offers two bedrooms, with one located toward the front of the home and the second positioned toward the rear. A full bathroom is situated between the kitchen and rear bedroom. The large unfinished basement provides lau
Key facts
- Living room
- Eat-in kitchen
- Rear deck
Tags
Property features AI
Exterior
- Parking: Attached garage (1 car); Driveway; Off-street parking; Built-in garage
- Utilities: Well water; Septic tank
- Home design: Single-story; Above-grade finished area: 800 (listed)
- Construction: Aluminum siding; Asphalt/fiberglass roof; Year built: Unknown; Full basement foundation
- Exterior features: Deck; Lot about 0.26 acres; Zoned Sr-Suburban Residential
Interior
- Kitchen: Electric oven; Gas cooktop; Refrigerator
- Bedrooms: Total rooms: 4
- Flooring: Carpet; Hardwood
- Bathrooms: 1 full bathroom
- Heating & cooling: Oil heat; Wall unit cooling
- Interior features: Dining area; Eat-in kitchen; Full basement
- Laundry & utility: Washer hookup; Dryer hookup; Oil water heater
Neighborhood map
What this means for you Summary
Snapshot
- This is a 2-bed/1.0-bath single-family listed at $200k.
Deal economics
- At list price, monthly cash flow is $-145 ($-2k/yr) — negative.
- To cash-flow at today's rent, offer at most $174k (12.8% below list).
- To meet the 1% rule (rent ≥ 1% of price), the offer needs to be $149k (25.5% below list).
- Recommended offer: $149k (25.5% below list) — sets the bar for 1% rule.
- Cap rate 5.4% vs local median 1.4% in Chapman — top-decile yield for the area; either an underpriced asset or a hidden risk that comps aren't pricing in. Stress-test before assuming the spread holds.
Location & tenants
- Location reads 66/100 on livability (#1,053 in PA) — a middle-class / working-renter tenant base. Strengths: cost of living A+, housing A+, crime B; Watch: employment C-, amenities F, commute F.
- Northampton Area SD (suburban): math 47% / reading 54% proficiency, ranked #153 of 539 in PA (top 28%) — acceptable for families but not a draw, mixed tenant base, ~2y average lease.
- Zoned schools: Moore El Sch (math 64% / reading 74%, grade A-, #151 of 1,518 statewide, top 12%, 354 students, 30% FRL); Northampton Area Ms (math 24% / reading 46%, grade F, #322 of 512 statewide, top 64%, 1,256 students, 42% FRL); Northampton Area Hs (math 60% / reading 24%, grade F, #230 of 437 statewide, top 53%, 1,862 students, 31% FRL).
- Market conditions: 62 active listings in the ZIP; 567 units permitted in Northampton County in 2024 (151 in 5+ unit buildings).
Forward outlook
- Local home prices are declining (-3.0%/yr); year-one equity from $1k of loan paydown is wiped out by about $6k of value loss. Plan a longer hold.
Negotiation context
- Only 5 days on market — expect competitive offers; lowballing is unlikely to land.
- Current owner paid $20k; list at $200k implies a 899% gain — meaningful room to come down on a strong offer.
Risks & watch-outs
- Watch-outs: built in 1950 — expect roof / HVAC / electrical / plumbing capex.
Questions for the listing agent
- What do current leases actually rent for vs. the listed asking? Can we see a recent rent roll and the last 12 months of T-12 income?
- Built in 1950 — when were the roof, HVAC, electrical panel, plumbing, and water heater last replaced?
- Is there a deadline driving the sale (1031 exchange, divorce, estate, relocation)? That informs how much negotiation room exists.
- Schools are D-rated, which usually means shorter tenancies and higher turnover. Who's the typical renter profile here, and what's been the actual vacancy rate?
- The area grade is low — what's the realistic commute time and amenity access for the typical tenant pool here? Any planned neighborhood developments (good or bad) we should know about?
- What's the average days-on-market for RENTAL listings here right now (not sales)? A rising rental-DOM trend means longer vacancies and softer asking-rent achievability than the comps imply.
- What's the recent tenant-quality profile in this submarket — average credit score on applications, eviction rate, late-payment / NSF rate, and stable-employment percentage? A property-management company in the area should have these aggregated.
- How much new for-sale + rental construction is in the pipeline within 1–3 miles? Heavy new supply typically softens prices + rents 12–24 months out; constrained supply supports both.
Investment metrics
- 1% rule
- 0.75% ✗
- Cap rate
- 5.42%
- Cash-on-cash
- -3.10%
- DSCR
- 0.86
- GRM
- 11.2
CMA / ARV
- ARV (median comp)
- $264,905
- List price
- $199,900
- Delta
- -24.54%
- Verdict
- UNDERPRICED
- Comps
- 6 within 2.0 mi
Projected returns pro-forma
-3.0% appreciation · 3.0% rent growth · sell at horizon
- IRR
- -21.5%
- Equity multiple
- 0.26×
- Total profit
- $-41,615
- Equity at exit
- $29,806
- IRR
- -15.2%
- Equity multiple
- 0.14×
- Total profit
- $-48,153
- Equity at exit
- $17,284
Cash invested: $55,972 (down + closing). Projections, not guarantees.
Landlord ↔ Tenant lean methodology
- Overall (STATE)
- 62 Landlord-Friendly
- State Pennsylvania
- 62 Landlord-Friendly · EVEN
- County
- — inherits STATE
- City
- — inherits STATE
ZIP-level market 18014
- Active inventory
- 62
- Price-to-rent
- 11.2×
Monthly cashflow live
- Estimated rent
- $1,490 medium interval (Pro) →
- Mortgage (P&I)
- −$1,048
- Tax from tax record
- −$190 /mo · $2,281/yr
- Insurance
- −$83
- HOA
- −$0
- Vacancy / Maint / Mgmt
- −$313
- Net cashflow
- $-145
Break-even live
Sensitivity live
| Price | -10% $-31 | -5% $-88 | +0% $-145 | +5% $-201 | +10% $-258 |
|---|---|---|---|---|---|
| Rent | -10% $-262 | -5% $-203 | +0% $-145 | +5% $-86 | +10% $-27 |
| Rate | -1.0pp $-44 | -0.5pp $-94 | base $-145 | +0.5pp $-196 | +1.0pp $-249 |
UW: 25.0% down · 7.5% · 30yr · 1.5% tax · 5.0% vac · 8.0% maint · 8.0% mgmt
Financing live
Cash to close
- Down payment
- $49,975
- Closing costs
- $5,997
- Reserves months
- —
- Total cash needed
- —
Loan-product check · same deal, 3 products live
Conventional
25% down · 7.5% · 30yr
- Down + closing
- —
- Monthly P&I
- —
- Monthly cashflow
- —
- DSCR
- —
- Eligible?
- —
Personal DTI + credit; lowest rate.
DSCR
20% down · 8.5% · 30yr
- Down + closing
- —
- Monthly P&I
- —
- Monthly cashflow
- —
- DSCR
- —
- Eligible?
- —
No personal income docs; deal must DSCR.
Hard money
10% down · 12.0% · 12mo
- Down + closing
- —
- Monthly P&I
- —
- Monthly cashflow
- —
- DSCR
- —
- Eligible?
- —
Short-term bridge; refi at stabilization.
Listing history 3 events
-
2026-05-18status Pending 1052-char remark
-
2026-05-13$199,900 Active 1052-char remark
-
1980-09-01soldstatus $20,000
ⓘ Source: listings_history table (triggers on properties + properties_extension) + one-shot
backfill from property_details.listing_events for pre-trigger history.
Tax reassessment forecast PA · Partial reset (capped growth)
- Current annual tax
- $2,281 · $190/mo
- Projected year-2 tax
- $2,720 · $227/mo
- Expected delta
- +$439/yr (+$37/mo · 19.2%)
ⓘ Screening estimate from a state-policy table — verify with the county assessor before closing.
Climate risk First Street
- Flood 1/10 Low FEMA zone X (unshaded) · 0% chance over 30 yrs
- Wildfire 1/10 Low
- Heat 4/10 Moderate 7 d/yr ≥96°F today · 15 d/yr by 30 yrs out
- Wind 4/10 Moderate 17% chance of damaging wind over 30 yrs
- Air quality 2/10 Low 1 unhealthy d/yr today · 3 by 30 yrs out
Nearby sold comps map
Loading sold comps map…
Walkable amenities ~0.75 mi
Loading nearby amenities…
Taxation est. · year 1
- Rental income
- $17,880
- − Mortgage interest
- −$11,198
- − Property taxes
- −$2,281
- − Insurance
- −$1,000
- − Repairs & maintenance
- −$1,430
- − Management
- −$1,430
- − Depreciation
- −$5,815
- Taxable loss
- −$5,274
- Est. tax savings @ 24.0%
- +$1,266
- After-tax cash flow
- $-469/yr
For passive investors: Depreciation is non-cash, so a rental often shows a tax loss while cash-flowing — sheltering income. Rental losses are passive: they offset passive income freely, and up to $25,000/yr can offset ordinary (W-2) income if you actively participate and your MAGI is under $100k (phasing out to $0 by $150k); unused losses carry forward. On sale, claimed depreciation is recaptured at up to 25%, and gains may owe capital-gains tax (a 1031 exchange can defer both). Figures are a year-1 estimate at your 24.0% rate — not tax advice; consult a CPA.
Schools (NCES district)
- District
- Northampton Area SD
- NCES district ID
- 4217370
- Math proficiency
- 47% ▼ -1.00%
- Reading proficiency
- 54% ▼ -13.00%
- Median HH income
- $62,326
- Composite
- 44.35/100
- National rank
- #2822
- State rank
- #153 of 539 in PA
Livability — Chapman
- Score
- 66/100
- State rank
- #1053
- US rank
- #11836
Category grades
Schools grade is shown separately in the Schools card above.
Census & demographics
- Population (ZIP)
- 12,474
Population outlook (Northampton County) Hauer SSP2
- Today (2025)
- 312,227 people
- By 2030
- 314,769 · +0.8%
- By 2040
- 316,914 · +1.5%
- By 2050
- 318,037 · +1.9%
- By 2075
- 334,003 · +7.0%
- By 2100
- 344,696 · +10.4%
Race, ethnicity, and origin ACS 2023
- Neighborhood character
- Predominantly White (88%)
- Race & ethnicity
- White 88% Hispanic / Latino 6% Two or more races 4% Black 3%
- Hispanic origin (detail)
- Puerto Rican 3%
- Common ancestry
- Romanian 4% Polish 3% Danish 3%
- Foreign-born
- 2% · Canada
- Languages at home
- 95% English-only · Spanish 3% Other Indo-European 1%
Political lean MEDSL · Northampton
- 2024 margin
- Toss-up / Even · D 48.6% · R 50.4%
- 2008→2024 swing
- -14.1pp toward R · 2008: 12.3pp · 2024: -1.8pp
- All cycles
- 2024: R+1.8 2020: D+0.7 2016: R+3.8 2012: D+4.6 2008: D+12.3
Not yet ingested
- Civics
- —
Market trends
- HPI YoY
- ▼ -145.54%
- Current HPI
- 212.4688
- Rent YoY
- —
- Metro
- —
- State GDP YoY
- ▲ 1.68%
- F500 in state
- 34
Industry mix (Fortune 500 HQ in PA)
| Industry | F500 HQs | Revenue |
|---|---|---|
| Healthcare | 2 | $309B |
|
||
| Insurance | 2 | $27B |
|
||
| Telecommunications / Media | 1 | $124B |
|
||
| Industrial Distribution | 1 | $22B |
|
||
| Financial Services | 1 | $20B |
|
||
| Chemicals / Materials | 1 | $18B |
|
||
Price history
+899.5% since first listed3 events — show timeline
- 2026-05-18 Pending — GLVRMLS
- 2026-05-13 Listed $199,900 GLVRMLS
- 1980-09-01 Sold (Public Records) $20,000 Public Records
Property tax history
+1.8%/yrLatest (2026): $2,281 · +3.0% YoY. Source: county tax records.
Cash-flow waterfall
monthlySold comps — $/sqft
last 12 mo · ≤1 miLoading sold comps…