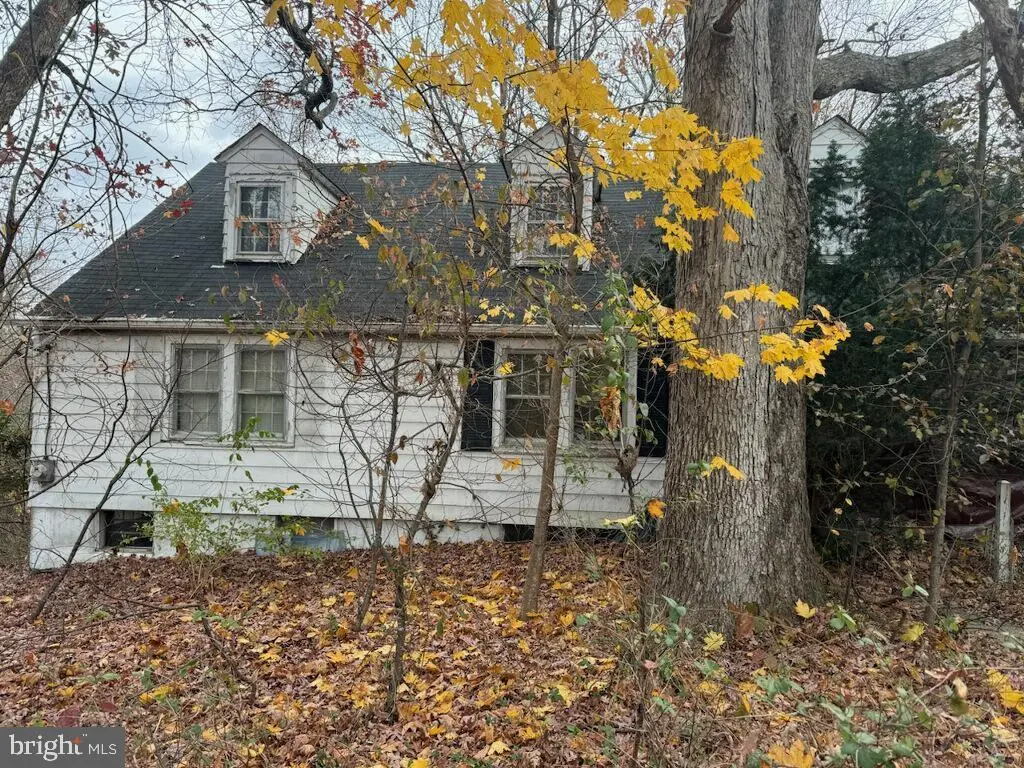
3806 James St · Suitland, MD
Flood risk 1/10 · Minimal
- FEMA flood zone
- X (unshaded)
- Chance of flooding over 30 yrs
- 0.0%
- Est. flood insurance / yr
- $473 – $860
Fire risk 1/10 · Minimal
- Est. fire insurance / yr
- $755 – $1,403
Heat risk 7/10 · Major
- Hot days now (above 103°F)
- 7 days/yr
- Hot days in 30 yrs
- 16 days/yr
Wind risk 4/10 · Minor
- Chance of severe wind over 30 yrs
- 21.0%
Air-quality risk 3/10 · Minor
- Unhealthy air days now
- 2 days/yr
- Unhealthy air days in 30 yrs
- 3 days/yr
Risk factors via First Street. Map © Google.
Why this score? — see what drove the C+ grade
The composite is a weighted blend of 9 inputs, each scored 0–100. Each bar is that input's sub-score; the figure is the points it added to the 100-point composite (weight × sub-score).
- Cash flow +21.7/30.0
- ARV discount +15.0/15.0
- DSCR +6.9/10.0
- 1% rule +6.6/10.0
- Livability +3.5/5.0
- Condition / age +2.5/5.0
- Rent growth +2.2/5.0
- Schools +1.7/10.0
- Appreciation +0.0/10.0
$220,000
🖨 Deal sheet (PDF) 📄 Offer letter ✓ Due diligence
Listing remarks
Investor and Rehabber Opportunity! Estate sale being sold strictly AS-IS, WHERE-IS. This unique single-family home is situated on a private, secluded 0.38-acre lot—nearly double the size of many surrounding parcels—offering exceptional potential for renovation, expansion, redevelopment, or long-term investment. The property requires substantial rehabilitation and is best suited for experienced investors, builders, contractors, or developers seeking their next project. The oversized lot is a standout feature, providing opportunities that are difficult to find in this area. Conveniently located approximately 30 minutes from Washington, DC, with quick access to major highways and
Key facts
- 0.38 acre lot
- Built 1939
- Listed 8 days
Property features AI
Exterior
- Parking: On-street parking
- Utilities: Public water; Public sewer
- Home design: Detached property; Year built information from assessor
- Construction: Frame construction; Other foundation details
- Exterior features: Detached structure; Other structures both above grade and below grade; Tidal water not present
Interior
- Bedrooms: Three bedrooms on the first upper level; One bedroom on the main level
- Bathrooms: Two full bathrooms total (one full on main level, one full on first upper level)
- Heating & cooling: Oil heating
- Interior features: No basement; Finished above-grade living area approximately 1,677 (per assessor); Unfinished below-grade area approximately 978 (per assessor); Major rehab needed / below average condition; Fee simple ownership; Not in a federal flood zone
Neighborhood map
What this means for you Summary
Snapshot
- This is a 4-bed/2.0-bath single-family listed at $220k.
Deal economics
- At list price, monthly cash flow is $338 ($4k/yr) — positive.
- The deal already cash-flows at list — no discount required.
- Meets the 1% rule at list price ($3k rent vs $220k).
- Cap rate 8.1% vs local median 4.9% in Suitland — top-decile yield for the area; either an underpriced asset or a hidden risk that comps aren't pricing in. Stress-test before assuming the spread holds.
Location & tenants
- Location reads 69/100 on livability (#189 in MD) — a middle-class / working-renter tenant base. Strengths: commute A+, housing A+, employment B; Watch: health & safety C-, crime F, amenities D-.
- Prince George'S County Public Schools (suburban): math 8% / reading 24% proficiency, ranked #21 of 24 in MD (top 88%) — low school quality limits family demand, transient renter base, plan for 1-2y turnover.
- Zoned schools: William Beanes Elementary (math 2% / reading 8%, grade F, #766 of 860 statewide, top 93%, 382 students, 66% FRL); Drew Freeman Middle (math 2% / reading 12%, grade F, #219 of 225 statewide, top 98%, 833 students, 67% FRL).
- Market conditions: Rents soft (-1.2%/yr); 96 active listings in the ZIP; 28 comparable units currently listed for rent nearby; rentals at typical pace (median 20d on market — plan ~3-4 weeks tenant-placement turnaround); solid renter incomes; 1,481 units permitted in Prince George's County in 2024 (0 in 5+ unit buildings).
- This rent runs 39% of the median local income ($79k/yr) — at the standard rent-burdened threshold; future hikes will face affordability resistance.
Forward outlook
- Local home prices are declining (-3.0%/yr); year-one equity from $2k of loan paydown is wiped out by about $7k of value loss. Plan a longer hold.
- Prince George's County population projected at +18% by 2050 — long-run rental-demand tailwind backs the buy-and-hold thesis.
Negotiation context
- Only 8 days on market — expect competitive offers; lowballing is unlikely to land.
- Current owner paid $80k; list at $220k implies a 175% gain — meaningful room to come down on a strong offer.
Risks & watch-outs
- Watch-outs: built in 1939 — expect roof / HVAC / electrical / plumbing capex.
- Climate carrying-cost: extreme-heat days projected 7→16/yr by 2055 (HVAC capex compounding) — expect insurance premiums to compound above CPI over the hold.
Questions for the listing agent
- Built in 1939 — when were the roof, HVAC, electrical panel, plumbing, and water heater last replaced?
- Is there a deadline driving the sale (1031 exchange, divorce, estate, relocation)? That informs how much negotiation room exists.
- Schools are F-rated, which usually means shorter tenancies and higher turnover. Who's the typical renter profile here, and what's been the actual vacancy rate?
- Crime grade is F in this area — have there been break-ins, vandalism, or insurance claims at this property in the last 3 years? What carrier currently insures it and at what premium?
- What's the average days-on-market for RENTAL listings here right now (not sales)? A rising rental-DOM trend means longer vacancies and softer asking-rent achievability than the comps imply.
- What's the recent tenant-quality profile in this submarket — average credit score on applications, eviction rate, late-payment / NSF rate, and stable-employment percentage? A property-management company in the area should have these aggregated.
- How much new for-sale + rental construction is in the pipeline within 1–3 miles? Heavy new supply typically softens prices + rents 12–24 months out; constrained supply supports both.
Investment metrics
- 1% rule
- 1.16% ✓
- Cap rate
- 8.14%
- Cash-on-cash
- 6.59%
- DSCR
- 1.29
- GRM
- 7.2
CMA / ARV
- ARV (on-the-fly)
- $404,157
- Comps found
- 11
Show comp detail 11 sales within ~0.75 mi
| Address | Dist | Beds/Ba | Sqft | Sold | Price | $/sf | Match |
|---|---|---|---|---|---|---|---|
| 6505 Woodland Rd | 0.49mi | 5/2.0 (+1) | 1,668 (-0%) | 4mo | $422,500 | $253 | 68 |
| 4308 Offut Dr | 0.43mi | 3/2.0 (-1) | 1,800 (+7%) | 5mo | $380,000 | $211 | 58 |
| 3728 Dianna Rd | 0.68mi | 5/3.0 (+1) | 1,666 (-1%) | 6mo | $455,000 | $273 | 53 |
| 6305 Suitland Rd | 0.50mi | 4/2.5 | 1,618 (-4%) | 20mo | $445,000 | $275 | 52 |
| 4311 Elgin Ct | 0.72mi | 3/2.5 (-1) | 1,688 (+1%) | 9mo | $407,000 | $241 | 51 |
| 3905 Walls Ln | 0.30mi | 3/2.0 (-1) | 1,872 (+12%) | 15mo | $311,850 | $167 | 49 |
| 6620 Pine Grove Dr | 0.72mi | 4/2.0 | 1,800 (+7%) | 8mo | $405,000 | $225 | 47 |
| 4312 Frank St | 0.46mi | 4/3.5 | 1,560 (-7%) | 18mo | $480,000 | $308 | 46 |
| 3701 Walnut Ln | 0.67mi | 4/2.0 | 1,820 (+8%) | 13mo | $375,000 | $206 | 44 |
| 6300 Skyline Ter | 0.53mi | 3/3.0 (-1) | 1,751 (+4%) | 21mo | $400,000 | $228 | 42 |
| 4505 John St | 0.68mi | 3/3.5 (-1) | 1,440 (-14%) | 1mo | $370,000 | $257 | 33 |
Match score weights: distance 35% · size 25% · config 20% · recency 20%. Top-matched comps best support the ARV.
Projected returns pro-forma
-3.0% appreciation · 0.0% rent growth · sell at horizon
- IRR
- -9.8%
- Equity multiple
- 0.65×
- Total profit
- $-21,429
- Equity at exit
- $32,803
- IRR
- -5.6%
- Equity multiple
- 0.69×
- Total profit
- $-19,227
- Equity at exit
- $19,022
Cash invested: $61,600 (down + closing). Projections, not guarantees.
Landlord ↔ Tenant lean methodology
- Overall (STATE)
- 27 Tenant-Leaning
- State Maryland
- 27 Tenant-Leaning · D+14
- County
- — inherits STATE
- City
- — inherits STATE
ZIP-level market 20746
- Home prices YoY
- -15.7%
- Rents YoY
- -1.2%
- Active inventory
- 96
- Price-to-rent
- 7.2×
Monthly cashflow live
- Estimated rent
- $2,549 high interval (Pro) →
- Mortgage (P&I)
- −$1,154
- Tax from tax record
- −$430 /mo · $5,158/yr
- Insurance
- −$92
- HOA
- −$0
- Vacancy / Maint / Mgmt
- −$535
- Net cashflow
- $338
Break-even live
Sensitivity live
| Price | -10% $463 | -5% $401 | +0% $338 | +5% $276 | +10% $214 |
|---|---|---|---|---|---|
| Rent | -10% $137 | -5% $238 | +0% $338 | +5% $439 | +10% $540 |
| Rate | -1.0pp $449 | -0.5pp $394 | base $338 | +0.5pp $281 | +1.0pp $223 |
UW: 25.0% down · 7.5% · 30yr · 1.5% tax · 5.0% vac · 8.0% maint · 8.0% mgmt
Financing live
Cash to close
- Down payment
- $55,000
- Closing costs
- $6,600
- Reserves months
- —
- Total cash needed
- —
Loan-product check · same deal, 3 products live
Conventional
25% down · 7.5% · 30yr
- Down + closing
- —
- Monthly P&I
- —
- Monthly cashflow
- —
- DSCR
- —
- Eligible?
- —
Personal DTI + credit; lowest rate.
DSCR
20% down · 8.5% · 30yr
- Down + closing
- —
- Monthly P&I
- —
- Monthly cashflow
- —
- DSCR
- —
- Eligible?
- —
No personal income docs; deal must DSCR.
Hard money
10% down · 12.0% · 12mo
- Down + closing
- —
- Monthly P&I
- —
- Monthly cashflow
- —
- DSCR
- —
- Eligible?
- —
Short-term bridge; refi at stabilization.
Rent comps 28 comps
| Address | Beds | Baths | Sqft | Rent | $/sqft | DOM | Units | Dist |
|---|---|---|---|---|---|---|---|---|
| 3616 Community Dr District Heights, MD | 4.0 | 2.5 | 1600 | $2,550 | $1.59 | 14d | 1 | 0.29mi |
| 3516 Community Dr District Heights, MD | 3.0 | 2.0 | 1096 | $1,500 | $1.37 | 6d | 1 | 0.33mi |
| 6512 Cricket Pl District Heights, MD | 3.0 | 2.0 | 1220 | $2,500 | $2.05 | 45d | 1 | 0.46mi |
| 5546 Capital Gateway Dr #396 Suitland, MD | 3.0 | 2.5 | 2154 | $3,100 | $1.44 | 25d | 1 | 0.54mi |
| 4400 Telfair Blvd Suitland, MD | 1.0–3.0 | 1.0–2.0 | 1157 | $2,949 | $2.55 | 0d | 13 | 0.59mi |
| 3332 Princess Stephanie Ct District Heights, MD | 3.0 | 2.5 | 1292 | $2,900 | $2.24 | 20d | 1 | 0.61mi |
| 6501 Hil Mar Dr District Heights, MD | 1.0–3.0 | 1.0–1.5 | 1014 | $2,025 | $2.00 | 45d | 27 | 0.62mi |
| 4411 Reamy Dr Suitland, MD | 4.0 | 3.0 | 1248 | $2,750 | $2.20 | 20d | 1 | 0.64mi |
| 4324 Talmadge Cir Suitland, MD | 3.0 | 2.5 | 1384 | $3,300 | $2.38 | 6d | 1 | 0.70mi |
| 6024 Surrey Square Ln District Heights, MD | 1.0–3.0 | 1.0–2.0 | 1059 | $2,102 | $1.98 | 0d | 23 | 0.75mi |
| 3817 Swann Rd #101 Suitland, MD | 3.0 | 2.0 | 1148 | $1,750 | $1.52 | 5d | 1 | 0.77mi |
| 3817 Swann Rd Suitland, MD | 3.0 | 2.0 | 1148 | $1,950 | $1.70 | 45d | 1 | 0.77mi |
| 3253 Walters Ln District Heights, MD | 1.0–3.0 | 1.0–1.5 | 941 | $2,060 | $2.19 | 0d | 16 | 0.78mi |
| 4701 Old Soper Rd Camp Springs, MD | 1.0–3.0 | 1.0–2.0 | 1300 | $3,158 | $2.43 | 0d | 17 | 0.98mi |
| 7211 Mount Forest Ter District Heights, MD | 4.0 | 3.0 | 1976 | $3,300 | $1.67 | 14d | 1 | 0.98mi |
| 3102 Romain Ct Suitland, MD | 3.0 | 2.5 | 1595 | $2,500 | $1.57 | 20d | 1 | 0.99mi |
| 3333 Swann Rd Suitland, MD | 3.0 | 3.0 | 1164 | $2,550 | $2.19 | 25d | 1 | 1.02mi |
| 6007 Rose Bay Dr District Heights, MD | 4.0 | 2.5 | 1996 | $2,795 | $1.40 | 45d | 1 | 1.03mi |
| 4901 Braymer Ave Suitland, MD | 4.0 | 2.5 | 1684 | $2,899 | $1.72 | 14d | 1 | 1.04mi |
| 3022 Bellamy Way #5 Suitland, MD | 3.0 | 2.0 | 2077 | $2,500 | $1.20 | 20d | 1 | 1.15mi |
| 7316 Donnell Pl Unit B2 District Heights, MD | 3.0 | 1.5 | 1150 | $2,295 | $2.00 | 25d | 1 | 1.19mi |
| 3000 Victory Ln Hillcrest Heights, MD | 2.0–3.0 | 1.0–2.0 | 1116 | $2,209 | $1.98 | 45d | 1 | 1.21mi |
| 7244 Donnell Pl Unit D2 District Heights, MD | 3.0 | 1.5 | 1108 | $1,900 | $1.71 | 45d | 1 | 1.24mi |
| 3400 Pearl Dr Suitland, MD | 1.0–3.0 | 1.0–1.5 | 851 | $1,911 | $2.25 | 0d | 6 | 1.35mi |
| 5327 Carswell Ave Suitland, MD | 3.0 | 1.0 | 868 | $1,875 | $2.16 | 45d | 9 | 1.36mi |
| 6412 Foster St District Heights, MD | 3.0 | 2.5 | 1920 | $2,500 | $1.30 | 45d | 1 | 1.45mi |
| 4400 Rena Rd Suitland, MD | 1.0–3.0 | 1.0–1.5 | 995 | $2,215 | $2.23 | 5d | 9 | 1.47mi |
| 2807 Evansgreen Dr Suitland, MD | 4.0 | 3.5 | 1280 | $2,995 | $2.34 | 14d | 1 | 1.50mi |
Listing history 7 events
-
2026-06-21statusdays on market $220,000 Pending 8 DOM
-
2026-06-18days on market $220,000 Active 6 DOM
-
2026-06-17days on market $220,000 Active 5 DOM
-
2026-06-16days on market $220,000 Active 4 DOM
-
2026-06-15days on market $220,000 Active 3 DOM
-
2026-06-13remarks 687-char remark
-
2026-06-13$220,000 Active 1 DOM
ⓘ Source: listings_history table (triggers on properties + properties_extension) + one-shot
backfill from property_details.listing_events for pre-trigger history.
Tax reassessment forecast MD · Partial reset (capped growth)
- Current annual tax
- $5,158 · $430/mo
- Projected year-2 tax
- $5,158 · $430/mo
- Expected delta
- $0/yr ($0/mo · 0.0%)
ⓘ Screening estimate from a state-policy table — verify with the county assessor before closing.
Climate risk First Street
- Flood 1/10 Low FEMA zone X (unshaded) · 0% chance over 30 yrs
- Wildfire 1/10 Low
- Heat 7/10 Severe 7 d/yr ≥103°F today · 16 d/yr by 30 yrs out
- Wind 4/10 Moderate 21% chance of damaging wind over 30 yrs
- Air quality 3/10 Moderate 2 unhealthy d/yr today · 3 by 30 yrs out
Nearby sold comps map
Loading sold comps map…
Walkable amenities ~0.75 mi
Loading nearby amenities…
Taxation est. · year 1
- Rental income
- $30,587
- − Mortgage interest
- −$12,323
- − Property taxes
- −$5,158
- − Insurance
- −$1,100
- − Repairs & maintenance
- −$2,447
- − Management
- −$2,447
- − Depreciation
- −$6,400
- Taxable income
- $712
- Est. tax owed @ 24.0%
- −$171
- After-tax cash flow
- $3,891/yr
For passive investors: Depreciation is non-cash, so a rental often shows a tax loss while cash-flowing — sheltering income. Rental losses are passive: they offset passive income freely, and up to $25,000/yr can offset ordinary (W-2) income if you actively participate and your MAGI is under $100k (phasing out to $0 by $150k); unused losses carry forward. On sale, claimed depreciation is recaptured at up to 25%, and gains may owe capital-gains tax (a 1031 exchange can defer both). Figures are a year-1 estimate at your 24.0% rate — not tax advice; consult a CPA.
Schools (NCES district)
- District
- Prince George'S County Public Schools
- NCES district ID
- 2400510
- Math proficiency
- 8% ▼ -11.00%
- Reading proficiency
- 24% ▼ -9.00%
- Median HH income
- $73,967
- Composite
- 16.82/100
- National rank
- #9151
- State rank
- #21 of 24 in MD
Livability — Suitland
- Score
- 69/100
- State rank
- #189
- US rank
- #8521
Category grades
Schools grade is shown separately in the Schools card above.
Census & demographics
- Census place
- Suitland, MD
- County
- Prince Georges County · 919,866 people
- City population
- 27,494
- Metro
- Washington-Arlington-Alexandria, DC-VA-MD-WV
- Population (ZIP)
- 27,156
- Household income
- $79,330
- Rent vs Own
- Severe rent burden
- 1879.0
Population outlook (Prince George's County) Hauer SSP2
- Today (2025)
- 1,005,426 people
- By 2030
- 1,048,416 · +4.3%
- By 2040
- 1,123,425 · +11.7%
- By 2050
- 1,183,220 · +17.7%
- By 2075
- 1,306,202 · +29.9%
- By 2100
- 1,408,179 · +40.1%
Race, ethnicity, and origin ACS 2023
- Neighborhood character
- Predominantly Black (85%)
- Race & ethnicity
- Black 85% White 5% Hispanic / Latino 5% Two or more races 5%
- Foreign-born
- 8% · Canada, United Kingdom, Guatemala
- Languages at home
- 90% English-only · Spanish 4% French/Haitian/Cajun 1%
Political lean MEDSL · Prince George's
- 2024 margin
- Solid D (+75.2) · D 86.3% · R 11.2% · Other 2.5%
- 2008→2024 swing
- -3.3pp toward R · 2008: 78.5pp · 2024: 75.2pp
- All cycles
- 2024: D+75.2 2020: D+80.5 2016: D+81.0 2012: D+80.9 2008: D+78.5
Not yet ingested
- Civics
- —
Market trends
- HPI YoY
- ▼ -52.82%
- Current HPI
- 284.5911
- Rent YoY
- ▼ -1.24%
- Metro
- Washington-Arlington-Alexandria, DC-VA-MD-WV
- State GDP YoY
- ▲ 2.97%
- F500 in state
- 12
Industry mix (Fortune 500 HQ in MD)
| Industry | F500 HQs | Revenue |
|---|---|---|
| Aerospace / Defense | 1 | $71B |
|
||
| Utilities | 1 | $25B |
|
||
| Hotels | 1 | $24B |
|
||
| Consumer Goods | 1 | $7B |
|
||
| Real Estate | 1 | $6B |
|
||
| Chemicals | 1 | $2B |
|
||
Price history
+877.8% since first listed4 events — show timeline
- 2026-06-12 Listed $220,000 BRIGHT MLS
- 2026-06-11 Coming Soon $220,000 BRIGHT MLS
- 1987-04-14 Sold (Public Records) $79,900 Public Records
- 1963-05-20 Sold (Public Records) $22,500 Public Records
Property tax history
+8.8%/yrLatest (2025): $5,158 · +10.9% YoY. Source: county tax records.
Cash-flow waterfall
monthlySold comps — $/sqft
last 12 mo · ≤1 miLoading sold comps…