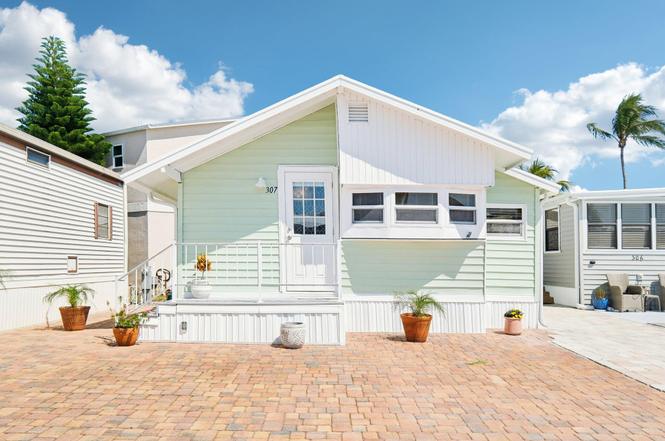
307 Nettles Blvd · Hutchinson Island South, FL
Flood risk 9/10 · Severe
- FEMA flood zone
- X (shaded)
- Chance of flooding over 30 yrs
- 0.99%
- Est. flood insurance / yr
- $507 – $1,088
Fire risk 1/10 · Minimal
- Est. fire insurance / yr
- $947 – $1,759
Heat risk 10/10 · Severe
- Hot days now (above 106°F)
- 7 days/yr
- Hot days in 30 yrs
- 24 days/yr
Wind risk 10/10 · Severe
- Chance of severe wind over 30 yrs
- 99.0%
Air-quality risk 2/10 · Minimal
- Unhealthy air days now
- 1 days/yr
- Unhealthy air days in 30 yrs
- 2 days/yr
Risk factors via First Street. Map © Google.
Why this score? — see what drove the F grade
The composite is a weighted blend of 9 inputs, each scored 0–100. Each bar is that input's sub-score; the figure is the points it added to the 100-point composite (weight × sub-score).
- Cash flow +7.5/30.0
- Schools +3.7/10.0
- Livability +3.1/5.0
- 1% rule +2.9/10.0
- Rent growth +2.8/5.0
- Condition / age +2.5/5.0
- DSCR +1.6/10.0
- ARV discount +0.0/15.0
- Appreciation +0.0/10.0
$240,000
🖨 Deal sheet 📄 Offer letter ✓ Due diligence
Listing remarks
Welcome Home to this cozy 2-bedroom, 1 bathroom home on Nettles Island featuring a newer roof (2021) AC (2019) and plenty of room to accommodate 2 cars and a golf cart! This coastal retreat offers the Ultimate Island Lifestyle with access to 2 pools, tennis courts, pickleball, shuffleboard, mini golf, a fitness center, beach access, on site dining, social events, and more adding exceptional charm to this hidden gem. Don't miss your chance to own a piece of paradise. Schedule your tour today!
Key facts
- Fitness center
- Newer roof
- Pickleball
Tags
Property features AI
Finance
- Other: Pets allowed with possible restrictions and limits
- HOA & community: Community amenities include clubhouse, fitness center, pool, tennis courts, pickleball, basketball court, shuffleboard, putting green, jogging path, sidewalks, billiard room, cafe/restaurant, and library; HOA fee paid monthly
Exterior
- Security: Gated community with guard
- Utilities: Public water; Public sewer; Three-phase electric; Cable available
- Home design: Manufactured home; Single-story; Faces west
- Construction: Modular construction
- Exterior features: Not waterfront
Interior
- Kitchen: Electric range; Microwave; Refrigerator
- Bedrooms: 2 bedrooms on the main level
- Bathrooms: 1 full bathroom
- Heating & cooling: Central heating; Central air conditioning
- Interior features: No special interior features listed
- Laundry & utility: Washer hookup; Dryer hookup
Neighborhood map
What this means for you Summary
Snapshot
- This is a 2-bed/1.0-bath manufactured listed at $240k.
Deal economics
- At list price, monthly cash flow is $-367 ($-4k/yr) — negative.
- To cash-flow at today's rent, offer at most $175k (27.0% below list).
- To meet the 1% rule (rent ≥ 1% of price), the offer needs to be $191k (20.6% below list).
- Recommended offer: $175k (27.0% below list) — sets the bar for cash-flow.
- Cap rate 4.8% vs local median 1.9% in Hutchinson Island South — top-decile yield for the area; either an underpriced asset or a hidden risk that comps aren't pricing in. Stress-test before assuming the spread holds.
Location & tenants
- Location reads 61/100 on livability (#783 in FL) — a middle-class / working-renter tenant base. Strengths: crime A+, housing B; Watch: cost of living C-, schools D, amenities F.
- St. Lucie (urban): math 40% / reading 48% proficiency, ranked #51 of 73 in FL (top 70%) — families likely to look elsewhere, expect single-tenant / working-renter base with shorter leases.
- Market conditions: Rents rising (+1.0%/yr); 536 active listings in the ZIP; 4,868 units permitted in St. Lucie County in 2024 (268 in 5+ unit buildings).
- This rent runs 32% of the median local income ($70k/yr) — at the standard rent-burdened threshold; future hikes will face affordability resistance.
Forward outlook
- Local home prices are declining (-3.0%/yr); year-one equity from $2k of loan paydown is wiped out by about $7k of value loss. Plan a longer hold.
- St. Lucie County population projected at +20% by 2050 — long-run rental-demand tailwind backs the buy-and-hold thesis.
Negotiation context
- It's been on market 447 days — a 12% lower offer ($211k) is reasonable based on typical stale-listing flexibility.
- 2 sale attempts since 13y ago with the ask held roughly flat each time — persistent listings suggest the price (not the market) is what's stuck; bring a comps-based counter.
- Current owner paid $114k; list at $240k implies a 111% gain — meaningful room to come down on a strong offer.
Risks & watch-outs
- Watch-outs: flood insurance adds $66/mo.
- Climate carrying-cost: severe flood risk; severe wind risk, 99% chance of damaging wind over 30y; extreme-heat days projected 7→24/yr by 2055 (HVAC capex compounding) — expect insurance premiums to compound above CPI over the hold.
Questions for the listing agent
- What do current leases actually rent for vs. the listed asking? Can we see a recent rent roll and the last 12 months of T-12 income?
- It's been on market 447 days. Have you received any prior offers? Is the seller open to a 27% concession, seller financing, or rate buy-down credit?
- Built in 1979 — when were the roof, HVAC, electrical panel, plumbing, and water heater last replaced?
- What's the actual annual flood-insurance premium (NFIP or private), and is the property in a SFHA with mandatory coverage?
- What does the HOA fee cover, when was the last increase, and are there any pending special assessments or reserve-fund shortfalls?
- Why hasn't it sold? Are there any deal-killer items the seller is aware of (foundation, flood, title, zoning, code violations)?
- Is there a deadline driving the sale (1031 exchange, divorce, estate, relocation)? That informs how much negotiation room exists.
- Schools are D-rated, which usually means shorter tenancies and higher turnover. Who's the typical renter profile here, and what's been the actual vacancy rate?
- The area grade is low — what's the realistic commute time and amenity access for the typical tenant pool here? Any planned neighborhood developments (good or bad) we should know about?
- What's the average days-on-market for RENTAL listings here right now (not sales)? A rising rental-DOM trend means longer vacancies and softer asking-rent achievability than the comps imply.
- What's the recent tenant-quality profile in this submarket — average credit score on applications, eviction rate, late-payment / NSF rate, and stable-employment percentage? A property-management company in the area should have these aggregated.
- How much new for-sale + rental construction is in the pipeline within 1–3 miles? Heavy new supply typically softens prices + rents 12–24 months out; constrained supply supports both.
Investment metrics
- 1% rule
- 0.79% ✗
- Cap rate
- 4.79%
- Cash-on-cash
- -5.37%
- DSCR
- 0.76
- GRM
- 10.5
CMA / ARV
- ARV (on-the-fly)
- $205,200
- Comps found
- 4
Show comp detail 4 sales within ~0.75 mi
| Address | Dist | Beds/Ba | Sqft | Sold | Price | $/sf | Match |
|---|---|---|---|---|---|---|---|
| 1277 Nettles Blvd | 0.23mi | 2/1.0 | 408 (+2%) | 9mo | $254,900 | $625 | 79 |
| 1310 Nettles Blvd | 0.27mi | 1/1.5 (-1) | 424 (+6%) | 15mo | $217,500 | $513 | 58 |
| 1163 Nettles Blvd | 0.21mi | 2/1.0 | 360 (-10%) | 19mo | $155,000 | $431 | 58 |
| 828 Nettles Blvd | 0.10mi | 1/1.0 (-1) | 449 (+12%) | 15mo | $192,000 | $428 | 58 |
Match score weights: distance 35% · size 25% · config 20% · recency 20%. Top-matched comps best support the ARV.
Projected returns pro-forma
-3.0% appreciation · 1.0% rent growth · sell at horizon
- IRR
- -30.1%
- Equity multiple
- 0.02×
- Total profit
- $-65,890
- Equity at exit
- $35,785
- IRR
- -45.2%
- Equity multiple
- -0.51×
- Total profit
- $-101,675
- Equity at exit
- $20,751
Cash invested: $67,200 (down + closing). Projections, not guarantees.
Landlord ↔ Tenant lean methodology
- Overall (STATE)
- 87 Strongly Landlord-Friendly
- State Florida
- 87 Strongly Landlord-Friendly · R+3
- County
- — inherits STATE
- City
- — inherits STATE
ZIP-level market 34957
- Rents YoY
- 1.0%
- Active inventory
- 536
- Price-to-rent
- 10.5×
Monthly cashflow live
- Estimated rent
- $1,905 medium interval (Pro) →
- Mortgage (P&I)
- −$1,259
- Tax from tax record
- −$88 /mo · $1,050/yr
- Insurance
- −$100
- Flood insurance flood zone
- −$66 /mo · $798/yr
- HOA
- −$360
- Vacancy / Maint / Mgmt
- −$400
- Net cashflow
- $-367
Break-even live
UW: 25.0% down · 7.5% · 30yr · 1.5% tax · 5.0% vac · 8.0% maint · 8.0% mgmt
Financing live
Cash to close
- Down payment
- $60,000
- Closing costs
- $7,200
- Reserves months
- —
- Total cash needed
- —
Loan-product check · same deal, 3 products live
Conventional
25% down · 7.5% · 30yr
- Down + closing
- —
- Monthly P&I
- —
- Monthly cashflow
- —
- DSCR
- —
- Eligible?
- —
Personal DTI + credit; lowest rate.
DSCR
20% down · 8.5% · 30yr
- Down + closing
- —
- Monthly P&I
- —
- Monthly cashflow
- —
- DSCR
- —
- Eligible?
- —
No personal income docs; deal must DSCR.
Hard money
10% down · 12.0% · 12mo
- Down + closing
- —
- Monthly P&I
- —
- Monthly cashflow
- —
- DSCR
- —
- Eligible?
- —
Short-term bridge; refi at stabilization.
HOA detail
- Monthly dues
- $360 · $4,320/yr
- Likely covers
- poolgym
Listing history 23 events
-
2026-06-18days on market $240,000 Active 447 DOM
-
2026-06-17days on market $240,000 Active 446 DOM
-
2026-06-16days on market $240,000 Active 445 DOM
-
2026-06-15days on market $240,000 Active 444 DOM
-
2026-06-14days on market $240,000 Active 442 DOM
-
2026-06-13days on market $240,000 Active 441 DOM
-
2026-06-10days on market $240,000 Active 439 DOM
-
2026-06-09days on market $240,000 Active 438 DOM
-
2026-06-08days on market $240,000 Active 437 DOM
-
2026-06-07days on market $240,000 Active 436 DOM
-
2026-06-05days on market $240,000 Active 433 DOM
-
2026-06-03days on market $240,000 Active 432 DOM
-
2026-06-02days on market $240,000 Active 431 DOM
-
2026-06-01days on market $240,000 Active 430 DOM
-
2026-05-31days on market $240,000 Active 429 DOM
-
2026-05-30days on market $240,000 Active 428 DOM
-
2026-03-21price $240,000
-
2026-01-21price $245,000
-
2025-03-28$250,000 Active
-
2017-05-24soldstatus $114,000
-
2014-05-19historical
-
2013-11-19$134,800
-
1996-04-29soldstatus $30,000
ⓘ Source: listings_history table (triggers on properties + properties_extension) + one-shot
backfill from property_details.listing_events for pre-trigger history.
Tax reassessment forecast FL · Resets to sale price
- Current annual tax
- $1,050 · $88/mo
- Projected year-2 tax
- $1,992 · $166/mo
- Expected delta
- +$942/yr (+$78/mo · 89.7%)
ⓘ Screening estimate from a state-policy table — verify with the county assessor before closing.
Climate risk First Street
- Flood 9/10 Extreme FEMA zone X (shaded) · 99% chance over 30 yrs
- Wildfire 1/10 Low
- Heat 10/10 Extreme 7 d/yr ≥106°F today · 24 d/yr by 30 yrs out
- Wind 10/10 Extreme 99% chance of damaging wind over 30 yrs
- Air quality 2/10 Low 1 unhealthy d/yr today · 2 by 30 yrs out
Nearby sold comps map
Loading sold comps map…
Walkable amenities ~0.75 mi
Loading nearby amenities…
Taxation est. · year 1
- Rental income
- $22,863
- − Mortgage interest
- −$13,444
- − Property taxes
- −$1,050
- − Insurance
- −$1,997
- − Repairs & maintenance
- −$1,829
- − Management
- −$1,829
- − HOA
- −$4,320
- − Depreciation
- −$6,982
- Taxable loss
- −$8,588
- Est. tax savings @ 24.0%
- +$2,061
- After-tax cash flow
- $-2,348/yr
For passive investors: Depreciation is non-cash, so a rental often shows a tax loss while cash-flowing — sheltering income. Rental losses are passive: they offset passive income freely, and up to $25,000/yr can offset ordinary (W-2) income if you actively participate and your MAGI is under $100k (phasing out to $0 by $150k); unused losses carry forward. On sale, claimed depreciation is recaptured at up to 25%, and gains may owe capital-gains tax (a 1031 exchange can defer both). Figures are a year-1 estimate at your 24.0% rate — not tax advice; consult a CPA.
Schools (NCES district)
- District
- St. Lucie
- NCES district ID
- 1201770
- Math proficiency
- 40% ▼ -11.00%
- Reading proficiency
- 48% ▼ -4.00%
- Median HH income
- $44,737
- Composite
- 37.28/100
- National rank
- #4449
- State rank
- #51 of 73 in FL
Livability — Hutchinson Island South
- Score
- 61/100
- State rank
- #783
- US rank
- #17768
Category grades
Schools grade is shown separately in the Schools card above.
Census & demographics
- Census place
- Hutchinson Island South, FL
- County
- Martin County · 165,223 people
- Metro
- Port St. Lucie, FL
- Population (ZIP)
- 23,462
- Household income
- $70,403
- Rent vs Own
- Severe rent burden
- 946.0
Population outlook (St. Lucie County) Hauer SSP2
- Today (2025)
- 338,016 people
- By 2030
- 355,687 · +5.2%
- By 2040
- 385,521 · +14.1%
- By 2050
- 406,106 · +20.1%
- By 2075
- 441,054 · +30.5%
- By 2100
- 436,885 · +29.2%
Race, ethnicity, and origin ACS 2023
- Neighborhood character
- Predominantly White (85%)
- Race & ethnicity
- White 85% Hispanic / Latino 7% Two or more races 6% Asian 2% Black 2%
- Hispanic origin (detail)
- Mexican 1% Puerto Rican 2% Cuban 1%
- Common ancestry
- Romanian 4% Slovak 3% Lithuanian 3%
- Foreign-born
- 10% · Canada, Jamaica
- Languages at home
- 90% English-only · Spanish 5% Other Indo-European 2% Tagalog/Filipino 1%
Political lean MEDSL · St. Lucie
- 2024 margin
- Lean R (+9.1) · D 45.1% · R 54.2%
- 2008→2024 swing
- -21.2pp toward R · 2008: 12.1pp · 2024: -9.1pp
- All cycles
- 2024: R+9.1 2020: R+1.6 2016: R+2.5 2012: D+7.9 2008: D+12.1
Not yet ingested
- Civics
- —
Market trends
- HPI YoY
- ▼ -319.66%
- Current HPI
- 340.0172
- Rent YoY
- ▲ 1.00%
- Metro
- Port St. Lucie, FL
- State GDP YoY
- ▲ 3.28%
- F500 in state
- 36
Industry mix (Fortune 500 HQ in FL)
| Industry | F500 HQs | Revenue |
|---|---|---|
| Industrial Technology | 2 | $29B |
|
||
| Insurance | 2 | $17B |
|
||
| Retail | 1 | $60B |
|
||
| Technology Distribution | 1 | $58B |
|
||
| Homebuilding | 1 | $35B |
|
||
| Technology Manufacturing | 1 | $35B |
|
||
Price history
+700.0% since first listed7 events — show timeline
- 2026-03-21 Price Changed $240,000 Beaches MLS
- 2026-01-21 Price Changed $245,000 Beaches MLS
- 2025-03-28 Listed $250,000 Beaches MLS
- 2017-05-24 Sold (Public Records) $114,000 Public Records
- 2014-05-19 Listing Removed — MCRTC
- 2013-11-19 Listed $134,800 MCRTC
- 1996-04-29 Sold (Public Records) $30,000 Public Records
Property tax history
-1.0%/yrLatest (2025): $1,050 · +4.8% YoY. Source: county tax records.
Cash-flow waterfall
monthlySold comps — $/sqft
last 12 mo · ≤1 miLoading sold comps…