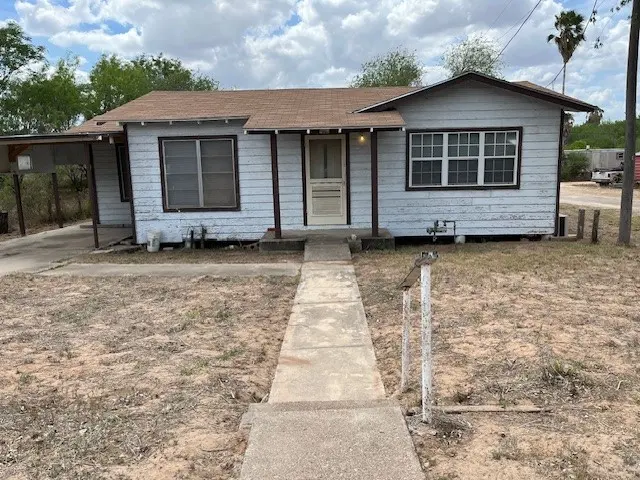
303 E Texas St · Hebbronville, TX
Flood risk 5/10 · Moderate
- FEMA flood zone
- —
- Chance of flooding over 30 yrs
- 0.24%
- Est. flood insurance / yr
- —
Fire risk 5/10 · Moderate
- Est. fire insurance / yr
- $1,222 – $2,270
Heat risk 9/10 · Severe
- Hot days now (above 111°F)
- 6 days/yr
- Hot days in 30 yrs
- 16 days/yr
Wind risk 8/10 · Major
- Chance of severe wind over 30 yrs
- 93.0%
Air-quality risk 1/10 · Minimal
- Unhealthy air days now
- 0 days/yr
- Unhealthy air days in 30 yrs
- 0 days/yr
Risk factors via First Street. Map © Google.
Why this score? — see what drove the B grade
The composite is a weighted blend of 9 inputs, each scored 0–100. Each bar is that input's sub-score; the figure is the points it added to the 100-point composite (weight × sub-score).
- Cash flow +30.0/30.0
- 1% rule +10.0/10.0
- DSCR +10.0/10.0
- ARV discount +7.2/15.0
- Appreciation +4.5/10.0
- Livability +3.1/5.0
- Schools +2.6/10.0
- Rent growth +2.5/5.0
- Condition / age +2.5/5.0
$54,900
🖨 Deal sheet (PDF) 📄 Offer letter ✓ Due diligence
Listing remarks
NEWLY UPDATED! Charming 3 BR, 2 BTH home on a spacious corner lot measuring 50' x 150'. New wood plank flooring in the living room, kitchen, baths, and hallway. Bedrooms have hardwood flooring. The recent roof replacement (2022) gives peace of mind, while the covered carport keeps your vehicle sheltered from the elements. Out back you not only find a cozy porch, but a separate covered area that'll be great for grilling and gathering.
Key facts
- Hardwood flooring
- Covered carport
- Wood plank flooring
Tags
Property features AI
Exterior
- Parking: Carport; Front entry parking; 1 parking space
- Utilities: Public water; Public sewer; Utilities available
- Home design: Single-story; Faces north; Entry level: main floor
- Construction: Wood siding construction; Shingle roof; Pillar/post/pier foundation; Built on a 50' x 150' lot (approximately 0.17 acres)
- Exterior features: Partial wire fencing; Corner lot; City street frontage; Asphalt road
Interior
- Kitchen: Free-standing range
- Flooring: Tile flooring; Vinyl flooring
- Bathrooms: 2 full bathrooms
- Heating & cooling: Ductless heating; Ductless cooling; Window unit heating; Window unit cooling
- Interior features: Primary bedroom located downstairs; Ceiling fans
- Laundry & utility: Washer hookup; Dryer hookup
Neighborhood map
What this means for you Summary
Snapshot
- This is a 3-bed/2.0-bath single-family listed at $55k.
Deal economics
- At list price, monthly cash flow is $326 ($4k/yr) — positive.
- The deal already cash-flows at list — no discount required.
- Meets the 1% rule at list price ($836 rent vs $55k).
- Recommended offer: $53k (3.0% below list) — sets the bar for market timing.
Location & tenants
- Location reads 61/100 on livability (#1,032 in TX) — a middle-class / working-renter tenant base. Strengths: cost of living A+, housing A+; Watch: crime D+, schools D-, amenities F.
- Jim Hogg County ISD (town): math 31% / reading 31% proficiency, ranked #622 of 826 in TX (top 75%) — families likely to look elsewhere, expect single-tenant / working-renter base with shorter leases.
- Market conditions: 36 active listings in the ZIP.
Forward outlook
- Local home prices are declining (-0.9%/yr); year-one equity from $380 of loan paydown is wiped out by about $524 of value loss. Plan a longer hold.
- Jim Hogg County population projected at -10% by 2050 — secular population decline; favor cash flow + early exit over multi-decade hold.
- At projected returns (-0.9% appreciation + 3.0% rent growth), your $15k cash investment doubles in ~4 years — after that, you're playing with house money.
Negotiation context
- It's been on market 31 days — a 3% lower offer ($53k) is reasonable based on typical stale-listing flexibility.
- 3 sale attempts since 2y ago with the ask held roughly flat each time — persistent listings suggest the price (not the market) is what's stuck; bring a comps-based counter.
Risks & watch-outs
- Climate carrying-cost: moderate flood risk; severe wind risk, 93% chance of damaging wind over 30y; moderate wildfire risk; extreme-heat days projected 6→16/yr by 2055 (HVAC capex compounding) — expect insurance premiums to compound above CPI over the hold.
Questions for the listing agent
- It's been on market 31 days. Have you received any prior offers? Is the seller open to a 3% concession, seller financing, or rate buy-down credit?
- Built in 1960 — when were the roof, HVAC, electrical panel, plumbing, and water heater last replaced?
- Is there a deadline driving the sale (1031 exchange, divorce, estate, relocation)? That informs how much negotiation room exists.
- Schools are D-rated, which usually means shorter tenancies and higher turnover. Who's the typical renter profile here, and what's been the actual vacancy rate?
- Crime grade is D in this area — have there been break-ins, vandalism, or insurance claims at this property in the last 3 years? What carrier currently insures it and at what premium?
- What's the average days-on-market for RENTAL listings here right now (not sales)? A rising rental-DOM trend means longer vacancies and softer asking-rent achievability than the comps imply.
- What's the recent tenant-quality profile in this submarket — average credit score on applications, eviction rate, late-payment / NSF rate, and stable-employment percentage? A property-management company in the area should have these aggregated.
- How much new for-sale + rental construction is in the pipeline within 1–3 miles? Heavy new supply typically softens prices + rents 12–24 months out; constrained supply supports both.
Investment metrics
- 1% rule
- 1.52% ✓
- Cap rate
- 13.42%
- Cash-on-cash
- 25.44%
- DSCR
- 2.13
- GRM
- 5.5
CMA / ARV
- ARV (on-the-fly)
- $54,549
- Comps found
- 5
Show comp detail 5 sales within ~0.75 mi
| Address | Dist | Beds/Ba | Sqft | Sold | Price | $/sf | Match |
|---|---|---|---|---|---|---|---|
| 303 E Texas St | 0.00mi | 3/2.0 | 957 (0%) | 1mo | $54,900 | $57 | 100 |
| 103 E David St | 0.42mi | 2/1.0 (-1) | 1,072 (+12%) | 4mo | $42,500 | $40 | 48 |
| 711 Marcos Hinojosa Ave | 0.63mi | 3/1.0 | 874 (-9%) | 8mo | $50,000 | $57 | 46 |
| 1013 S Smith Ave | 0.65mi | 3/1.0 | 1,050 (+10%) | 6mo | $82,000 | $78 | 44 |
| 1001 N Elm Ave | 0.72mi | 2/1.5 (-1) | 856 (-11%) | 2mo | $49,500 | $58 | 40 |
Match score weights: distance 35% · size 25% · config 20% · recency 20%. Top-matched comps best support the ARV.
Projected returns pro-forma
-0.95% appreciation · 3.0% rent growth · sell at horizon
- IRR
- 23.6%
- Equity multiple
- 2.09×
- Total profit
- $16,715
- Equity at exit
- $13,369
- IRR
- 28.8%
- Equity multiple
- 3.98×
- Total profit
- $45,805
- Equity at exit
- $14,139
Cash invested: $15,372 (down + closing). Projections, not guarantees.
Landlord ↔ Tenant lean methodology
- Overall (STATE)
- 87 Strongly Landlord-Friendly
- State Texas
- 87 Strongly Landlord-Friendly · R+5
- County
- — inherits STATE
- City
- — inherits STATE
ZIP-level market 78361
- Home prices YoY
- -0.9%
- Active inventory
- 36
- Price-to-rent
- 5.5×
Monthly cashflow live
- Estimated rent
- $836 medium interval (Pro) →
- Mortgage (P&I)
- −$288
- Tax from tax record
- −$24 /mo · $287/yr
- Insurance
- −$23
- HOA
- −$0
- Vacancy / Maint / Mgmt
- −$176
- Net cashflow
- $326
Break-even live
Sensitivity live
| Price | -10% $357 | -5% $341 | +0% $326 | +5% $310 | +10% $295 |
|---|---|---|---|---|---|
| Rent | -10% $260 | -5% $293 | +0% $326 | +5% $359 | +10% $392 |
| Rate | -1.0pp $354 | -0.5pp $340 | base $326 | +0.5pp $312 | +1.0pp $297 |
UW: 25.0% down · 7.5% · 30yr · 1.5% tax · 5.0% vac · 8.0% maint · 8.0% mgmt
Financing live
Cash to close
- Down payment
- $13,725
- Closing costs
- $1,647
- Reserves months
- —
- Total cash needed
- —
Loan-product check · same deal, 3 products live
Conventional
25% down · 7.5% · 30yr
- Down + closing
- —
- Monthly P&I
- —
- Monthly cashflow
- —
- DSCR
- —
- Eligible?
- —
Personal DTI + credit; lowest rate.
DSCR
20% down · 8.5% · 30yr
- Down + closing
- —
- Monthly P&I
- —
- Monthly cashflow
- —
- DSCR
- —
- Eligible?
- —
No personal income docs; deal must DSCR.
Hard money
10% down · 12.0% · 12mo
- Down + closing
- —
- Monthly P&I
- —
- Monthly cashflow
- —
- DSCR
- —
- Eligible?
- —
Short-term bridge; refi at stabilization.
Listing history 7 events
-
2026-05-01historical
-
2026-05-01status Pending
-
2026-03-31$54,900 Active
-
2026-03-31$54,900 Active
-
2025-07-11price $49,900
-
2025-01-10price $59,900
-
2024-07-17$65,000 Active
ⓘ Source: listings_history table (triggers on properties + properties_extension) + one-shot
backfill from property_details.listing_events for pre-trigger history.
Tax reassessment forecast TX · Resets to sale price
- Current annual tax
- $287 · $24/mo
- Projected year-2 tax
- $1,005 · $84/mo
- Expected delta
- +$718/yr (+$60/mo · 250.0%)
ⓘ Screening estimate from a state-policy table — verify with the county assessor before closing.
Climate risk First Street
- Flood 5/10 Major 24% chance over 30 yrs
- Wildfire 5/10 Major
- Heat 9/10 Extreme 6 d/yr ≥111°F today · 16 d/yr by 30 yrs out
- Wind 8/10 Severe 93% chance of damaging wind over 30 yrs
- Air quality 1/10 Low 0 unhealthy d/yr today · 0 by 30 yrs out
Nearby sold comps map
Loading sold comps map…
Walkable amenities ~0.75 mi
Loading nearby amenities…
Taxation est. · year 1
- Rental income
- $10,034
- − Mortgage interest
- −$3,075
- − Property taxes
- −$287
- − Insurance
- −$274
- − Repairs & maintenance
- −$803
- − Management
- −$803
- − Depreciation
- −$1,597
- Taxable income
- $3,194
- Est. tax owed @ 24.0%
- −$767
- After-tax cash flow
- $3,144/yr
For passive investors: Depreciation is non-cash, so a rental often shows a tax loss while cash-flowing — sheltering income. Rental losses are passive: they offset passive income freely, and up to $25,000/yr can offset ordinary (W-2) income if you actively participate and your MAGI is under $100k (phasing out to $0 by $150k); unused losses carry forward. On sale, claimed depreciation is recaptured at up to 25%, and gains may owe capital-gains tax (a 1031 exchange can defer both). Figures are a year-1 estimate at your 24.0% rate — not tax advice; consult a CPA.
Schools (NCES district)
- District
- Jim Hogg County ISD
- NCES district ID
- 4824750
- Math proficiency
- 31% ▼ -15.00%
- Reading proficiency
- 31% ▼ -2.00%
- Median HH income
- $35,870
- Composite
- 25.69/100
- National rank
- #7391
- State rank
- #622 of 826 in TX
Livability — Hebbronville
- Score
- 61/100
- State rank
- #1032
- US rank
- #18361
Category grades
Schools grade is shown separately in the Schools card above.
Census & demographics
- Census place
- Hebbronville, TX
- Population (ZIP)
- 4,764
Population outlook (Jim Hogg County) Hauer SSP2
- Today (2025)
- 5,023 people
- By 2030
- 4,897 · -2.5%
- By 2040
- 4,722 · -6.0%
- By 2050
- 4,510 · -10.2%
- By 2075
- 3,827 · -23.8%
- By 2100
- 2,794 · -44.4%
Race, ethnicity, and origin ACS 2023
- Neighborhood character
- Predominantly Hispanic (78%)
- Race & ethnicity
- Hispanic / Latino 78% Two or more races 40% White 21%
- Hispanic origin (detail)
- Mexican 76%
- Foreign-born
- 1% · Canada
- Languages at home
- 41% English-only · Spanish 58% Tagalog/Filipino 1%
Political lean MEDSL · Jim Hogg
- 2024 margin
- Lean D (+8.3) · D 54.0% · R 45.7%
- 2008→2024 swing
- -39.3pp toward R · 2008: 47.6pp · 2024: 8.3pp
- All cycles
- 2024: D+8.3 2020: D+17.9 2016: D+56.9 2012: D+56.7 2008: D+47.6
Not yet ingested
- Civics
- —
Market trends
- HPI YoY
- ▼ -0.95%
- Current HPI
- 99.0946
- Rent YoY
- —
- Metro
- —
- State GDP YoY
- ▲ 3.95%
- F500 in state
- 110
Industry mix (Fortune 500 HQ in TX)
| Industry | F500 HQs | Revenue |
|---|---|---|
| Energy | 16 | $1,198B |
|
||
| Technology | 5 | $198B |
|
||
| Engineering / Construction | 4 | $72B |
|
||
| Energy Services | 3 | $60B |
|
||
| Utilities | 3 | $41B |
|
||
| Healthcare | 2 | $330B |
|
||
Price history
-15.5% since first listed7 events — show timeline
- 2026-05-01 Delisted — LAOR
- 2026-05-01 Pending — CBMLS
- 2026-03-31 Listed $54,900 CBMLS
- 2026-03-31 Listed $54,900 LAOR
- 2025-07-11 Price Changed $49,900 CBMLS
- 2025-01-10 Price Changed $59,900 CBMLS
- 2024-07-17 Listed $65,000 CBMLS
Property tax history
+5.0%/yrLatest (2025): $287 · -3.2% YoY. Source: county tax records.
Cash-flow waterfall
monthlySold comps — $/sqft
last 12 mo · ≤1 miLoading sold comps…