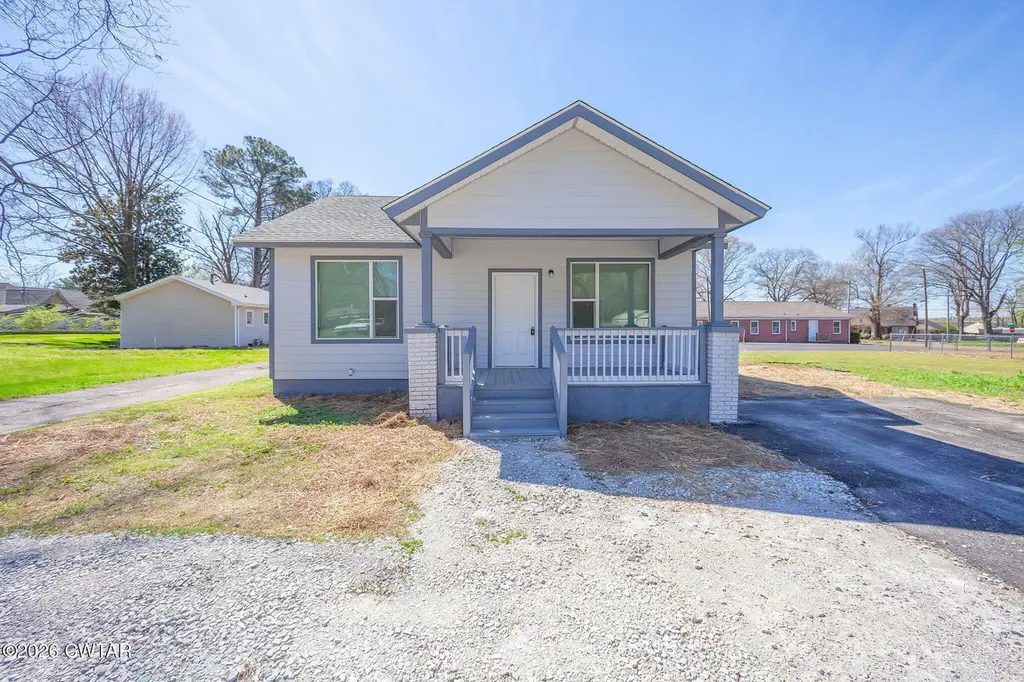
218 Newton St · Jackson, TN
Flood risk 1/10 · Minimal
- FEMA flood zone
- X (unshaded)
- Chance of flooding over 30 yrs
- 0.0%
- Est. flood insurance / yr
- $507 – $1,088
Fire risk 1/10 · Minimal
- Est. fire insurance / yr
- $949 – $1,763
Heat risk 6/10 · Moderate
- Hot days now (above 108°F)
- 7 days/yr
- Hot days in 30 yrs
- 20 days/yr
Wind risk 4/10 · Minor
- Chance of severe wind over 30 yrs
- 15.0%
Air-quality risk 1/10 · Minimal
- Unhealthy air days now
- 0 days/yr
- Unhealthy air days in 30 yrs
- 0 days/yr
Risk factors via First Street. Map © Google.
Why this score? — see what drove the D+ grade
The composite is a weighted blend of 9 inputs, each scored 0–100. Each bar is that input's sub-score; the figure is the points it added to the 100-point composite (weight × sub-score).
- Cash flow +23.7/30.0
- DSCR +7.6/10.0
- 1% rule +6.2/10.0
- Rent growth +3.8/5.0
- Livability +3.1/5.0
- Condition / age +2.5/5.0
- Schools +1.2/10.0
- ARV discount +0.0/15.0
- Appreciation +0.0/10.0
$149,000
🖨 Deal sheet (PDF) 📄 Offer letter ✓ Due diligence
Listing remarks
Fully renovated and move-in ready! This 3-bedroom, 2-bath home features modern updates, a functional layout, and stylish finishes throughout. Perfect for comfortable living and entertaining-don't miss this one!
Key facts
- 6,860 sq ft lot
- 2 parking spots
- Built 1930
Property features AI
Exterior
- Parking: 2 parking spaces
- Utilities: Public water; Public sewer; Electricity available (200+ amp service)
- Home design: Single-family residence; One-level / single-story
- Construction: HardiPlank-type exterior; Raised foundation
- Exterior features: Front porch; Rear porch; Corner lot; Asphalt road frontage on a city street (publicly maintained)
Interior
- Kitchen: Dishwasher; Garbage disposal; Gas range; Stainless steel appliances; Electric water heater
- Bedrooms: 3 bedrooms on the main level
- Bathrooms: 2 full bathrooms (both on the main level)
- Heating & cooling: Central heating; Central air; Ceiling fans (cooling support)
- Interior features: Ceiling fans; Laminate countertops; Walk-in closets; Blinds
- Laundry & utility: Main level laundry room
Neighborhood map
What this means for you Summary
Snapshot
- This is a 3-bed/1.0-bath single-family listed at $149k.
Deal economics
- At list price, monthly cash flow is $283 ($3k/yr) — positive.
- The deal already cash-flows at list — no discount required.
- Meets the 1% rule at list price ($2k rent vs $149k).
- Recommended offer: $145k (3.0% below list) — sets the bar for market timing.
- Cap rate 8.6% vs local median 3.5% in Jackson — top-decile yield for the area; either an underpriced asset or a hidden risk that comps aren't pricing in. Stress-test before assuming the spread holds.
Location & tenants
- Location reads 62/100 on livability (#216 in TN) — a middle-class / working-renter tenant base. Strengths: cost of living A+, housing A+; Watch: health & safety C-, crime F, amenities F.
- Madison County (urban): math 10% / reading 17% proficiency, ranked #131 of 139 in TN (top 94%) — low school quality limits family demand, transient renter base, plan for 1-2y turnover; 68% free/reduced lunch — lower-income household profile, screen leases tightly.
- Zoned schools: Arlington Elementary School (math 5% / reading 8%, grade F, #880 of 952 statewide, top 93%, 593 students, 0% FRL) — zoned schools average 0% FRL vs 68% district-wide (68 pts lower); this property's tenant base skews higher-income than the district average.
- Market conditions: Rents rising fast (+5.2%/yr); 255 active listings in the ZIP; 1 comparable units currently listed for rent nearby; lower-income renter base — watch delinquency; 247 units permitted in Madison County in 2024 (0 in 5+ unit buildings).
Forward outlook
- Local home prices are declining (-3.0%/yr); year-one equity from $1k of loan paydown is wiped out by about $4k of value loss. Plan a longer hold.
- Madison County population projected at -12% by 2050 — secular population decline; favor cash flow + early exit over multi-decade hold.
- At projected returns (-3.0% appreciation + 5.2% rent growth), your $42k cash investment doubles in ~10 years — after that, you're playing with house money.
Negotiation context
- It's been on market 46 days — a 3% lower offer ($145k) is reasonable based on typical stale-listing flexibility.
- 2 sale attempts with the ask held roughly flat each time — persistent listings suggest the price (not the market) is what's stuck; bring a comps-based counter.
- Current owner paid $16k; list at $149k implies a 803% gain — meaningful room to come down on a strong offer.
Risks & watch-outs
- Watch-outs: built in 1930 — expect roof / HVAC / electrical / plumbing capex.
- Climate carrying-cost: extreme-heat days projected 7→20/yr by 2055 (HVAC capex compounding) — expect insurance premiums to compound above CPI over the hold.
Questions for the listing agent
- It's been on market 46 days. Have you received any prior offers? Is the seller open to a 3% concession, seller financing, or rate buy-down credit?
- Built in 1930 — when were the roof, HVAC, electrical panel, plumbing, and water heater last replaced?
- Is there a deadline driving the sale (1031 exchange, divorce, estate, relocation)? That informs how much negotiation room exists.
- Schools are F-rated, which usually means shorter tenancies and higher turnover. Who's the typical renter profile here, and what's been the actual vacancy rate?
- Crime grade is F in this area — have there been break-ins, vandalism, or insurance claims at this property in the last 3 years? What carrier currently insures it and at what premium?
- The area grade is low — what's the realistic commute time and amenity access for the typical tenant pool here? Any planned neighborhood developments (good or bad) we should know about?
- What's the average days-on-market for RENTAL listings here right now (not sales)? A rising rental-DOM trend means longer vacancies and softer asking-rent achievability than the comps imply.
- What's the recent tenant-quality profile in this submarket — average credit score on applications, eviction rate, late-payment / NSF rate, and stable-employment percentage? A property-management company in the area should have these aggregated.
- How much new for-sale + rental construction is in the pipeline within 1–3 miles? Heavy new supply typically softens prices + rents 12–24 months out; constrained supply supports both.
Investment metrics
- 1% rule
- 1.12% ✓
- Cap rate
- 8.57%
- Cash-on-cash
- 8.15%
- DSCR
- 1.36
- GRM
- 7.5
CMA / ARV
- ARV (on-the-fly)
- $124,490
- Comps found
- 2
Show comp detail 2 sales within ~0.75 mi
| Address | Dist | Beds/Ba | Sqft | Sold | Price | $/sf | Match |
|---|---|---|---|---|---|---|---|
| 404 Hatton St | 0.09mi | 2/1.0 (-1) | 992 (-6%) | 19mo | $54,000 | $54 | 65 |
| 113 Iris Dr | 0.68mi | 2/1.0 (-1) | 1,140 (+8%) | 24mo | $134,500 | $118 | 30 |
Match score weights: distance 35% · size 25% · config 20% · recency 20%. Top-matched comps best support the ARV.
Projected returns pro-forma
-3.0% appreciation · 5.19% rent growth · sell at horizon
- IRR
- -1.4%
- Equity multiple
- 0.94×
- Total profit
- $-2,333
- Equity at exit
- $22,216
- IRR
- 10.5%
- Equity multiple
- 1.90×
- Total profit
- $37,365
- Equity at exit
- $12,883
Cash invested: $41,720 (down + closing). Projections, not guarantees.
Landlord ↔ Tenant lean methodology
- Overall (STATE)
- 87 Strongly Landlord-Friendly
- State Tennessee
- 87 Strongly Landlord-Friendly · R+13
- County
- — inherits STATE
- City
- — inherits STATE
ZIP-level market 38301
- Rents YoY
- 5.2%
- Active inventory
- 255
- Price-to-rent
- 7.5×
Monthly cashflow live
- Estimated rent
- $1,662 medium interval (Pro) →
- Mortgage (P&I)
- −$781
- Tax est. 1.5%
- −$186 /mo · $2,235/yr
- Insurance
- −$62
- HOA
- −$0
- Vacancy / Maint / Mgmt
- −$349
- Net cashflow
- $283
Break-even live
Sensitivity live
| Price | -10% $386 | -5% $335 | +0% $283 | +5% $232 | +10% $180 |
|---|---|---|---|---|---|
| Rent | -10% $152 | -5% $218 | +0% $283 | +5% $349 | +10% $415 |
| Rate | -1.0pp $358 | -0.5pp $321 | base $283 | +0.5pp $245 | +1.0pp $205 |
UW: 25.0% down · 7.5% · 30yr · 1.5% tax · 5.0% vac · 8.0% maint · 8.0% mgmt
Financing live
Cash to close
- Down payment
- $37,250
- Closing costs
- $4,470
- Reserves months
- —
- Total cash needed
- —
Loan-product check · same deal, 3 products live
Conventional
25% down · 7.5% · 30yr
- Down + closing
- —
- Monthly P&I
- —
- Monthly cashflow
- —
- DSCR
- —
- Eligible?
- —
Personal DTI + credit; lowest rate.
DSCR
20% down · 8.5% · 30yr
- Down + closing
- —
- Monthly P&I
- —
- Monthly cashflow
- —
- DSCR
- —
- Eligible?
- —
No personal income docs; deal must DSCR.
Hard money
10% down · 12.0% · 12mo
- Down + closing
- —
- Monthly P&I
- —
- Monthly cashflow
- —
- DSCR
- —
- Eligible?
- —
Short-term bridge; refi at stabilization.
Rent comps 1 comps
| Address | Beds | Baths | Sqft | Rent | $/sqft | DOM | Units | Dist |
|---|---|---|---|---|---|---|---|---|
| 102 Jackson Walk Plz Jackson, TN | 1.0–3.0 | 1.0–2.5 | 1082 | $2,600 | $2.40 | 45d | 1 | 0.66mi |
Listing history 6 events
-
2026-06-05statusdays on market $149,000 Pending 46 DOM
-
2026-06-03days on market $149,000 Active 45 DOM
-
2026-04-19status Active
-
2026-04-08status Pending
-
2026-03-30$149,000 Active
-
2001-03-29soldstatus $16,500
ⓘ Source: listings_history table (triggers on properties + properties_extension) + one-shot
backfill from property_details.listing_events for pre-trigger history.
Climate risk First Street
- Flood 1/10 Low FEMA zone X (unshaded) · 0% chance over 30 yrs
- Wildfire 1/10 Low
- Heat 6/10 Major 7 d/yr ≥108°F today · 20 d/yr by 30 yrs out
- Wind 4/10 Moderate 15% chance of damaging wind over 30 yrs
- Air quality 1/10 Low 0 unhealthy d/yr today · 0 by 30 yrs out
Nearby sold comps map
Loading sold comps map…
Walkable amenities ~0.75 mi
Loading nearby amenities…
Taxation est. · year 1
- Rental income
- $19,944
- − Mortgage interest
- −$8,346
- − Property taxes
- −$2,235
- − Insurance
- −$745
- − Repairs & maintenance
- −$1,596
- − Management
- −$1,596
- − Depreciation
- −$4,335
- Taxable income
- $1,093
- Est. tax owed @ 24.0%
- −$262
- After-tax cash flow
- $3,137/yr
For passive investors: Depreciation is non-cash, so a rental often shows a tax loss while cash-flowing — sheltering income. Rental losses are passive: they offset passive income freely, and up to $25,000/yr can offset ordinary (W-2) income if you actively participate and your MAGI is under $100k (phasing out to $0 by $150k); unused losses carry forward. On sale, claimed depreciation is recaptured at up to 25%, and gains may owe capital-gains tax (a 1031 exchange can defer both). Figures are a year-1 estimate at your 24.0% rate — not tax advice; consult a CPA.
Schools (NCES district)
- District
- Madison County
- NCES district ID
- 4702580
- Math proficiency
- 10% ▼ -11.00%
- Reading proficiency
- 17% ▼ -4.00%
- Median HH income
- $42,015
- Composite
- 11.74/100
- National rank
- #9687
- State rank
- #131 of 139 in TN
Livability — Jackson
- Score
- 62/100
- State rank
- #216
- US rank
- #16488
Category grades
Schools grade is shown separately in the Schools card above.
Census & demographics
- Census place
- Jackson, TN
- County
- Madison County · 87,024 people
- City population
- 87,024
- Metro
- Jackson, TN
- Population (ZIP)
- 33,536
- Household income
- $43,227
- Rent vs Own
- Severe rent burden
- 1701.0
Population outlook (Madison County) Hauer SSP2
- Today (2025)
- 95,952 people
- By 2030
- 94,264 · -1.8%
- By 2040
- 89,607 · -6.6%
- By 2050
- 84,133 · -12.3%
- By 2075
- 72,215 · -24.7%
- By 2100
- 62,062 · -35.3%
Race, ethnicity, and origin ACS 2023
- Neighborhood character
- Diverse neighborhood (Simpson 0.57)
- Race & ethnicity
- Black 50% White 42% Two or more races 5% Hispanic / Latino 4%
- Common ancestry
- Slovak 1% Serbian 1% Portuguese 1%
- Foreign-born
- 3% · Canada
- Languages at home
- 96% English-only · Spanish 3%
Political lean MEDSL · Madison
- 2024 margin
- R (+18.2) · D 40.3% · R 58.5% · Other 1.2%
- 2008→2024 swing
- +3.4pp toward D · 2008: -21.6pp · 2024: -18.2pp
- All cycles
- 2024: R+18.2 2020: R+12.9 2016: R+15.6 2012: R+8.9 2008: R+21.6
Not yet ingested
- Civics
- —
Market trends
- HPI YoY
- ▼ -112.26%
- Current HPI
- 162.2273
- Rent YoY
- ▲ 5.19%
- Metro
- Jackson, TN
- State GDP YoY
- ▲ 2.78%
- F500 in state
- 22
Industry mix (Fortune 500 HQ in TN)
| Industry | F500 HQs | Revenue |
|---|---|---|
| Healthcare | 3 | $91B |
|
||
| Retail | 3 | $72B |
|
||
| Transportation / Logistics | 1 | $88B |
|
||
| Paper / Packaging | 1 | $19B |
|
||
| Insurance | 1 | $13B |
|
||
| Energy | 1 | $12B |
|
||
Price history
+803.0% since first listed4 events — show timeline
- 2026-04-19 Relisted — CWTAR
- 2026-04-08 Pending — CWTAR
- 2026-03-30 Listed $149,000 CWTAR
- 2001-03-29 Sold (Public Records) $16,500 Public Records
Property tax history
+0.3%/yrLatest (2025): $290 · -20.1% YoY. Source: county tax records.
Cash-flow waterfall
monthlySold comps — $/sqft
last 12 mo · ≤1 miLoading sold comps…